In an era focused on sustainability, tracking the success of circular economy initiatives is essential for businesses aiming to reduce waste, improve resource efficiency, and promote long-term environmental health. The Circular Economy KPI Dashboard in Google Sheets is a powerful tool that helps businesses track key performance indicators (KPIs) related to their circular economy efforts. This ready-to-use template is designed to simplify the process of monitoring and improving circular economy metrics in your organization. In this article, we’ll explore the key features of the dashboard, the KPIs tracked, and how it can support your sustainability efforts.
What is the Circular Economy KPI Dashboard?
The Circular Economy KPI Dashboard in Google Sheets is a tool designed to help businesses measure the effectiveness of their circular economy practices. The dashboard provides a comprehensive overview of important sustainability metrics, allowing businesses to monitor waste reduction, resource efficiency, recycling efforts, and more. With this dashboard, you can easily track KPIs such as waste recycling rates, product lifecycle analysis, and energy savings, helping your business move towards a more sustainable future.
This template includes several worksheets to organize your data and metrics, offering clear insights and visual representation of your circular economy performance.
Key Features of the Circular Economy KPI Dashboard
The Circular Economy KPI Dashboard includes six key worksheets to track and analyze your sustainability efforts:
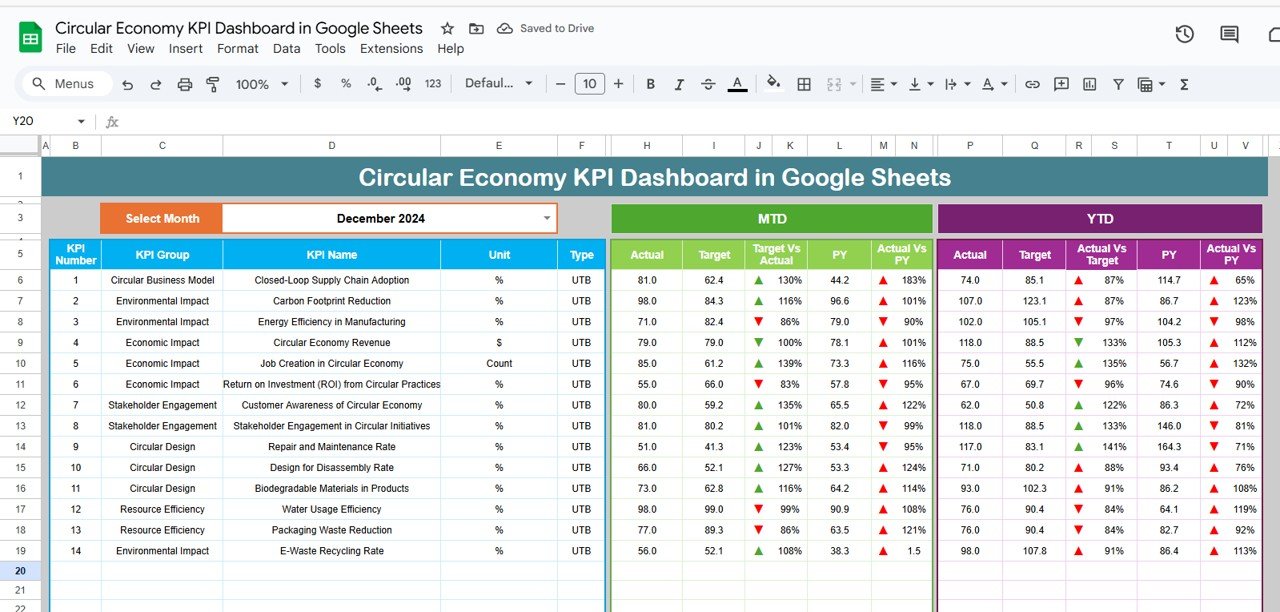
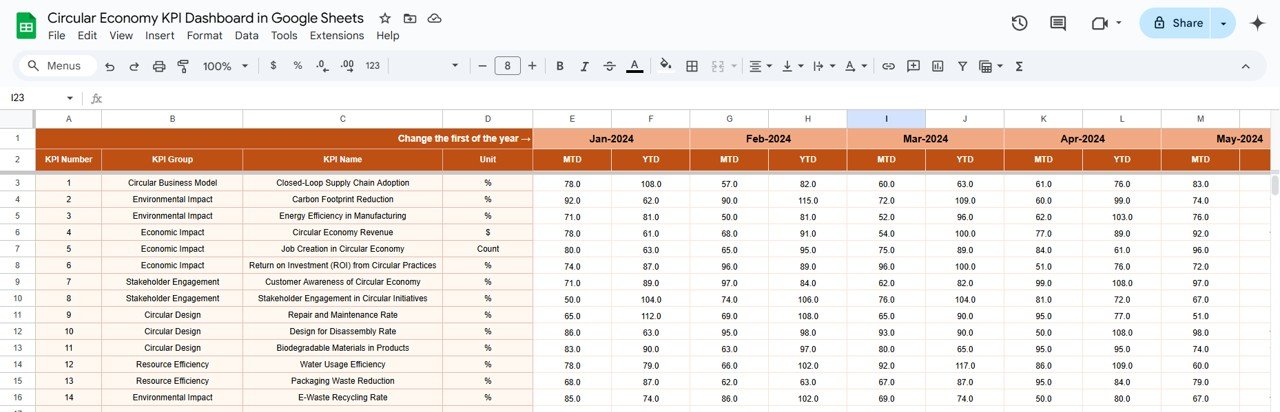
1. Dashboard Sheet Tab
The Dashboard Sheet is the main overview of the entire dashboard. It displays all KPIs with the following features:
-
MTD (Month-to-Date) Actuals: Displays actual data for the current month.
-
YTD (Year-to-Date) Actuals: Displays cumulative data for the year.
-
Target vs. Actual: Compares actual performance against set targets for both MTD and YTD.
-
Previous Year (PY) vs. Actual: Compares current year data against the previous year’s data, with conditional formatting for visual comparison (up/down arrows).
-
Month Selection: Use the dropdown (Range D3) to select a specific month, and the entire dashboard updates accordingly.
Click to buy Circular Economy KPI Dashboard in Google Sheets
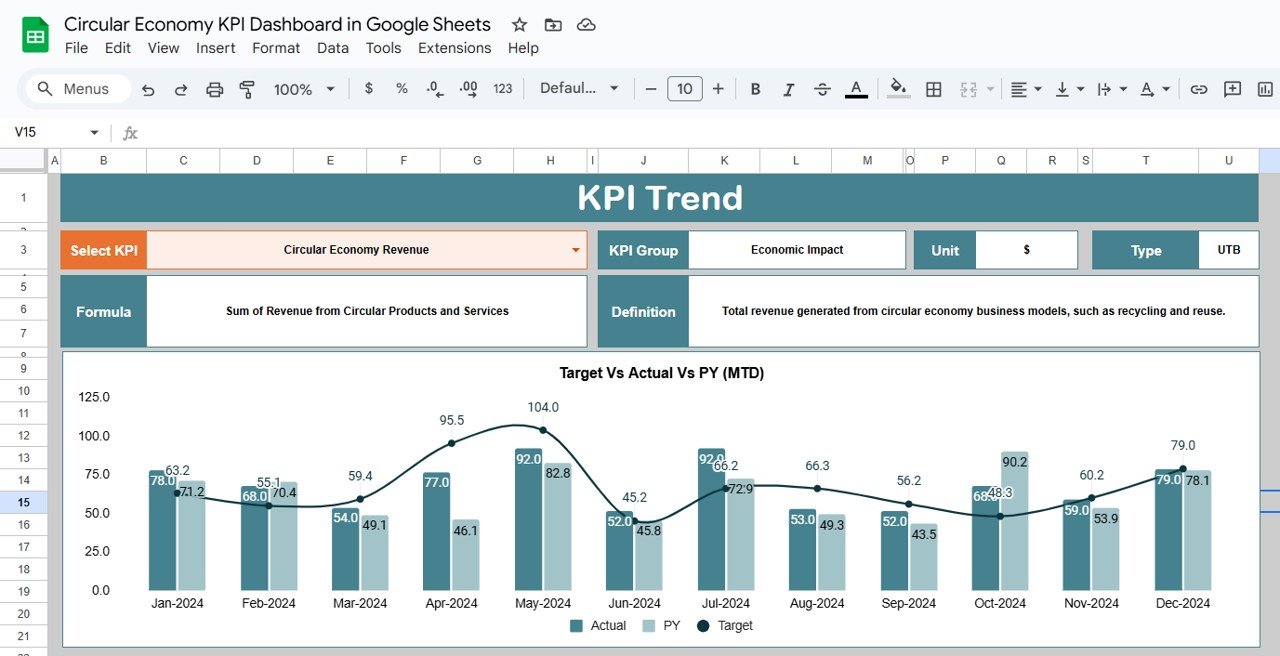
2. KPI Trend Sheet Tab
This sheet provides detailed information about each KPI, including:
-
KPI Group: The category the KPI belongs to (e.g., Waste Management, Energy Efficiency).
-
Unit of KPI: The unit of measurement for the KPI (e.g., percentage, tons).
-
KPI Type: Indicates whether the KPI is “Lower the Better” (LTB) or “Upper the Better” (UTB).
-
Formula: The formula used to calculate the KPI.
-
Definition: A brief description of the KPI and its importance.
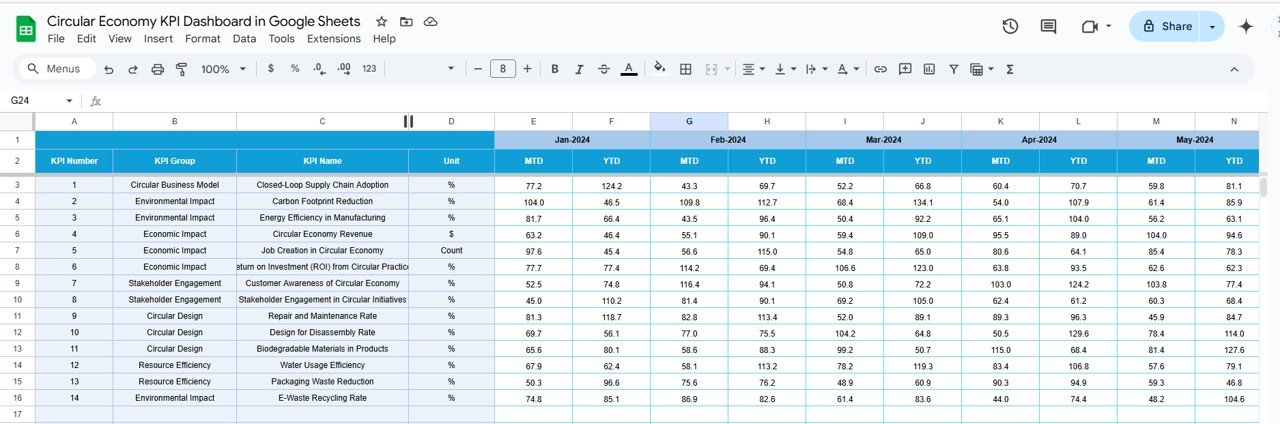
3. Actual Numbers Sheet Tab
In the Actual Numbers Sheet, you input the actual data for both MTD and YTD for the selected month. The dashboard will update automatically once you input the data.
Click to buy Circular Economy KPI Dashboard in Google Sheets
4. Target Sheet Tab
This sheet allows you to set target values for each KPI, both for MTD and YTD. By entering target numbers, you can compare them to actual values to assess your circular economy goals.
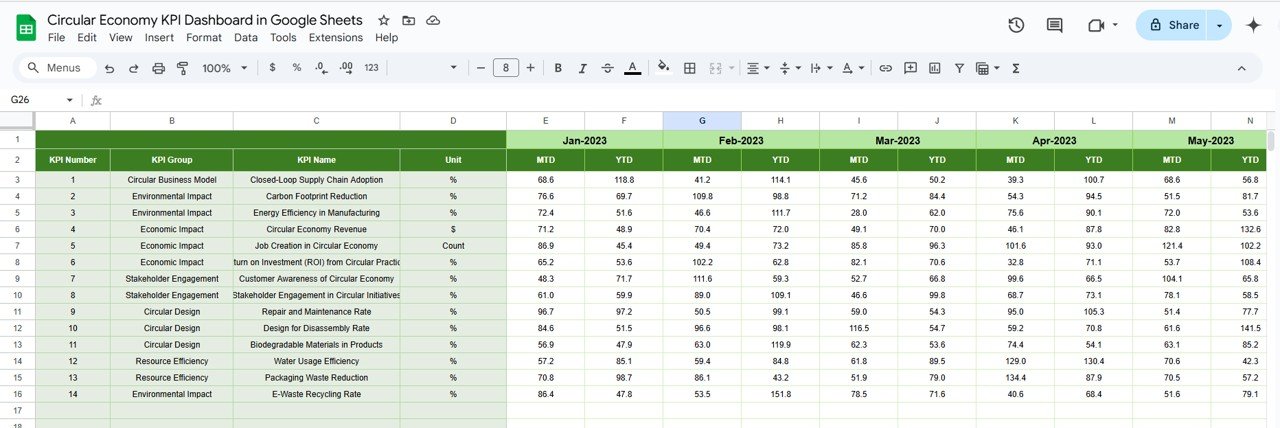
5. Previous Year Numbers Sheet Tab
This sheet captures the data for the previous year, allowing you to compare current-year performance against historical data. Simply enter the same values for the previous year as you have for the current year.
Click to buy Circular Economy KPI Dashboard in Google Sheets
6. KPI Definition Sheet Tab
This sheet defines each KPI, providing clarity and consistency. It includes:
-
KPI Name
-
KPI Group
-
Unit of Measurement
-
Formula
-
KPI Definition

Advantages of Using the Circular Economy KPI Dashboard
-
Real-Time Tracking: Monitor the performance of your circular economy initiatives in real-time with easy-to-read data and charts.
-
Comprehensive Overview: Track various sustainability metrics in one place, ensuring no aspect of your circular economy strategy is overlooked.
-
Year-over-Year Comparison: Compare current performance against previous years, helping you assess long-term improvements.
-
Customizable: The template is flexible and can be adapted to your business’s specific circular economy goals and KPIs.
-
Data-Driven Decisions: Use the dashboard’s insights to make informed decisions that improve sustainability and efficiency.
Best Practices for Using the Circular Economy KPI Dashboard
Click to buy Circular Economy KPI Dashboard in Google Sheets
To maximize the effectiveness of the Circular Economy KPI Dashboard, consider the following best practices:
-
Regularly Update Data: Ensure that both MTD and YTD data are updated regularly to reflect your current performance.
-
Set Realistic Targets: Establish achievable and challenging targets based on historical data and industry benchmarks.
-
Monitor Trends: Use the KPI Trend Sheet to track performance over time and identify areas that require more attention.
-
Compare Year-over-Year Data: Regularly use the Previous Year Numbers Sheet to assess the impact of your circular economy initiatives.
-
Review and Adjust KPIs: Continuously review your KPIs to ensure they align with your business goals and environmental sustainability objectives.
Conclusion
The Circular Economy KPI Dashboard in Google Sheets is an invaluable tool for businesses looking to track their sustainability efforts. With its comprehensive features, real-time performance tracking, and easy-to-use interface, this dashboard provides businesses with the insights needed to drive improvement in circular economy practices. Whether you’re tracking waste reduction, energy savings, or product lifecycle, this dashboard helps you stay on top of your sustainability goals.
Frequently Asked Questions (FAQs)
Click to buy Circular Economy KPI Dashboard in Google Sheets
1. What is the purpose of a Circular Economy KPI Dashboard?
The Circular Economy KPI Dashboard helps businesses track the effectiveness of their sustainability initiatives, including waste recycling, energy savings, and resource utilization.
2. Can I customize the KPIs in this dashboard?
Yes, the dashboard is fully customizable. You can modify or add new KPIs based on your specific circular economy goals.
3. How often should I update the dashboard?
You should update the dashboard regularly, ideally on a monthly or quarterly basis, to ensure you are tracking real-time data and making data-driven decisions.
4. How do I compare current performance with the previous year?
The Previous Year Numbers Sheet allows you to enter data for the previous year, making it easy to compare current performance with historical data.
5. Can I use this dashboard for multiple locations or business units?
Yes, the dashboard is flexible and can be used to track circular economy performance across different locations or business units. Simply adjust the data inputs accordingly.
Visit our YouTube channel to learn step-by-step video tutorials
Youtube.com/@NeotechNavigators
Watch the step-by-step video Demo:
Click to buy Circular Economy KPI Dashboard in Google Sheets