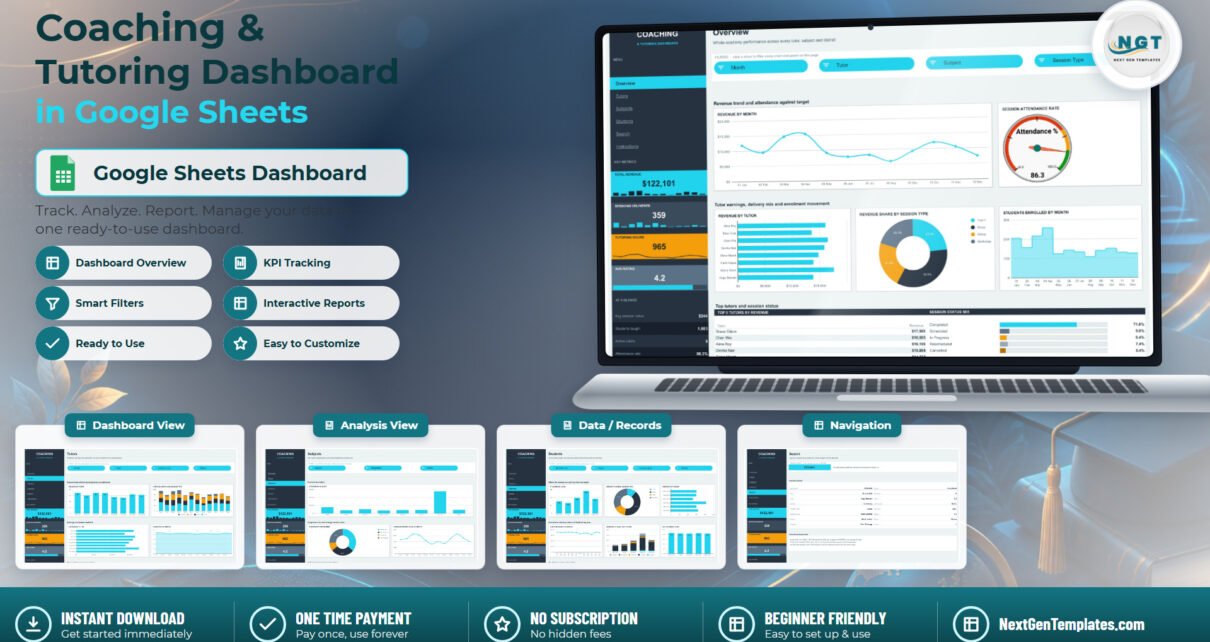
The Coaching & Tutoring Dashboard in Google Sheets is a 6-page analytics workbook that turns one session log into 18 charts, 15 slicers and 8 headline metrics. It ships wired to 1,000 sessions across 8 tutors, 8 subjects, 5 student levels and 6 districts, and every pivot, chart and panel recalculates the moment you paste your own rows into the Data tab.
Most tutoring centres already have the data. It sits in a booking sheet, a WhatsApp thread and a payments export, and nobody has time to join them up before the month closes. The result is that revenue per tutor, attendance by district and the ratio of delivered to rescheduled sessions all stay invisible until something goes wrong. The Coaching & Tutoring Dashboard in Google Sheets exists to close that gap in a single browser tab, with no add-ons, macros or scripts.
Get the Coaching & Tutoring Dashboard in Google Sheets

Key Features of the Coaching & Tutoring Dashboard in Google Sheets
The workbook is deliberately narrow: it reports on sessions that have already happened, and it does that thoroughly rather than trying to also schedule and invoice them.
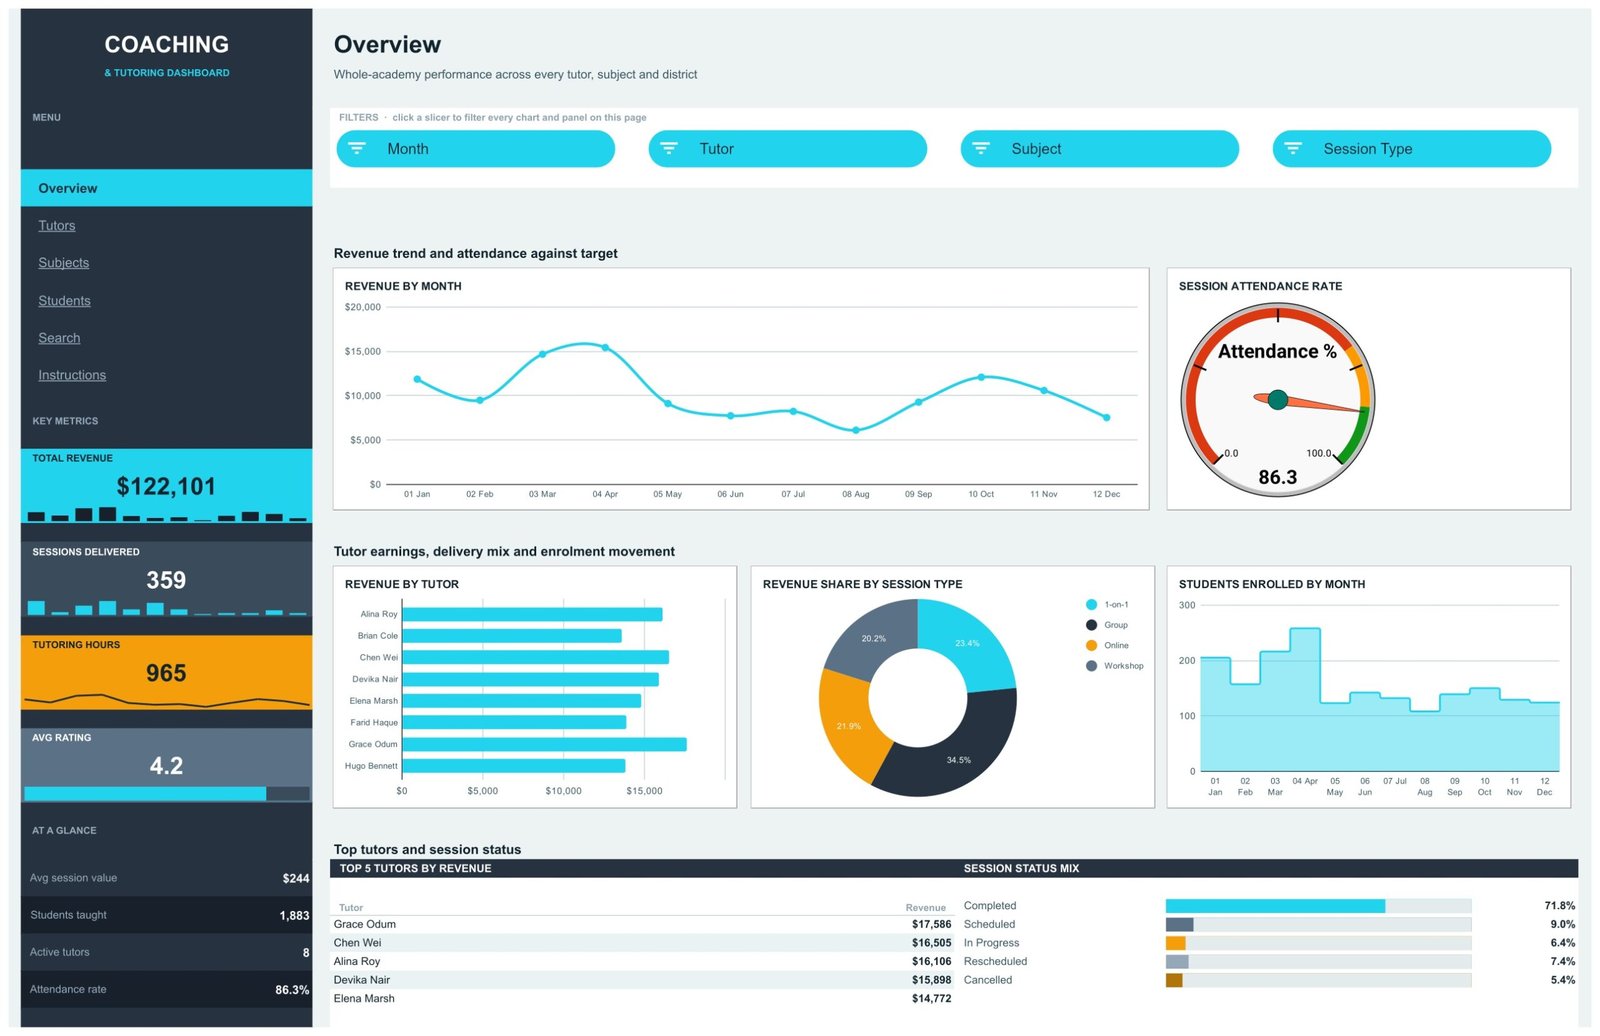
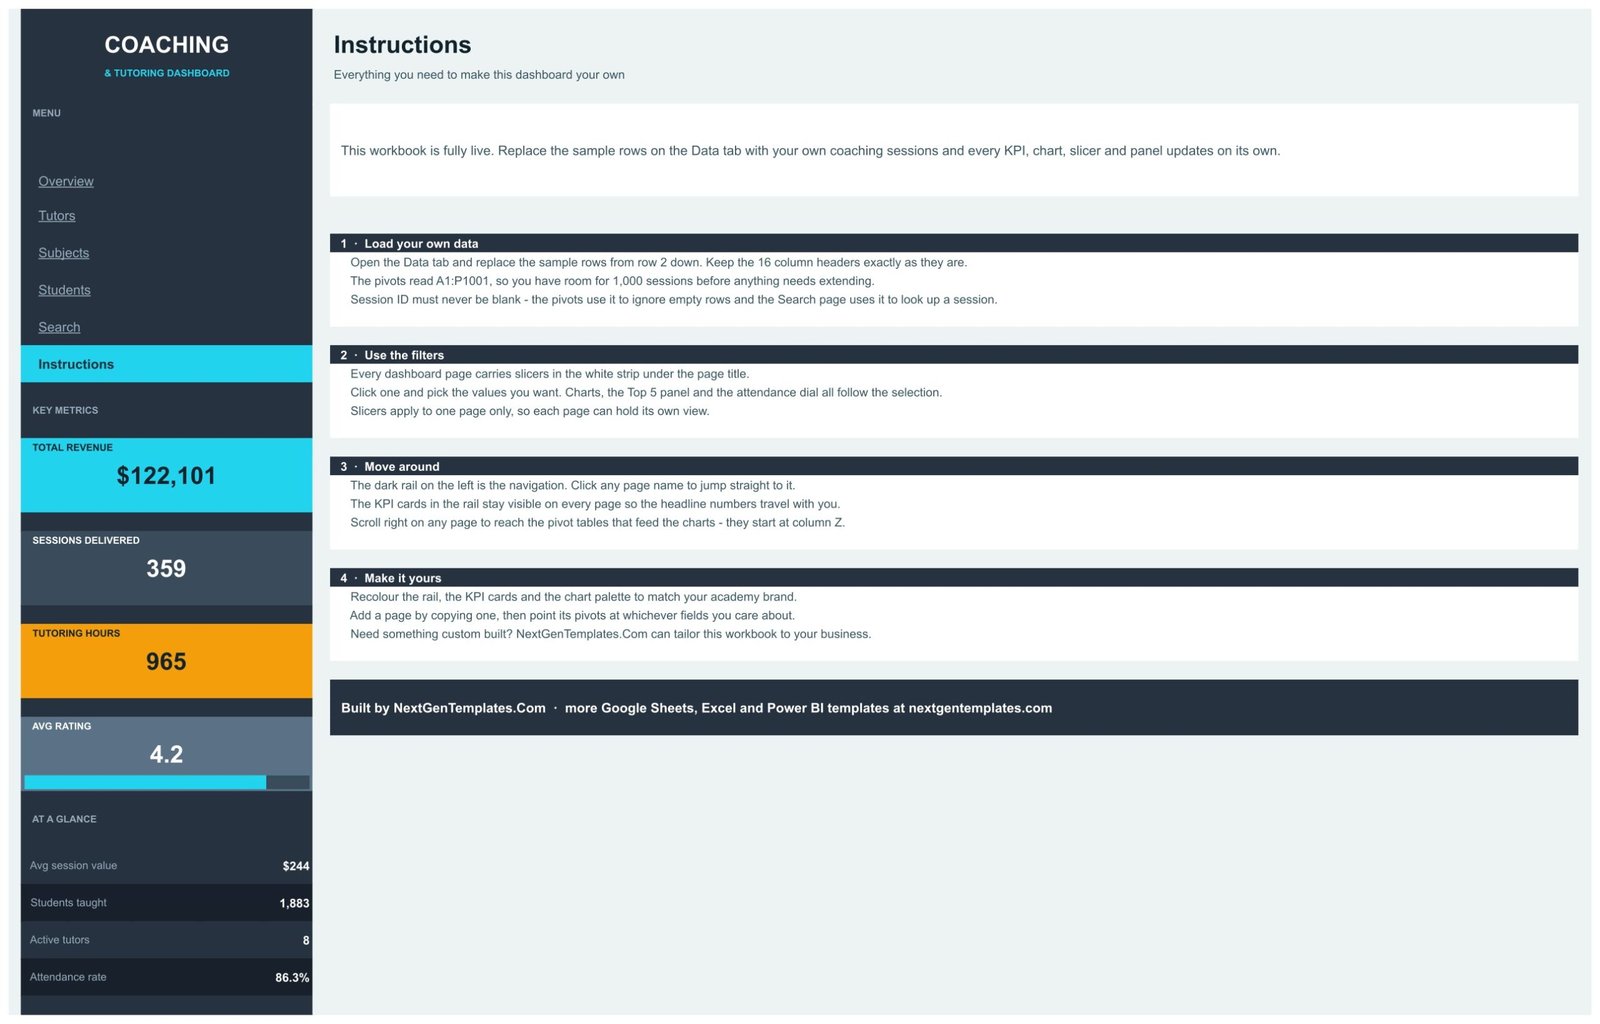
- A KPI rail that never scrolls away. Total Revenue, Sessions Delivered, Tutoring Hours and Avg Rating sit in the dark navigation rail on all six pages, each with an inline sparkline or progress bar.
- Four more metrics in the At a Glance panel. Avg session value, Students taught, Active tutors and Attendance rate, all calculated from the same session log rather than typed in.
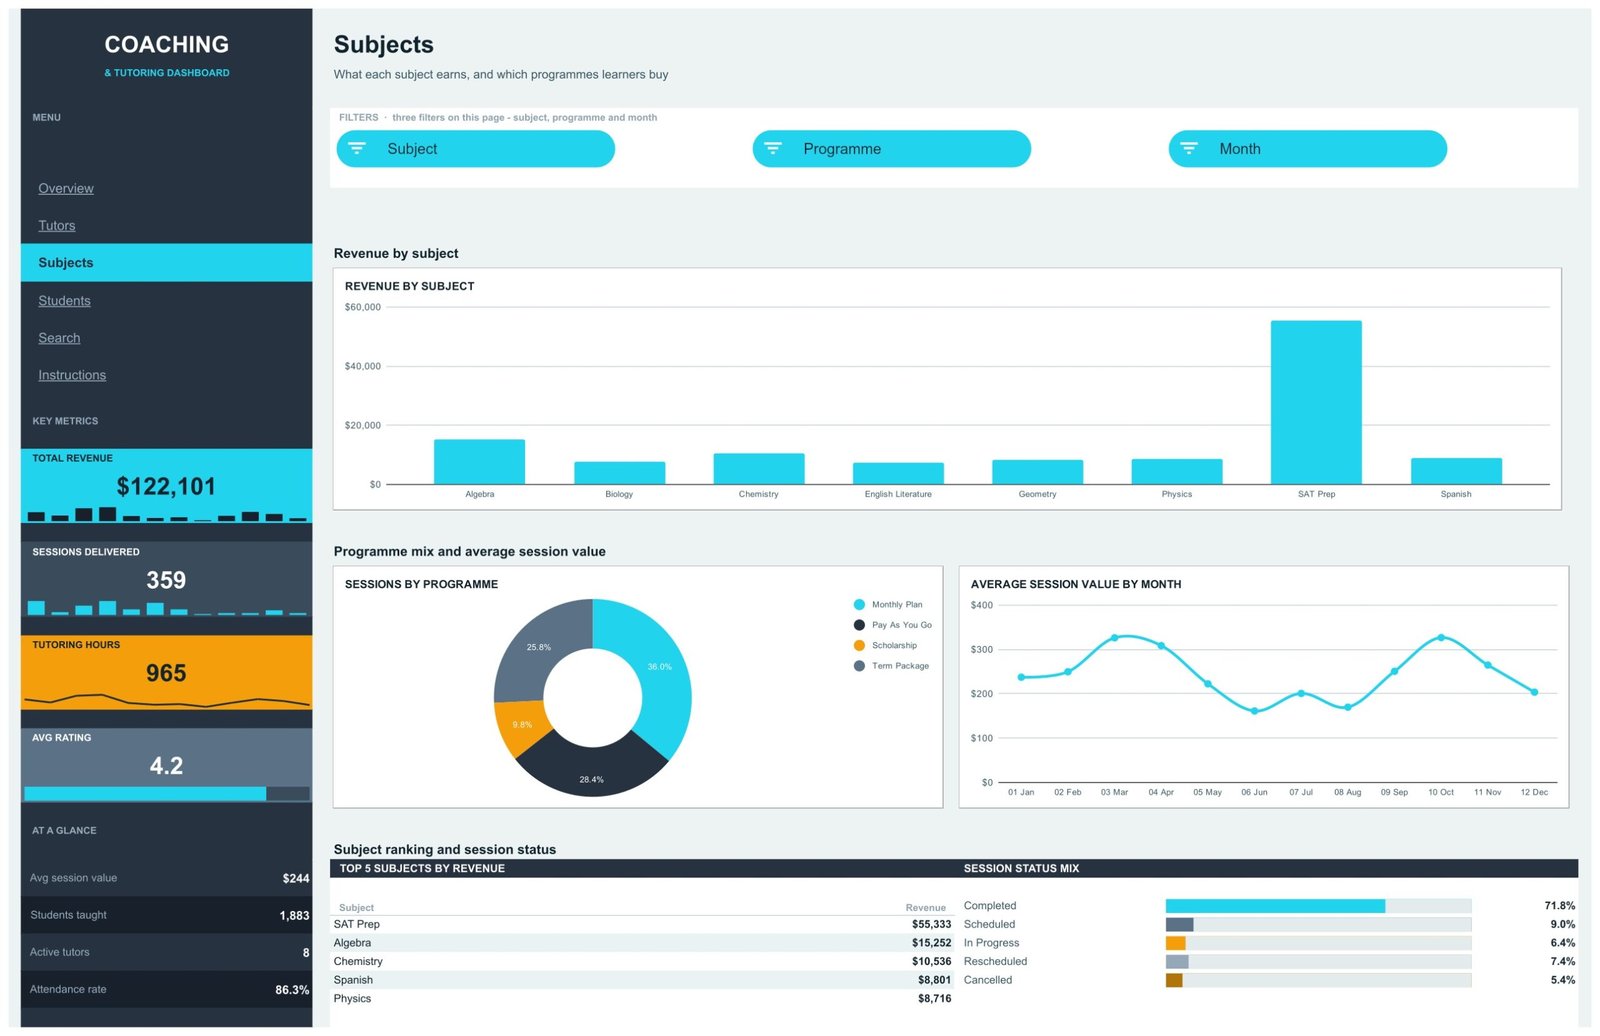
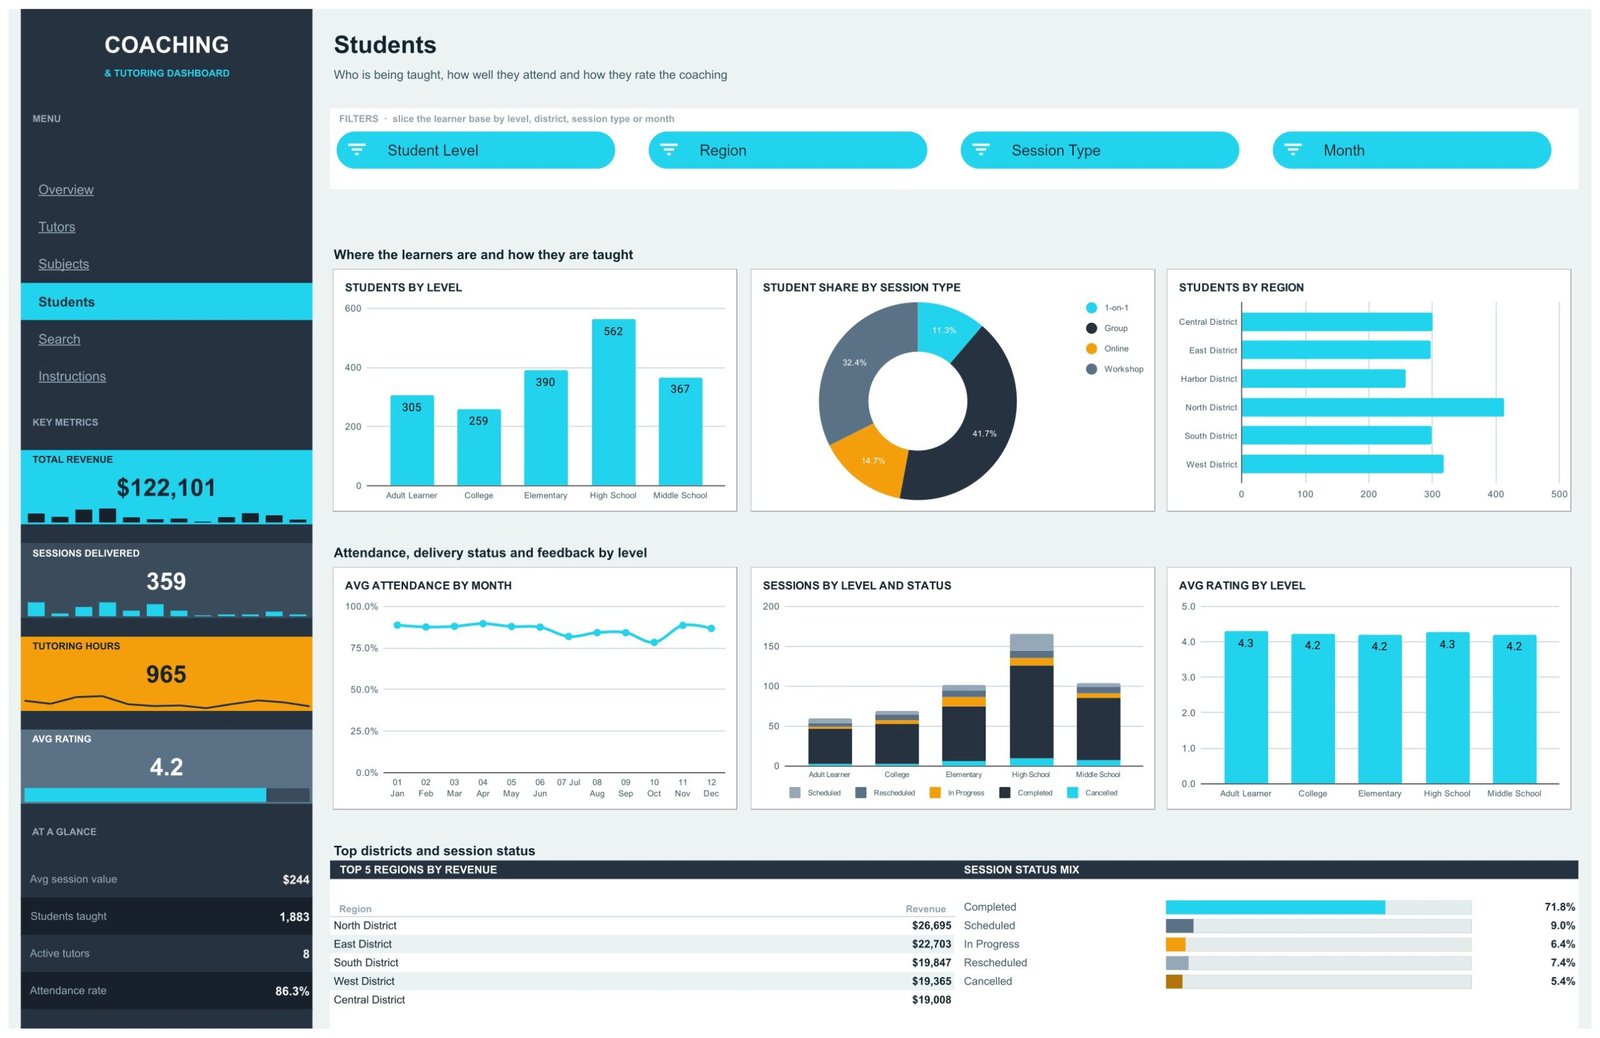
- 15 slicers, scoped per page. Overview filters by Month, Tutor, Subject and Session Type. Tutors filters by Month, Tutor, Student Level and Status. Subjects filters by Subject, Programme and Month. Students filters by Student Level, Region, Session Type and Month.
- 18 charts driven by pivot tables. Line, area, column, stacked column, bar and donut charts plus a gauge dial for Session Attendance Rate. Each page’s pivots begin at column Z, so nothing on screen is a pasted picture.
- A Top 5 panel and a Session Status Mix bar on every analysis page. The status mix splits Completed, Scheduled, In Progress, Rescheduled and Cancelled sessions — the breakdown most owners never see.
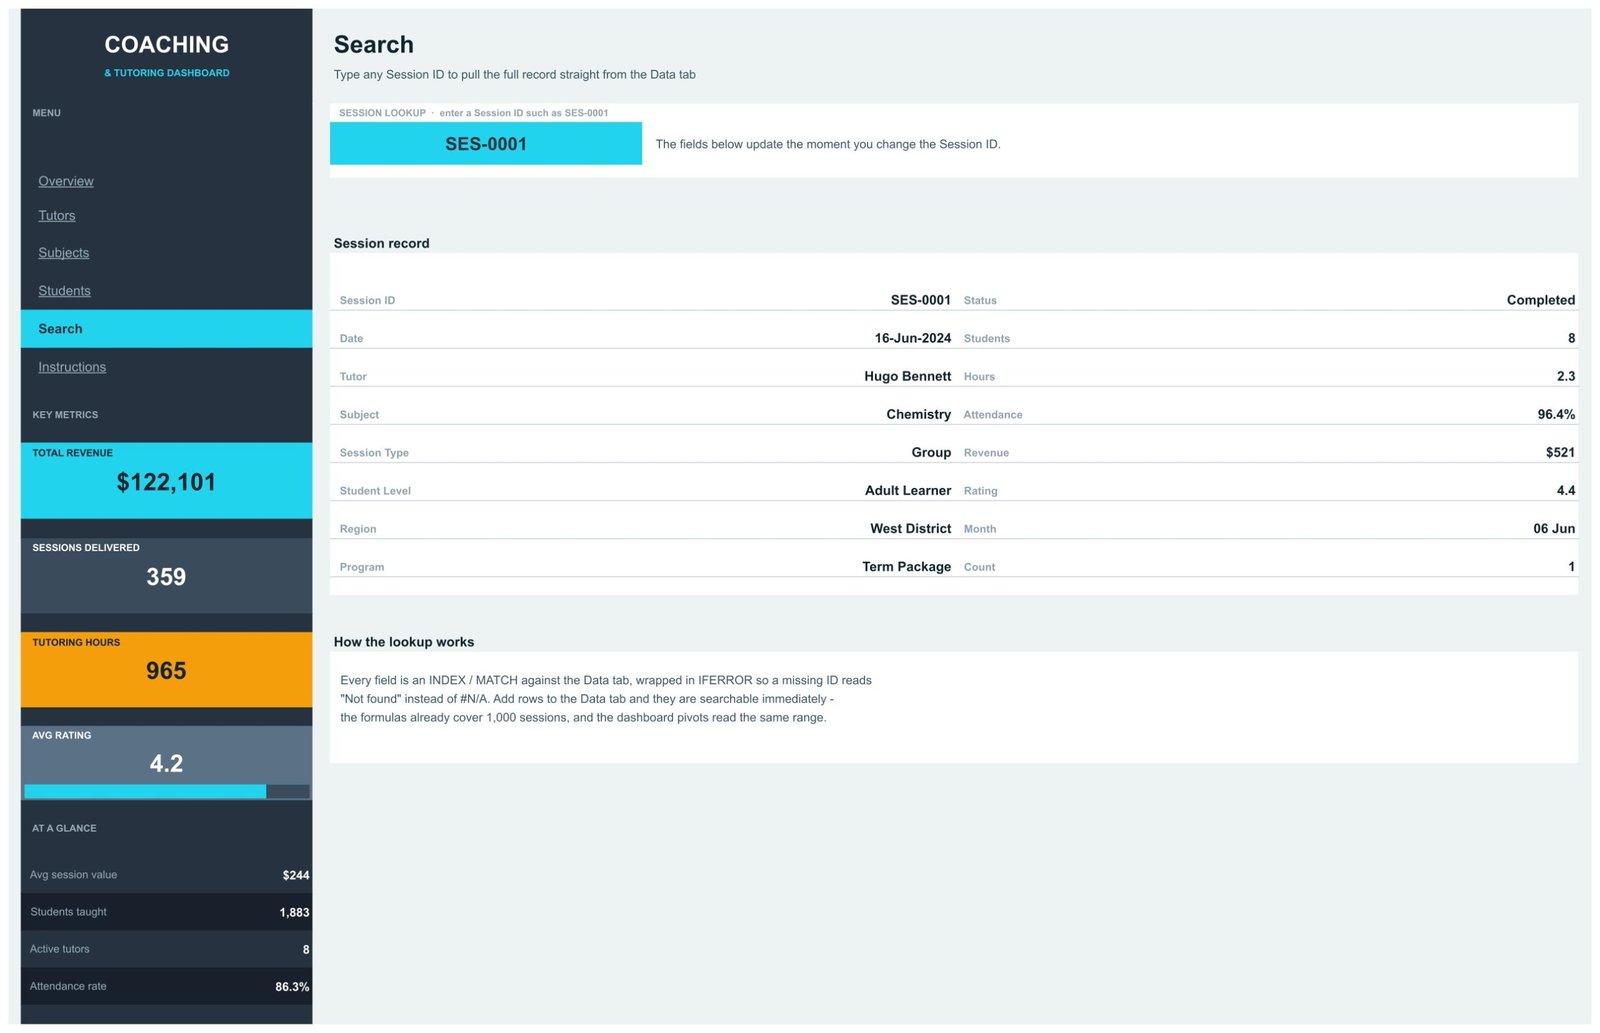
- A dedicated Session ID lookup page that returns 16 fields for any session through INDEX/MATCH wrapped in IFERROR.
Dashboard Pages Explanation
Six pages plus the Data tab. The Data tab carries 16 columns — Session ID, Date, Tutor, Subject, Session Type, Student Level, Region, Program, Status, Students, Hours, Attendance, Revenue, Rating, Month and Count — and the pivots read A1:P1001.
Overview
Whole-academy performance across every tutor, subject and district. Revenue by Month and the Session Attendance Rate dial sit at the top, Revenue by Tutor, Revenue Share by Session Type and Students Enrolled by Month underneath, and the page closes with Top 5 Tutors by Revenue beside the Session Status Mix.
Tutors
Workload, earnings and satisfaction for every member of the coaching team. Sessions by Tutor and Hours by Month and Session Type answer how the load is spread; Revenue by Tutor and Avg Rating by Month answer what it earns and how learners rate it. On the sample data the highest-earning tutor is Grace Odum at $17,586.

Subjects
What each subject earns and which programmes learners actually buy. Revenue by Subject ranks all eight subjects, Sessions by Programme splits Monthly Plan, Pay As You Go, Scholarship and Term Package, and Average Session Value by Month exposes pricing drift across the year.
Students
Who is being taught, how well they attend and how they rate the coaching. This is the densest page, with six charts: Students by Level, Student Share by Session Type, Students by Region, Avg Attendance by Month, Sessions by Level and Status, and Avg Rating by Level, with Top 5 Regions by Revenue below.
Search
A single-cell Session ID lookup that pulls the full record straight from the Data tab. Change the ID and all 16 fields update instantly. Because every field is an INDEX/MATCH wrapped in IFERROR, a Session ID that does not exist reads “Not found” rather than filling the page with #N/A.
Instructions
Four numbered sections: load your own data, use the filters, move around, and make it yours. It states plainly that the pivots read A1:P1001, that Session ID must never be blank, and that scrolling right on any page reaches the pivot tables that feed the charts.
Coaching & Tutoring Dashboard in Google Sheets vs. Microsoft Excel Dashboard vs. Paid Tutoring SaaS — Feature Comparison
| Feature | Coaching & Tutoring Dashboard in Google Sheets | Microsoft Excel Dashboard | TutorCruncher / Teachworks |
|---|---|---|---|
| Cost | $16.99 one-time ✅ | $19.99 one-time | $50-200 / month |
| Platform | Google Sheets, any browser ✅ | Microsoft Excel desktop | Vendor-hosted web app |
| Setup time | Under 10 minutes ✅ | Under 10 minutes | Days — onboarding and data import |
| Real-time team collaboration | Built in ✅ | Needs OneDrive co-authoring | Built in |
| Mobile access | Google Sheets mobile app ✅ | Excel mobile, limited pivots | Native apps |
| Customisable fields and charts | Fully open — edit any pivot ✅ | Fully open | Vendor-defined fields only |
| Share with a link | Yes, one Drive link ✅ | File attachment or OneDrive | Seat-based logins |
| Year-1 cost at 5 users | $16.99 ✅ | $19.99 | $3,000-12,000 |
| Session-level record lookup | Search page, 16 fields ✅ | Search page, 16 fields | Yes |
For academies that want tutor, subject and district analytics without paying per-seat scheduling-software fees, the Coaching & Tutoring Dashboard in Google Sheets sits in the sweet spot.
Who Should Use This Template
Perfect for:
- Owners of tutoring centres and coaching institutes with roughly 3-30 tutors who already keep a session log somewhere
- Academic directors reporting revenue, attendance and tutor ratings to a board or franchise head each month
- Private tutors and small test-prep outfits who want a Drive link instead of a monthly subscription
- Multi-branch academies comparing performance across districts or regions
Not a fit if:
- You need live scheduling, calendar sync, parent portals or automated invoicing — this is an analytics workbook, not a booking system
- You hold more than 1,000 sessions and do not want to extend the pivot ranges yourself
- You need SSO, audit logs or role-based permissions beyond Google Drive sharing
- You want a student-facing app or a payment gateway
Real-World Use Cases
Meera runs a 12-tutor SAT and maths centre across two districts. On the first of every month she pastes the previous month’s sessions into the Data tab, opens the Subjects page to see which programme mix is actually paying, and sends her partner a screenshot of the Top 5 Tutors panel — instead of paying $120 a month for tutoring-management software she only ever opened for reports.
Daniel is academic director at a language and test-prep academy. He filters the Students page by Region and Student Level to find where attendance is slipping, then switches to the Tutors page and filters by Status to see how many sessions were rescheduled rather than delivered before he signs off tutor payouts.
Priya tutors chemistry and biology on her own. She uses the Search page to pull up a single session when a parent queries an invoice, and shows returning families the Avg Rating by Month chart to demonstrate that her feedback scores have held steady across the year.
Advantages of the Coaching & Tutoring Dashboard in Google Sheets
It costs $16.99 once. A hosted tutoring platform runs $50-200 a month, so a single academy on the cheapest tier spends more in the first month than this workbook costs outright — and keeps spending every month after.
Setup is measured in minutes, not onboarding calls. Copy the file to your Drive, paste your sessions in, keep the 16 headers. There is no import wizard, no field mapping and no vendor to schedule a call with.
Nothing is hidden. Every chart reads a pivot you can open, edit and repoint. If your academy tracks something the template does not — exam boards, referral source, teacher seniority — you add the column and build the pivot yourself, which is impossible in a closed platform.
Sharing is a link. Google Drive permissions do the work, so a branch manager sees the same live numbers as head office with no extra seat cost. Google’s own guidance on sharing and permissions covers restricting editors if you want the file read-only for some staff.
Opportunities for Improvement
Being honest about the edges matters more than a longer feature list.
- The 1,000-row ceiling is real. The pivots read A1:P1001. A busy centre delivering 100 sessions a month fills that in under a year, at which point you widen the pivot source ranges by hand. It is a two-minute job, but it is a job.
- Slicers are shared, not personal. Because everyone works in the same Google Sheets file, a filter one person sets is visible to everyone in the file at that moment. For simultaneous independent analysis, each person needs their own copy.
- No scheduling or billing. The workbook reports on sessions that already happened. It will not book a lesson, send a reminder or raise an invoice.
- Rating is only as good as your collection. The Avg Rating card and the Avg Rating by Month and by Level charts assume you are already capturing a rating per session. If that column is sparse, those three visuals will mislead.
- The Search page takes one Session ID at a time. It is a record viewer, not a filtered list export.
Best Practices
- Never leave Session ID blank. The pivots use it to ignore empty rows and the Search page uses it to find a record. A blank ID quietly drops a session out of every total.
- Keep the 16 headers exactly as shipped. Rename a header and the pivot that reads it breaks; add your own columns to the right instead.
- Paste values, not formatted cells. Bringing formatting across from an export is the fastest way to make the Data tab hard to read.
- Clear slicers before you screenshot. A filtered page looks identical to an unfiltered one — check the strip under the page title before sharing a number.
- Recolour once, at the start. The rail, the KPI cards and the chart palette all take your academy’s colours; doing it before you share the file saves re-explaining that it is your own workbook.
- Keep a monthly snapshot. Duplicate the file at month end so you have a frozen record even after the Data tab is overwritten.
Explore Relevant Templates
The same academy analytics are published for two other tools. The Coaching & Tutoring Dashboard in Excel suits teams working offline in a workbook, and the Coaching & Tutoring Dashboard in Power BI suits anyone publishing to a Power BI workspace.
If you would rather score the business against monthly targets than explore it, the Coaching & Tutoring KPI Dashboard in Excel and the Coaching & Tutoring KPI Dashboard in Power BI are the scorecard versions, with a month picker and traffic lights instead of slicers.
For neighbouring views of the education sector in the same tool, look at the Tutoring Business Dashboard in Google Sheets, the Student Academic Insights Dashboard in Google Sheets, the Education Services Dashboard in Google Sheets and the EdTech Dashboard in Google Sheets. To capture sessions before they reach the dashboard, pair it with the Class Schedule Data Entry System in Excel or the E-learning Course Calendar in Google Sheets.
More on this blog: Tutoring Business Dashboard in Google Sheets, Coaching Business Dashboard in Google Sheets and Professional Training and Coaching Dashboard in Google Sheets.
Prefer to learn the techniques behind a dashboard like this? The Excel Pivot Tables & Dashboards course on NextGenTemplates Academy teaches them with practice files.
Frequently Asked Questions
What metrics does the Coaching & Tutoring Dashboard in Google Sheets track?
The Coaching & Tutoring Dashboard in Google Sheets tracks 8 headline metrics — Total Revenue, Sessions Delivered, Tutoring Hours, Avg Rating, Avg session value, Students taught, Active tutors and Attendance rate — plus revenue and session breakdowns by tutor, subject, programme, student level, region and session type.
How long does setup take?
Under 10 minutes. Click the Google Sheets link in the PDF to copy the file to your Drive, paste your own sessions into the Data tab keeping the 16 column headers, and every KPI card, chart, slicer and panel in the Coaching & Tutoring Dashboard in Google Sheets recalculates automatically.
How many sessions can it hold?
The pivots in the Coaching & Tutoring Dashboard in Google Sheets read A1:P1001, so 1,000 sessions fit with no changes at all. Beyond that you widen the pivot source ranges yourself, and the charts and formulas follow the wider range automatically.
How does this compare to TutorCruncher or Teachworks?
Those are hosted scheduling and billing platforms costing $50-200 a month. The Coaching & Tutoring Dashboard in Google Sheets is a $16.99 one-time analytics workbook: it will not book lessons or invoice parents, but it gives you tutor, subject, district and attendance reporting you own outright and can edit freely.
Do I need Excel or an add-on?
No. The Coaching & Tutoring Dashboard in Google Sheets runs entirely in Google Sheets in a browser, with no add-ons, scripts or macros. A free Google account is enough, and Google’s pivot table documentation covers anything you want to extend.
Can my whole team use it at once?
Yes. The Coaching & Tutoring Dashboard in Google Sheets lives in Google Drive, so you share one link and colleagues work together in real time at no extra cost per seat. Remember that slicer selections are shared, so a filter one person applies is visible to everyone in the file.
Is the sample data real?
No. Every figure shipped in the Coaching & Tutoring Dashboard in Google Sheets — the tutors, subjects, districts, revenue and ratings — is demonstration data created for the template so the charts render populated. Replace it with your own records before drawing any conclusion from it.
About the Author
Built by PK — Microsoft Certified Professional with 15+ years of Excel, Google Sheets and Power BI experience. Founder of NextGenTemplates, reaching 300K+ subscribers across YouTube channels. Every template is hand-built and tested before release.
Conclusion
If your academy already logs its sessions somewhere, the Coaching & Tutoring Dashboard in Google Sheets is the shortest route from that log to a report you would be happy to show a board: 6 pages, 18 charts, 15 slicers and a session lookup, in a file you own and can change.
Get the Coaching & Tutoring Dashboard in Google Sheets
Instant download · One-time payment · No subscription
Last updated: September 2026