Organizations today operate under strict regulatory requirements. Businesses must follow compliance rules related to financial reporting, data privacy, labor laws, environmental regulations, and workplace safety. Because regulatory environments continue to evolve, companies must constantly monitor compliance performance to avoid risks, penalties, and operational disruptions.
However, many organizations still track compliance activities using scattered spreadsheets and manual reports. As a result, managers struggle to monitor compliance checks, identify risks, and track regulatory performance across departments and locations.
Therefore, companies need a centralized system that can track compliance activities clearly and provide actionable insights.
This is where the Compliance Dashboard in Google Sheets becomes extremely valuable.
The Compliance Dashboard in Google Sheets is a ready-to-use analytics template designed to track compliance checks, monitor risk levels, and evaluate regulatory performance across departments, locations, and compliance areas. The dashboard uses interactive charts, KPI cards, and filters to provide clear visibility into compliance operations.
In this article, you will learn what a Compliance Dashboard in Google Sheets is, why organizations need it, its key features, important compliance metrics, advantages, best practices, and frequently asked questions.
What is a Compliance Dashboard in Google Sheets?
Click to Buy Compliance Dashboard in Google Sheets
A Compliance Dashboard in Google Sheets is a performance monitoring tool that helps organizations track compliance checks, regulatory status, and risk levels.
The dashboard transforms compliance data into visual insights using charts, KPI cards, and filters. Because of this structure, managers can quickly analyze compliance performance and identify potential issues.
The dashboard tracks key metrics such as:
- Total compliance records
- Total compliance checks
- Passed checks
- Failed checks
- Compliance risk ratings
Additionally, the dashboard allows users to filter data by:
- Department
- Location
- Compliance Area
- Responsible Team
- Status
Because of these filters, organizations can analyze compliance performance from multiple perspectives.
Why Do Organizations Need a Compliance Dashboard?
Compliance management requires continuous monitoring of regulatory activities. Companies must ensure that their operations meet industry standards and legal requirements.
However, when organizations rely on manual reporting systems, several challenges appear.
For example:
- Compliance data becomes difficult to track
- Risk levels remain unclear
- Managers cannot identify non-compliant areas quickly
- Regulatory reporting becomes time-consuming
Therefore, organizations need a centralized compliance monitoring system.
The Compliance Dashboard in Google Sheets provides a structured way to track compliance checks, evaluate performance, and identify risk areas. As a result, managers can take corrective action before issues escalate.
Key Features of the Compliance Dashboard in Google Sheets
Click to Buy Compliance Dashboard in Google Sheets
The Compliance Dashboard includes multiple analytical pages that provide insights into compliance performance across departments, locations, and compliance areas.
Each page focuses on a different dimension of compliance monitoring.
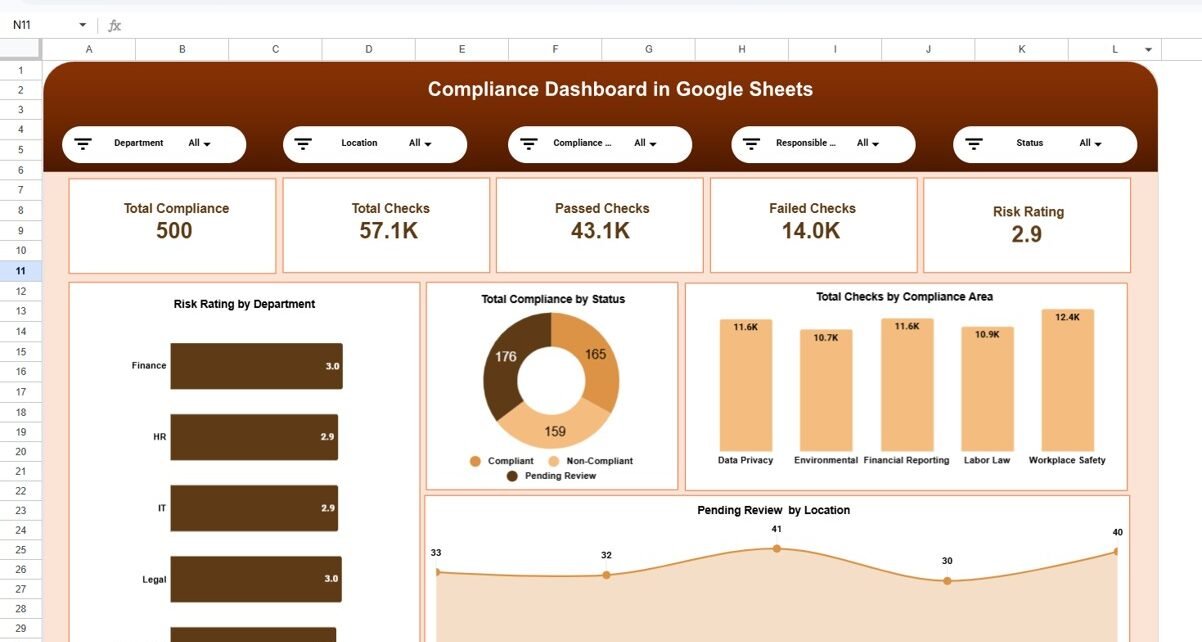
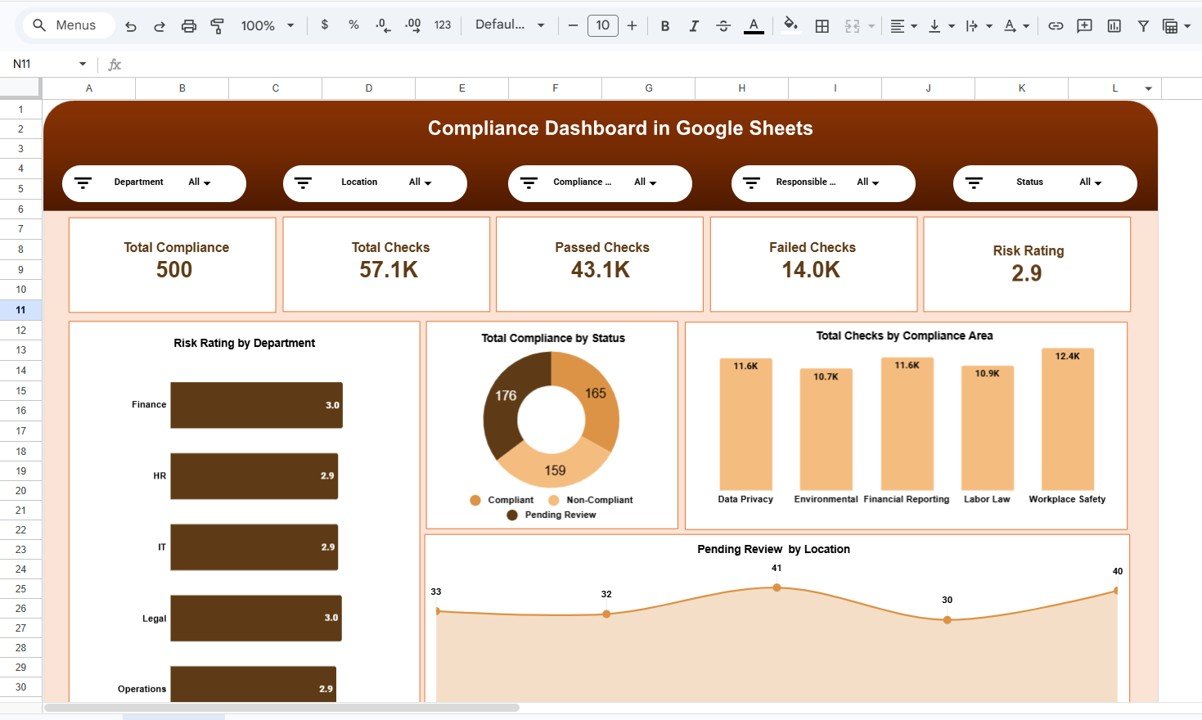
1. Overview Dashboard – Monitor Overall Compliance Performance
The Overview Page acts as the main control center for compliance monitoring.
This page provides a quick summary of compliance performance using key KPI cards and charts.
Key KPI Metrics Displayed
The dashboard highlights several important compliance metrics:
- Total Compliance Records – 500
- Total Checks – 57.1K
- Passed Checks – 43.1K
- Failed Checks – 14.0K
- Risk Rating – 2.9
These KPIs help managers quickly understand the overall compliance status.
Filters Available on the Dashboard
Users can apply filters to analyze compliance data more effectively.
The filters include:
- Department
- Location
- Compliance Area
- Responsible Person or Team
- Status
These slicers allow users to customize the dashboard view and perform detailed analysis.
Click to Buy Compliance Dashboard in Google Sheets
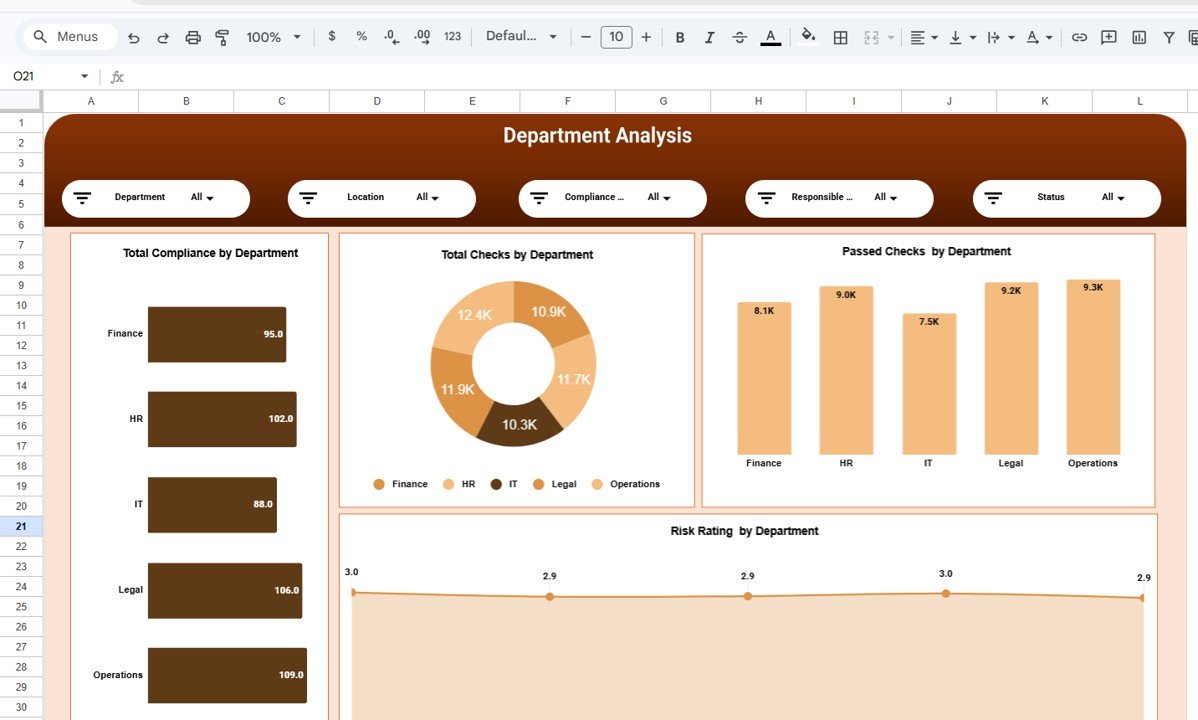
2. Department Analysis – Evaluate Compliance by Department
The Department Analysis Page helps organizations analyze compliance performance across different departments.
Departments often operate with different regulatory responsibilities. Therefore, analyzing compliance performance at the departmental level becomes essential.
Charts Available on This Page
The page includes several visualizations such as:
- Total Compliance by Department
- Total Checks by Department
- Passed Checks by Department
- Risk Rating by Department
For example, departments such as Finance, HR, IT, Legal, and Operations may have different compliance risk levels. By analyzing these metrics, managers can identify departments that require additional attention.
Click to Buy Compliance Dashboard in Google Sheets
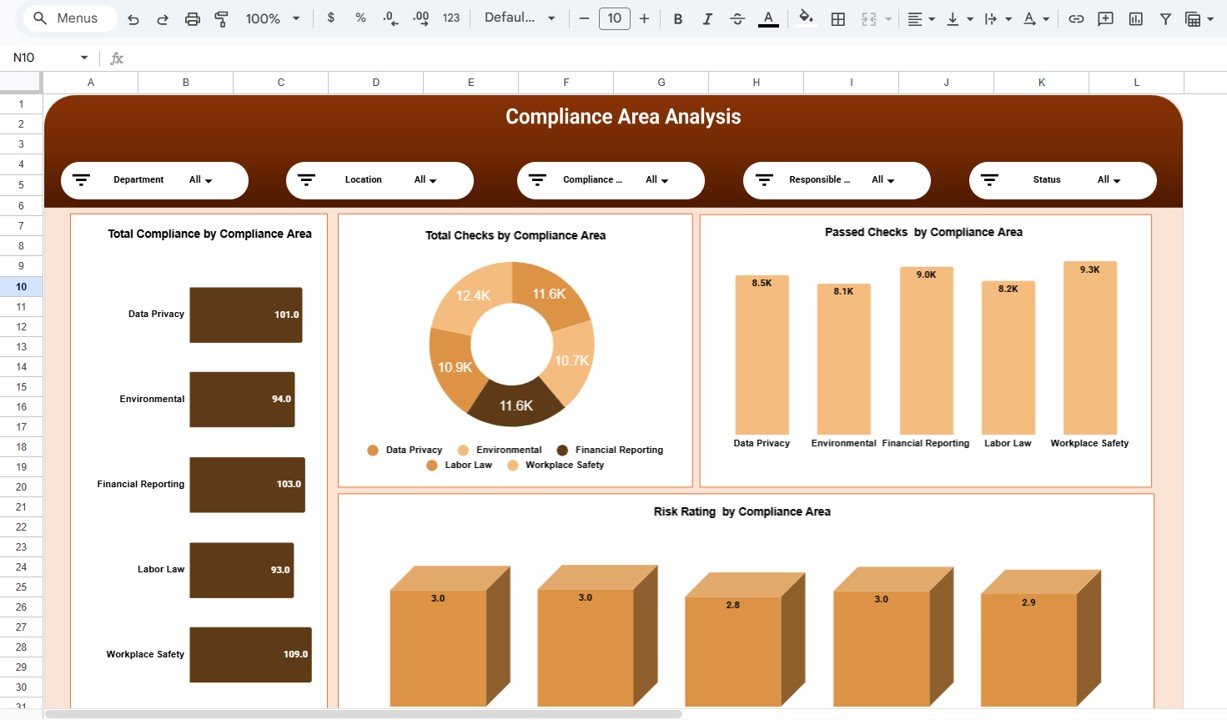
3. Compliance Area Analysis – Understand Regulatory Compliance Areas
Organizations must follow multiple regulatory standards. Each compliance area represents a different regulatory requirement.
Common compliance areas include:
- Data Privacy
- Environmental Regulations
- Financial Reporting
- Labor Law Compliance
- Workplace Safety
The Compliance Area Analysis Page helps organizations monitor performance across these regulatory categories.
Charts Included on This Page
The dashboard displays several charts such as:
- Total Compliance by Compliance Area
- Total Checks by Compliance Area
- Passed Checks by Compliance Area
- Risk Rating by Compliance Area
These insights help organizations understand which regulatory areas require improvement.
Click to Buy Compliance Dashboard in Google Sheets
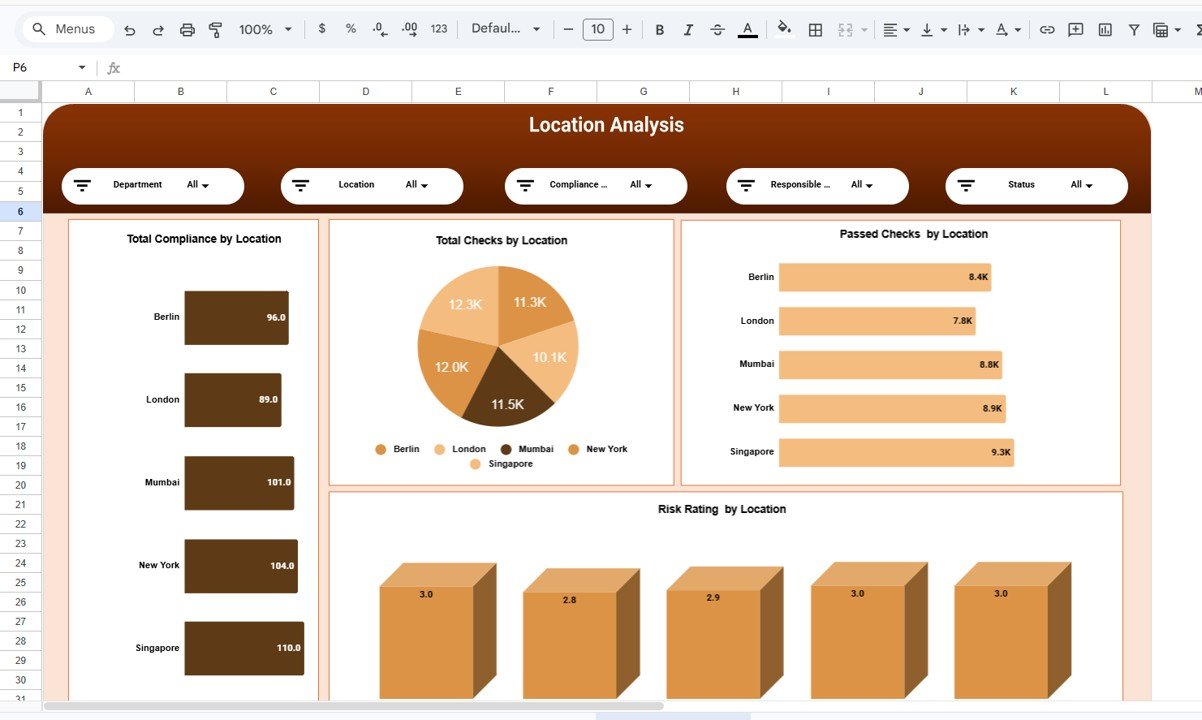
4. Location Analysis – Monitor Compliance by Geographic Location
Large organizations often operate in multiple cities or countries. Because regulatory requirements vary by location, companies must track compliance performance at the regional level.
The Location Analysis Page allows organizations to analyze compliance metrics across different locations.
Example Locations in the Dashboard
- Berlin
- London
- Mumbai
- New York
- Singapore
Key Metrics Displayed
The location analysis includes charts such as:
- Total Compliance by Location
- Total Checks by Location
- Passed Checks by Location
- Risk Rating by Location
These insights help organizations identify regions that require compliance improvements.
Click to Buy Compliance Dashboard in Google Sheets
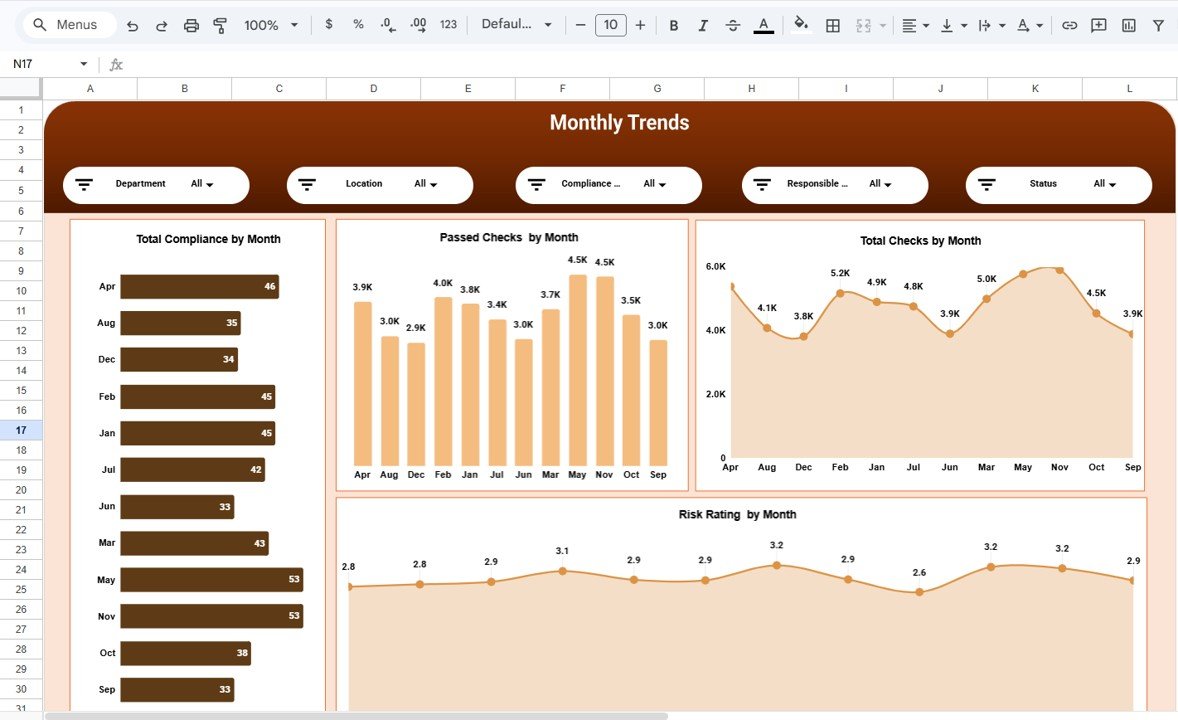
5. Monthly Trends – Track Compliance Performance Over Time
Compliance performance changes over time due to audits, regulatory updates, and operational improvements.
The Monthly Trends Page helps organizations analyze compliance activity across different months.
Charts Included on This Page
The page includes several trend charts:
- Total Compliance by Month
- Passed Checks by Month
- Total Checks by Month
- Risk Rating by Month
By analyzing monthly trends, organizations can track improvements and detect compliance issues early.
Click to Buy Compliance Dashboard in Google Sheets
Advantages of Compliance Dashboard in Google Sheets
Organizations gain several benefits by using a compliance dashboard.
Centralized Compliance Monitoring
The dashboard consolidates compliance data into one platform. As a result, managers can review compliance status quickly.
Improved Risk Visibility
Risk ratings and performance charts highlight potential compliance risks.
Faster Decision Making
Managers can identify problem areas and take corrective action faster.
Better Regulatory Reporting
The dashboard simplifies compliance reporting for audits and regulatory reviews.
Easy Collaboration
Since Google Sheets is cloud-based, multiple team members can update and review compliance data simultaneously.
Best Practices for the Compliance Dashboard in Google Sheets
Click to Buy Compliance Dashboard in Google Sheets
To maximize the effectiveness of the compliance dashboard, organizations should follow several best practices.
Maintain Accurate Data
Always ensure compliance data remains accurate and updated regularly.
Define Clear Compliance Metrics
Use well-defined KPIs that align with regulatory requirements.
Review Compliance Reports Frequently
Regular reviews help organizations detect compliance issues early.
Assign Compliance Responsibilities
Clearly define who is responsible for each compliance area.
Monitor High-Risk Areas
Focus on compliance areas that carry the highest regulatory risks.
How Can Organizations Use This Dashboard Effectively?
Click to Buy Compliance Dashboard in Google Sheets
Companies can use the Compliance Dashboard in several ways.
For example:
- Monitor compliance performance across departments
- Identify regulatory risk areas
- Track compliance activities across locations
- Improve audit readiness
- Support regulatory reporting
Because of these insights, organizations can maintain stronger compliance controls.
Conclusion
Regulatory compliance remains a critical responsibility for modern organizations. Companies must monitor compliance activities continuously to avoid risks, penalties, and operational disruptions.
The Compliance Dashboard in Google Sheets provides a powerful solution for tracking compliance performance. With interactive charts, KPI cards, and structured analysis pages, the dashboard helps organizations monitor compliance activities efficiently.
Furthermore, features such as department analysis, compliance area analysis, location analysis, and monthly trends provide deep insights into compliance performance.
Organizations that adopt data-driven compliance monitoring can improve regulatory compliance, reduce risks, and strengthen operational governance.
Frequently Asked Questions (FAQs)
Click to Buy Compliance Dashboard in Google Sheets
What is a Compliance Dashboard?
A Compliance Dashboard is a reporting tool that helps organizations monitor regulatory compliance activities, track risk levels, and analyze compliance performance.
Why is compliance monitoring important?
Compliance monitoring helps organizations ensure that their operations follow legal regulations and industry standards.
What are the main KPIs in a compliance dashboard?
Common compliance KPIs include total compliance checks, passed checks, failed checks, compliance risk ratings, and compliance completion rates.
Visit our YouTube channel to learn step-by-step video tutorials
Youtube.com/@NeotechNavigators
Watch the step-by-step video tutorial: