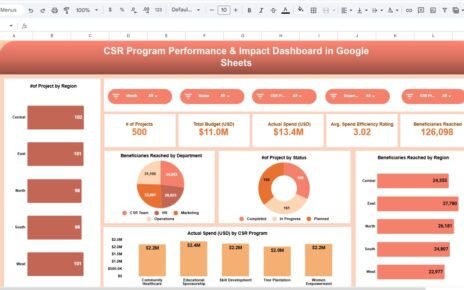
Customer satisfaction lies at the heart of every successful business. Measuring how customers feel about your products, services, and communication helps improve loyalty, retention, and overall brand reputation. The Customer Experience & Satisfaction Dashboard in Google Sheets is a ready-to-use solution designed to capture, visualize, and analyze customer feedback — all in one interactive and easy-to-use platform.Customer Experience & Satisfaction Dashboard in Google Sheets
This article explains the structure, key features, KPIs, benefits, and best practices for using this dashboard effectively.Customer Experience & Satisfaction Dashboard in Google Sheets
What Is a Customer Experience & Satisfaction Dashboard in Google Sheets?
Click to Buy Customer Experience & Satisfaction Dashboard in Google Sheets
A Customer Experience & Satisfaction Dashboard is a data visualization tool that consolidates feedback data and provides insights into how customers perceive your services.Customer Experience & Satisfaction Dashboard in Google Sheets
Built entirely in Google Sheets, this dashboard enables you to:Customer Experience & Satisfaction Dashboard in Google Sheets
-
Track overall satisfaction, service quality, and communication performance.
-
Measure Net Promoter Score (NPS) trends across regions and service types.
-
Identify problem areas through real-time charts.
-
Gain department-level and regional insights.
Whether you manage a service team, run a support center, or handle B2B clients, this dashboard helps you understand how your organization is performing in the eyes of customers.Customer Experience & Satisfaction Dashboard in Google Sheets
Structure of the Dashboard
The Customer Experience & Satisfaction Dashboard is divided into multiple structured tabs to streamline data management and reporting:
Overview Sheet Tab
Region Analysis Tab
Service Type Analysis Tab
Channel Analysis Tab
Monthly Trends Tab
Data Sheet Tab
Overview Sheet Tab
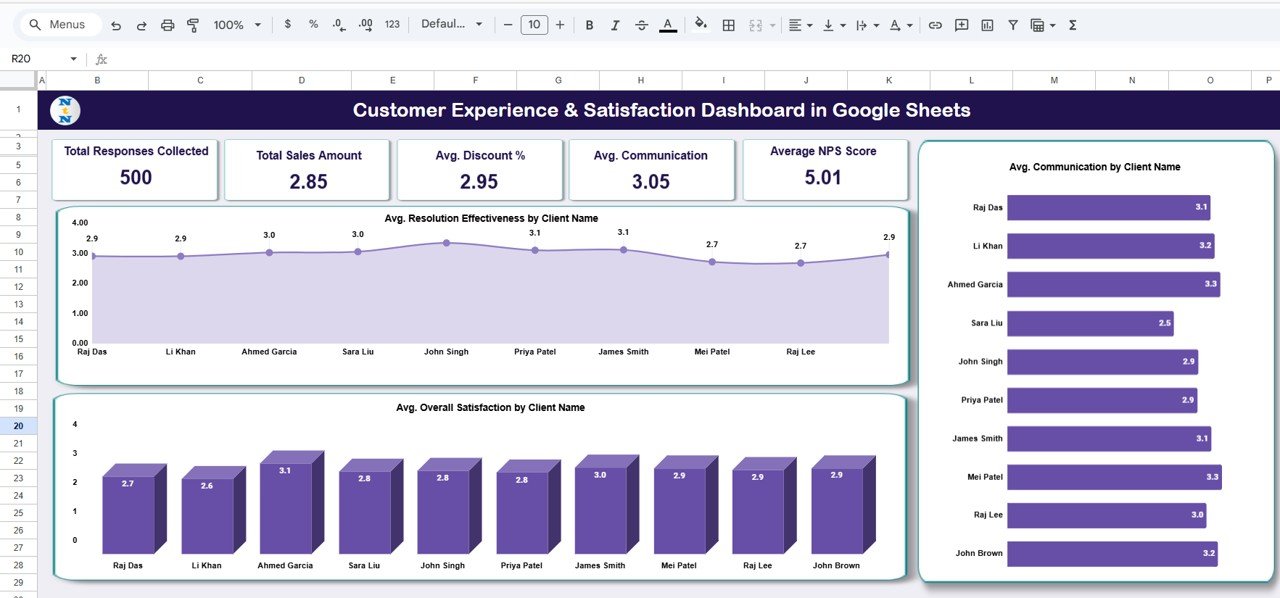
The Overview Tab provides a snapshot of all major performance indicators (KPIs) that reflect customer satisfaction levels.
Cards Displayed:
Click to Buy Customer Experience & Satisfaction Dashboard in Google Sheets
-
Total Responses Collected: Total number of feedback responses submitted.
-
Avg. Overall Satisfaction: Average customer satisfaction score.
-
Avg. Service Quality: Average rating for service delivery quality.
-
Avg. Communication: Measures how well staff or agents communicated.
-
Average NPS Score: Calculates customer loyalty and advocacy score.
Charts Included:
-
Avg. Resolution Effectiveness by Client Name: Identifies which clients are satisfied with issue resolutions.
-
Avg. Overall Satisfaction by Client Name: Shows satisfaction levels per client or project.
-
Avg. Communication by Client Name: Evaluates how communication affects client satisfaction.
These visualizations help quickly identify which clients or projects are performing well and which require improvement.
Click to Buy Customer Experience & Satisfaction Dashboard in Google Sheets
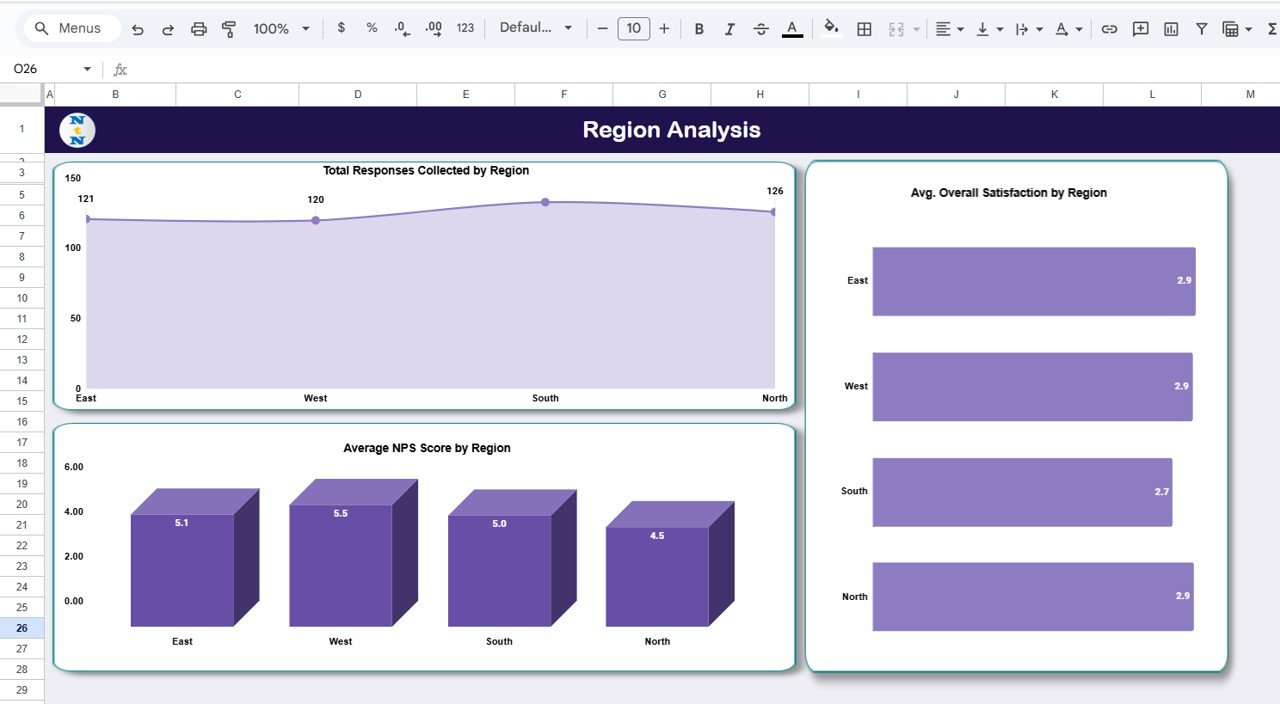
Region Analysis Tab
The Region Analysis Tab helps understand how customer experience varies across geographical regions.
Charts Included:
-
Total Responses Collected by Region
-
Avg. Overall Satisfaction by Region
-
Average NPS Score by Region
This enables managers to identify which regions have the highest engagement and satisfaction, allowing for targeted improvements.
Click to Buy Customer Experience & Satisfaction Dashboard in Google Sheets
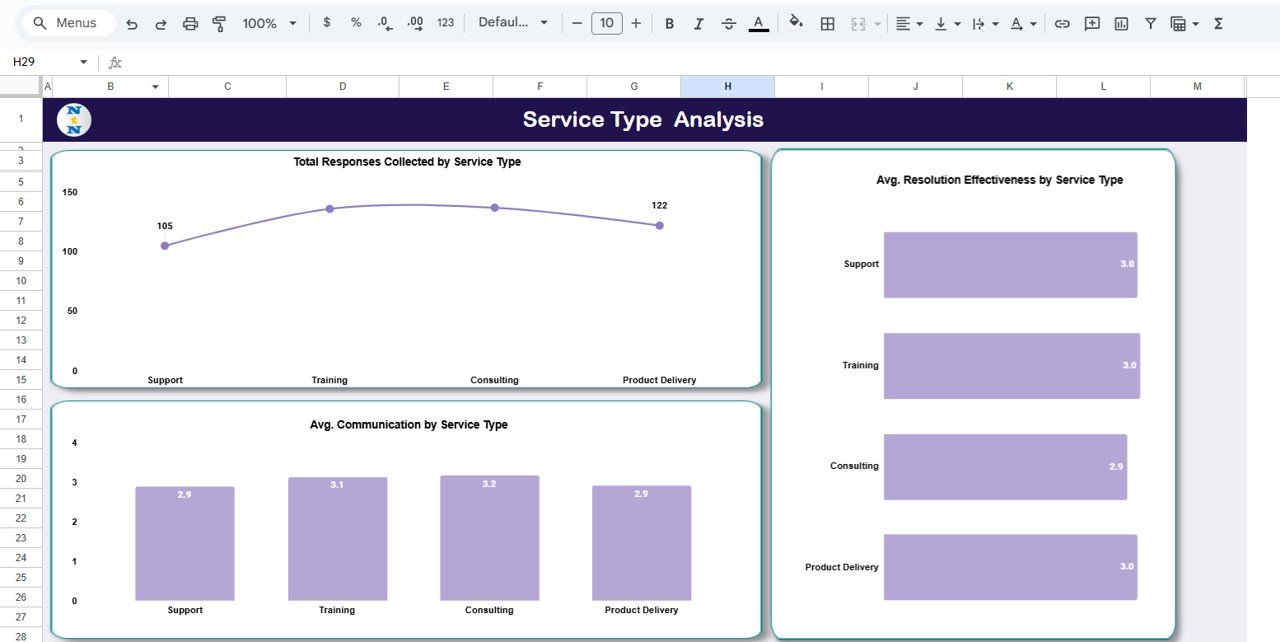
Service Type Analysis Tab
This tab focuses on customer feedback segmented by service categories.
Charts Included:
-
Total Responses Collected by Service Type
-
Avg. Resolution Effectiveness by Service Type
-
Avg. Communication by Service Type
For example, you can compare satisfaction between Technical Support, Implementation Services, and Training Programs.
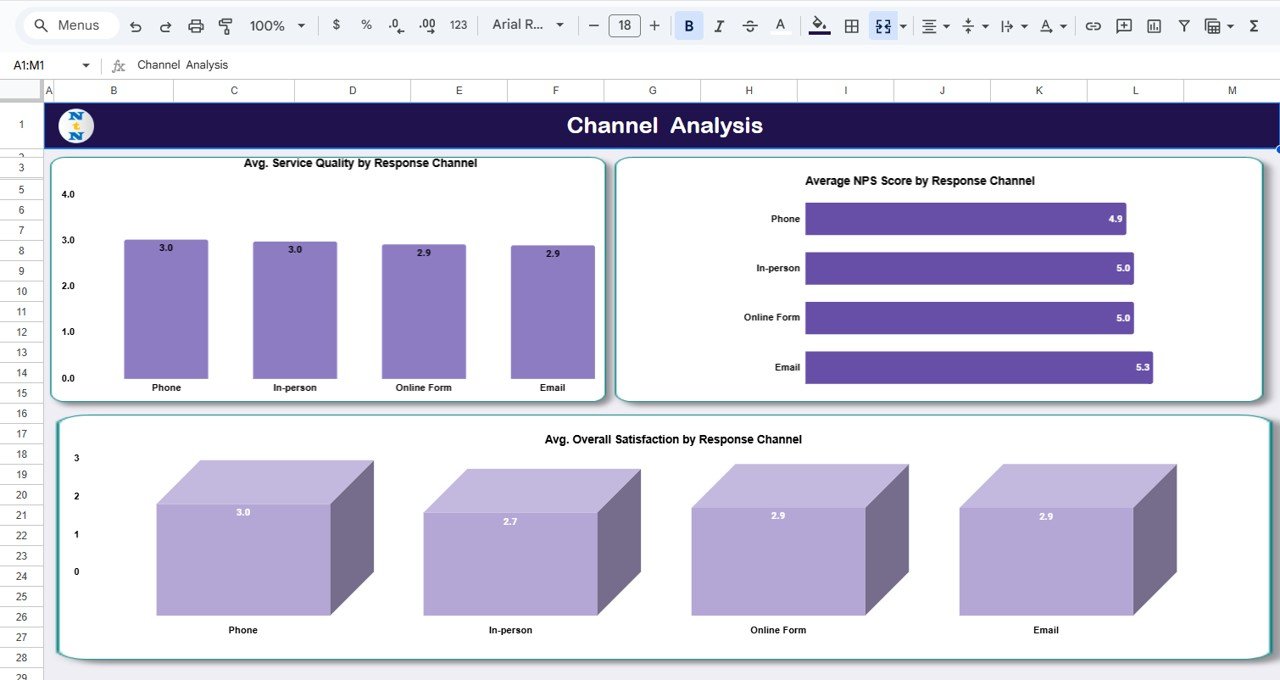
Channel Analysis Tab
This tab measures how feedback differs based on communication or service delivery channels.
Charts Included:
-
Avg. Service Quality by Response Channel
-
Average NPS Score by Response Channel
-
Avg. Overall Satisfaction by Response Channel
This analysis helps understand which channels (e.g., Email, Phone, Chat, or In-Person) provide the best customer experiences.
Click to Buy Customer Experience & Satisfaction Dashboard in Google Sheets
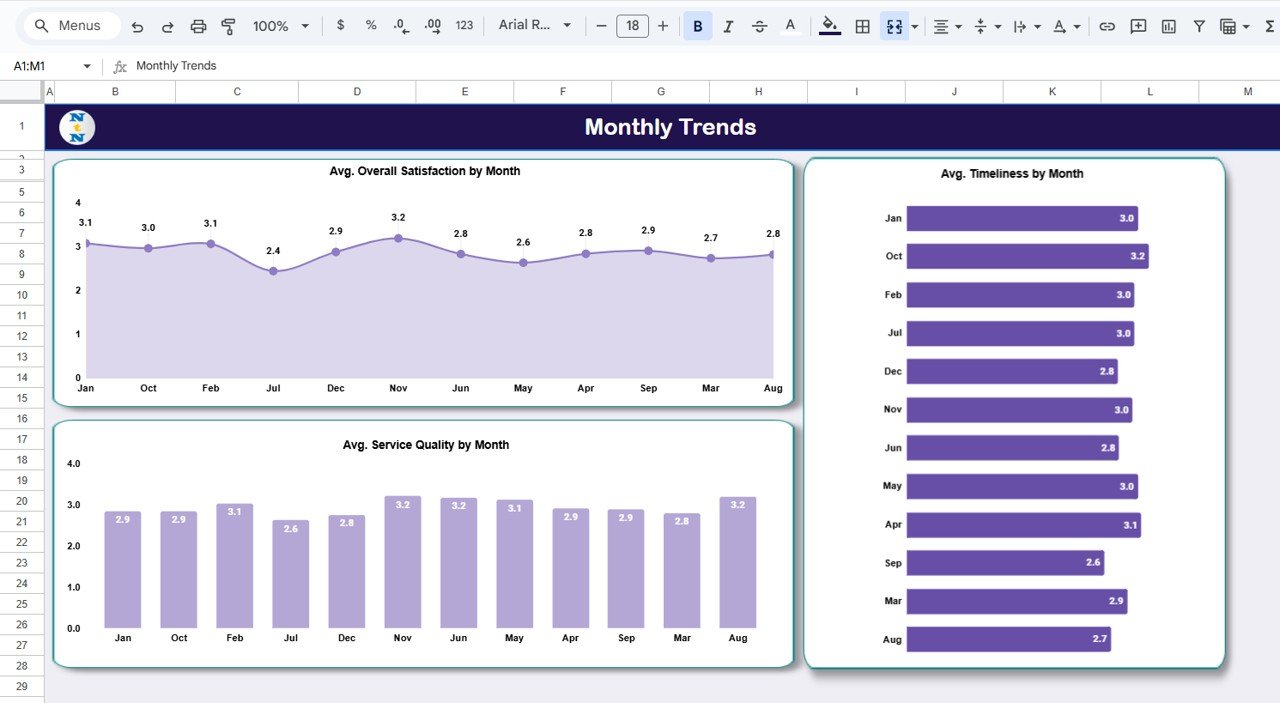
Monthly Trends Tab
The Monthly Trends Tab provides a time-based view of customer feedback to analyze performance over months.
Charts Included:
-
Avg. Overall Satisfaction by Month
-
Avg. Timeliness by Month
-
Avg. Service Quality by Month
This helps organizations monitor performance improvements and seasonal variations.
Click to Buy Customer Experience & Satisfaction Dashboard in Google Sheets
Data Sheet Tab
This is the data input sheet, where all raw feedback information is stored.

Advantages of the Dashboard
-
Centralized Feedback Tracking: Collect and analyze all responses in one place.
-
Visual Insights: Identify strengths and weaknesses through intuitive charts.
-
Customizable Design: Easily modify or add KPIs based on your organization’s needs.
-
Collaborative Platform: Enable real-time access and updates with your team.
-
Data-Driven Decisions: Use facts, not assumptions, to improve customer experience.
-
Automated Analysis: Reduce manual work — charts and averages update automatically.
Opportunities for Improvement
Click to Buy Customer Experience & Satisfaction Dashboard in Google Sheets
To further enhance this dashboard:
-
Automate data collection using Google Forms.
-
Add sentiment analysis for open-ended responses.
-
Use dynamic filters to drill down by month, department, or account manager.
-
Create benchmarking by comparing NPS or satisfaction against industry averages.
-
Add performance alerts for below-target KPIs via Google Apps Script.
Best Practices
Click to Buy Customer Experience & Satisfaction Dashboard in Google Sheets
-
Keep feedback questions consistent across departments.
-
Update data regularly to maintain real-time accuracy.
-
Review monthly trends to identify consistent issues.
-
Protect sheets containing formulas and formatting.
-
Share dashboard insights during customer review meetings.
Conclusion
The Customer Experience & Satisfaction Dashboard in Google Sheets is a comprehensive tool that turns feedback into actionable insights.
By visualizing satisfaction scores, communication ratings, and NPS data across clients, regions, and service types, this dashboard helps organizations continuously improve customer interactions and service quality.
Visit our YouTube channel to learn step-by-step video tutorials
Youtube.com/@NeotechNavigators
Watch the step-by-step video Demo:
Click to Buy Customer Experience & Satisfaction Dashboard in Google Sheets