Delivering exceptional customer experience is the foundation of every successful business. But measuring and analyzing that experience across regions, channels, and services can be challenging. That’s where the Customer Experience & Service Quality Dashboard in Google Sheets comes in.
This ready-to-use dashboard helps organizations collect, monitor, and visualize key metrics like customer satisfaction, communication quality, resolution effectiveness, and Net Promoter Score (NPS). All this is done directly in Google Sheets—no advanced software required.
What Is a Customer Experience & Service Quality Dashboard?
A Customer Experience & Service Quality Dashboard is a data visualization tool that consolidates feedback data into meaningful insights.
It allows customer service managers and business leaders to:
-
Track customer satisfaction trends
-
Identify service areas needing improvement
-
Evaluate communication and responsiveness
-
Measure performance across regions and service types
By turning raw feedback data into interactive charts and performance indicators, the dashboard enables data-driven decisions that enhance customer relationships and service delivery.
Dashboard Structure
Click to Buy Customer Experience & Service Quality Dashboard in Google Sheets
This Google Sheets dashboard includes multiple sheet tabs that simplify analysis and provide a holistic view of customer service performance.
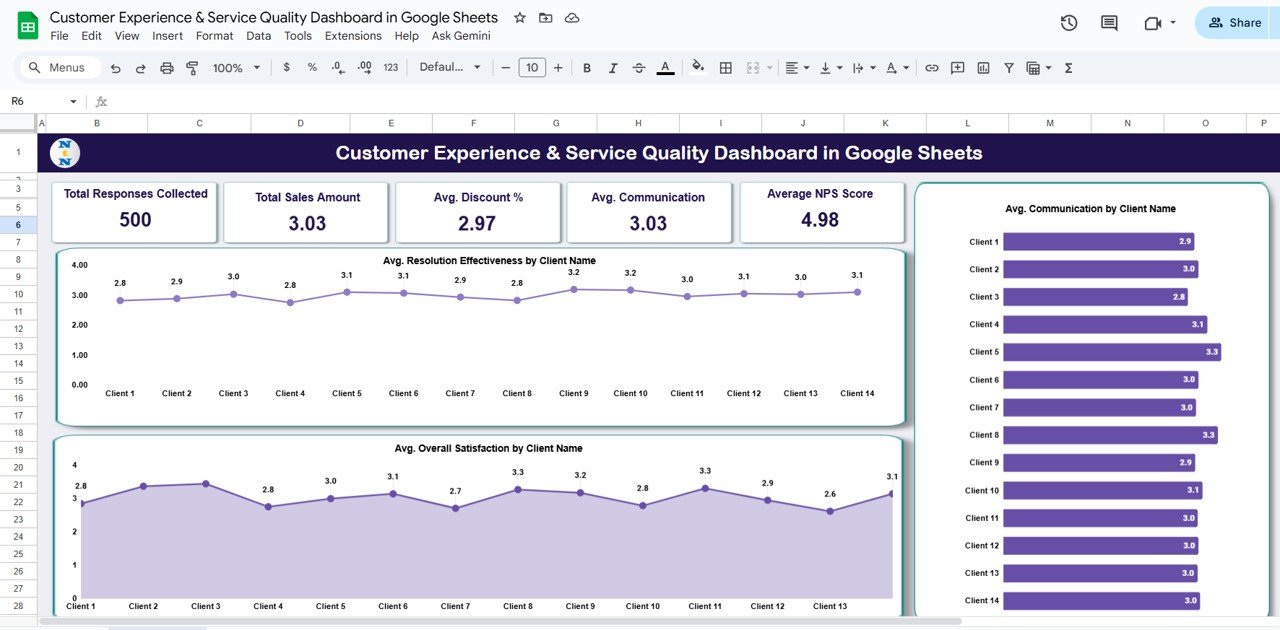
1️⃣ Overview Sheet Tab
The Overview Sheet acts as the control center of the dashboard. It features KPI summary cards and performance charts for quick decision-making.
📇 KPI Cards:
-
Total Responses Collected – Total number of customer feedback entries.
-
Avg. Overall Satisfaction – Average satisfaction rating from all customers.
-
Avg. Service Quality – Overall perceived quality of service delivery.
-
Avg. Communication – Average customer feedback on clarity and professionalism of communication.
-
Average NPS Score – Measures customer loyalty and likelihood to recommend your brand.
📊 Charts:
-
Avg. Resolution Effectiveness by Client Name
-
Avg. Overall Satisfaction by Client Name
-
Avg. Communication by Client Name
Click to Buy Customer Experience & Service Quality Dashboard in Google Sheets
These visuals help track client-level satisfaction patterns and spot service inconsistencies.
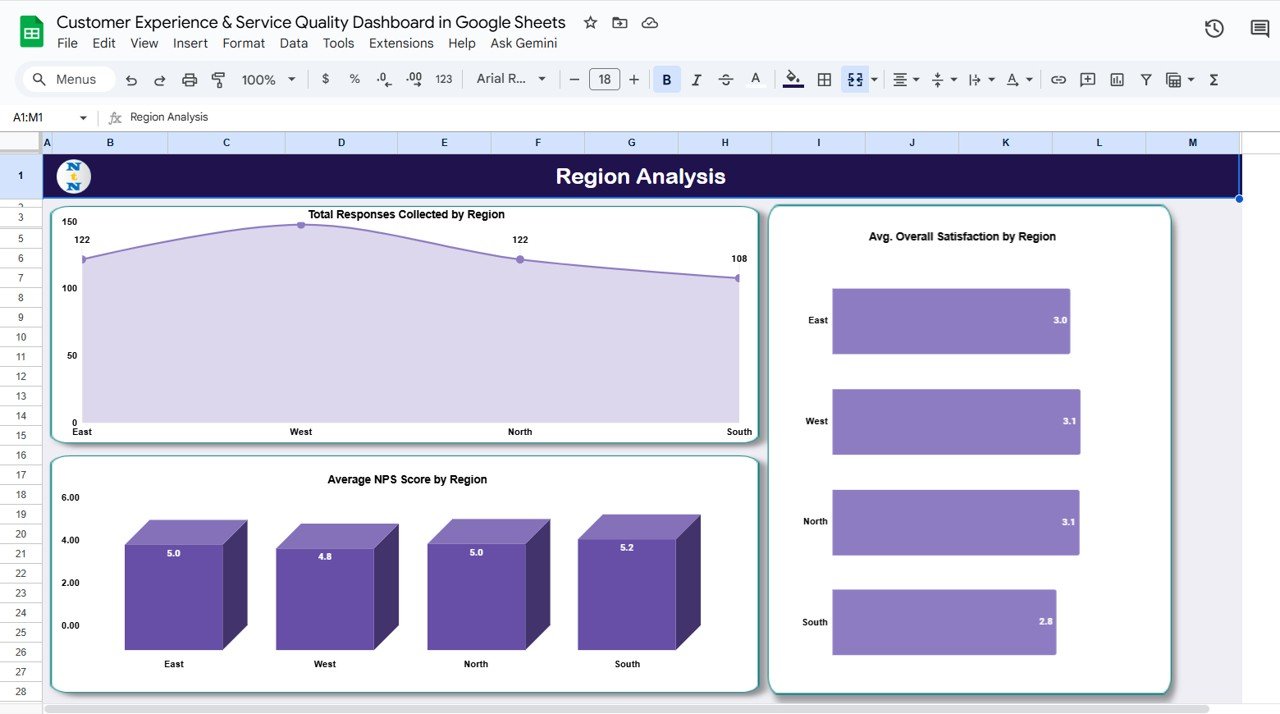
2️⃣ Region Analysis
This section helps compare customer satisfaction across geographical regions.
📈 Charts:
-
Total Responses Collected by Region
-
Avg. Overall Satisfaction by Region
-
Average NPS Score by Region
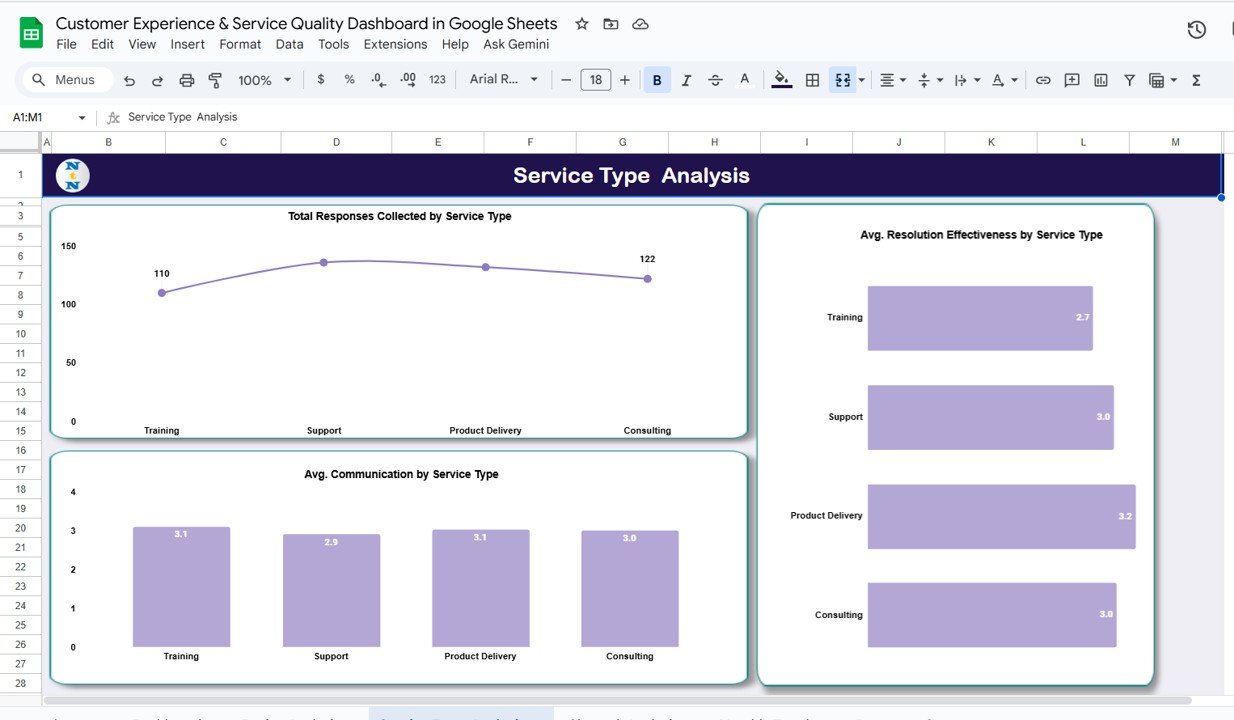
3️⃣ Service Type Analysis
This tab breaks down performance by different service categories — such as technical support, consultation, installation, or customer onboarding.
📊 Charts:
-
Total Responses Collected by Service Type
-
Avg. Resolution Effectiveness by Service Type
-
Avg. Communication by Service Type
These metrics are crucial for service delivery teams to assess performance consistency across offerings.
Click to Buy Customer Experience & Service Quality Dashboard in Google Sheets
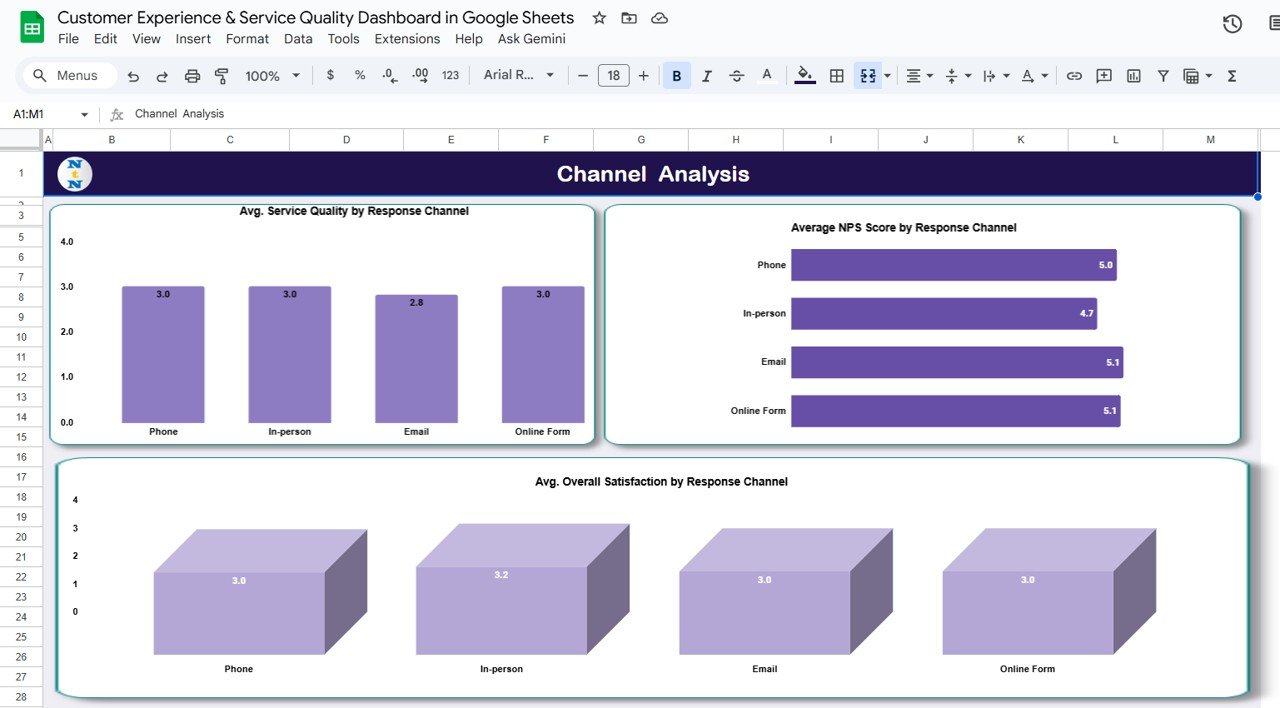
4️⃣ Channel Analysis
Different communication channels often produce different customer experiences. This analysis helps evaluate which channel — email, phone, chat, or social media — provides the best results.
Charts:
-
Avg. Service Quality by Response Channel
-
Average NPS Score by Response Channel
-
Avg. Overall Satisfaction by Response Channel
These charts help in optimizing the best-performing channels and improving weaker ones.
Click to Buy Customer Experience & Service Quality Dashboard in Google Sheets
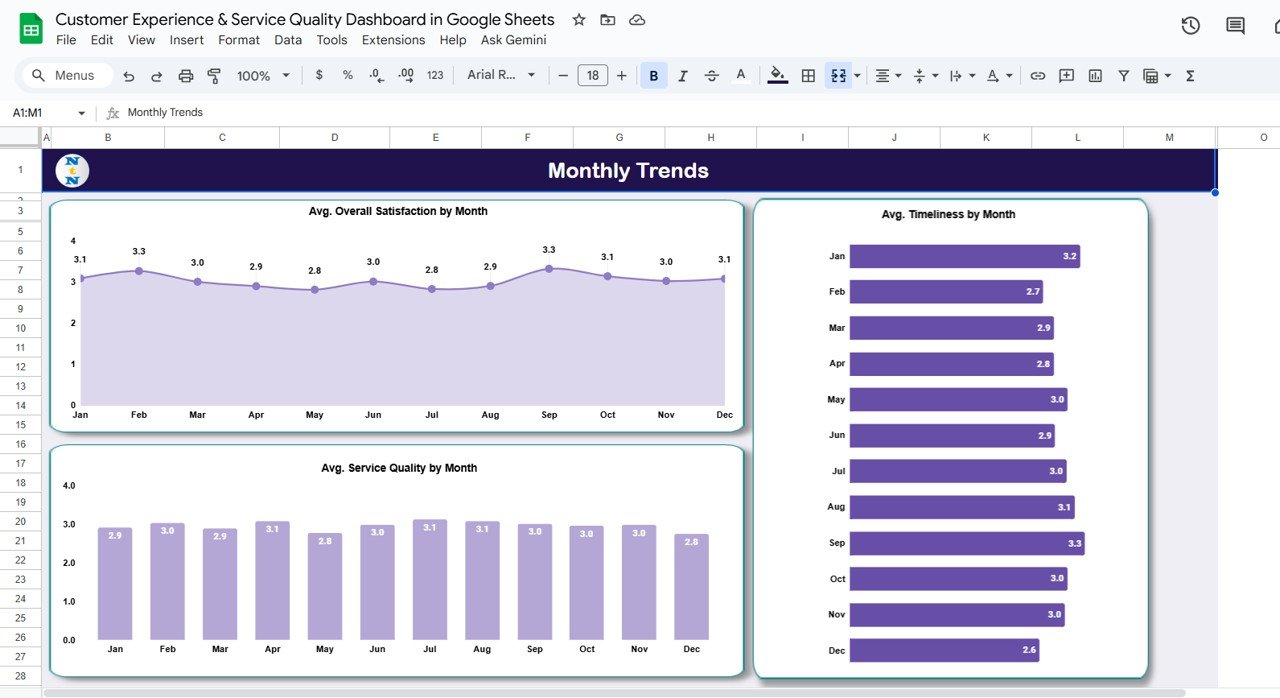
5️⃣ Monthly Trends
This sheet shows how customer sentiment and service performance evolve over time.
📊 Charts:
-
Avg. Overall Satisfaction by Month
-
Avg. Timeliness by Month
-
Avg. Service Quality by Month
6️⃣ Data Sheet Tab
This is where all customer feedback and related data are stored. Each row corresponds to a unique customer feedback entry, including fields like:
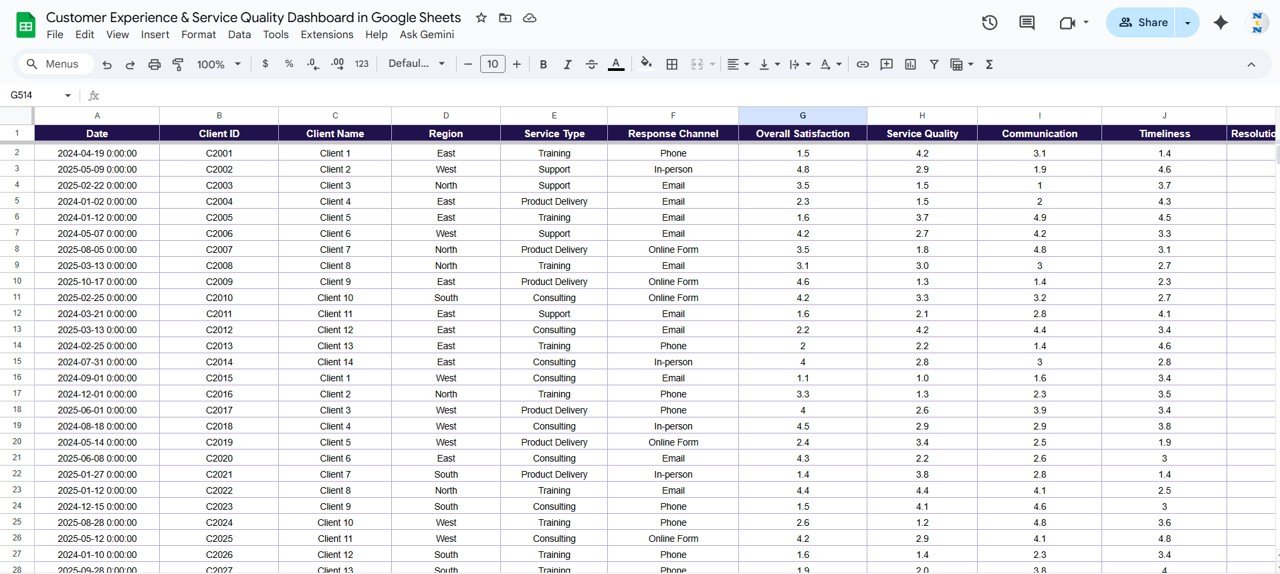
Data Sheet Tab
Click to Buy Customer Experience & Service Quality Dashboard in Google Sheets
Advantages
-
🎯 Comprehensive Feedback Analysis: Capture customer satisfaction and service performance across multiple dimensions.
-
💬 Multi-Channel Evaluation: Understand which platforms deliver the best experiences.
-
📊 Instant Insights: Auto-generated visuals make reporting fast and easy.
-
🧠 Data-Driven Improvements: Track recurring service quality issues with evidence-based insights.
-
🌐 Collaboration Ready: Works in Google Sheets for real-time team collaboration.
Opportunities for Improvement
-
Add sentiment analysis using Google Apps Script to analyze text-based feedback.
-
Integrate with Google Forms for automatic feedback collection.
-
Include a Customer Segmentation Filter (e.g., new vs. existing clients).
-
Create an Alert System for low NPS or satisfaction scores.
-
Add trend prediction charts using linear regression.
Best Practices
Click to Buy Customer Experience & Service Quality Dashboard in Google Sheets
-
Gather customer feedback regularly after each service interaction.
-
Define clear scoring criteria for satisfaction and service quality.
-
Compare performance monthly to detect trends early.
-
Keep region and channel data consistent using dropdown menus.
-
Review and update KPI thresholds annually for better accuracy.
Conclusion
The Customer Experience & Service Quality Dashboard in Google Sheets is an essential tool for organizations looking to elevate customer satisfaction, optimize service performance, and make data-driven improvements.
Visit our YouTube channel to learn step-by-step video tutorials
Youtube.com/@NeotechNavigators
Click to Buy Customer Experience & Service Quality Dashboard in Google Sheets