Cybersecurity has become one of the most critical priorities for modern organizations. As businesses increasingly rely on digital systems, cloud infrastructure, and connected devices, the risk of cyber threats continues to grow rapidly. Cyberattacks such as ransomware, phishing, data breaches, and malware infections can disrupt operations, damage reputation, and cause major financial losses.Cybersecurity Incident KPI Dashboard in Google Sheets
Therefore, organizations must continuously monitor cybersecurity incidents and response performance. However, many security teams still rely on manual reports, scattered spreadsheets, and delayed analysis. As a result, decision-makers often struggle to track security incidents, analyze trends, and measure the effectiveness of cybersecurity controls.Cybersecurity Incident KPI Dashboard in Google Sheets
To solve this challenge, organizations use data-driven monitoring tools. One powerful solution is the Cybersecurity Incident KPI Dashboard in Google Sheets.Cybersecurity Incident KPI Dashboard in Google Sheets
The Cybersecurity Incident KPI Dashboard in Google Sheets is a ready-to-use performance monitoring template designed to track cybersecurity incidents and security operations metrics. This dashboard allows security teams to measure key performance indicators (KPIs), analyze incident trends, and evaluate security performance in real time.
Because Google Sheets supports cloud collaboration, automation, and real-time updates, organizations can easily track cybersecurity performance across departments.
In this article, you will learn everything about the Cybersecurity Incident KPI Dashboard in Google Sheets, including what it is, why organizations need it, its key features, advantages, best practices, and frequently asked questions.
What is a Cybersecurity Incident KPI Dashboard in Google Sheets?
Click to Buy Cybersecurity Incident KPI Dashboard in Google Sheets
A Cybersecurity Incident KPI Dashboard in Google Sheets is a performance monitoring tool used to track security incidents and cybersecurity operations metrics using structured dashboards and analytical reports.
This dashboard helps organizations monitor important cybersecurity KPIs such as:
- Number of cybersecurity incidents
- Incident response time
- Threat detection time
- Security incident resolution rate
- Phishing attack success rate
- System vulnerability count
- Security patch compliance
Instead of manually analyzing security data, organizations can use this dashboard to track cybersecurity performance in an organized and visual format.
Moreover, the dashboard compares Actual performance, Target values, and Previous year data, allowing security teams to measure improvements and identify risks quickly.
Because the template runs on Google Sheets, teams can access and update data from anywhere.
Why Do Organizations Need a Cybersecurity KPI Dashboard?
Cybersecurity operations involve many complex processes such as threat detection, incident response, vulnerability management, and system monitoring.
Without proper monitoring tools, security teams may struggle to measure performance effectively.
A Cybersecurity Incident KPI Dashboard helps organizations solve these challenges.
1. Improves Cybersecurity Monitoring
Security teams can monitor incident trends and threat levels in real time.
2. Supports Faster Incident Response
By analyzing response metrics, organizations can improve incident handling processes.
3. Enhances Security Performance Tracking
Managers can track security KPIs and measure team performance easily.
4. Helps Identify Security Risks
Trend analysis helps identify recurring threats and vulnerabilities.
5. Strengthens Compliance and Reporting
Organizations can generate security performance reports for management and regulatory requirements.
Key Features of the Cybersecurity Incident KPI Dashboard in Google Sheets
Click to Buy Cybersecurity Incident KPI Dashboard in Google Sheets
The Cybersecurity Incident KPI Dashboard in Google Sheets includes multiple worksheets designed to capture, analyze, and visualize cybersecurity performance data.
This dashboard contains six worksheets, each serving a specific function.
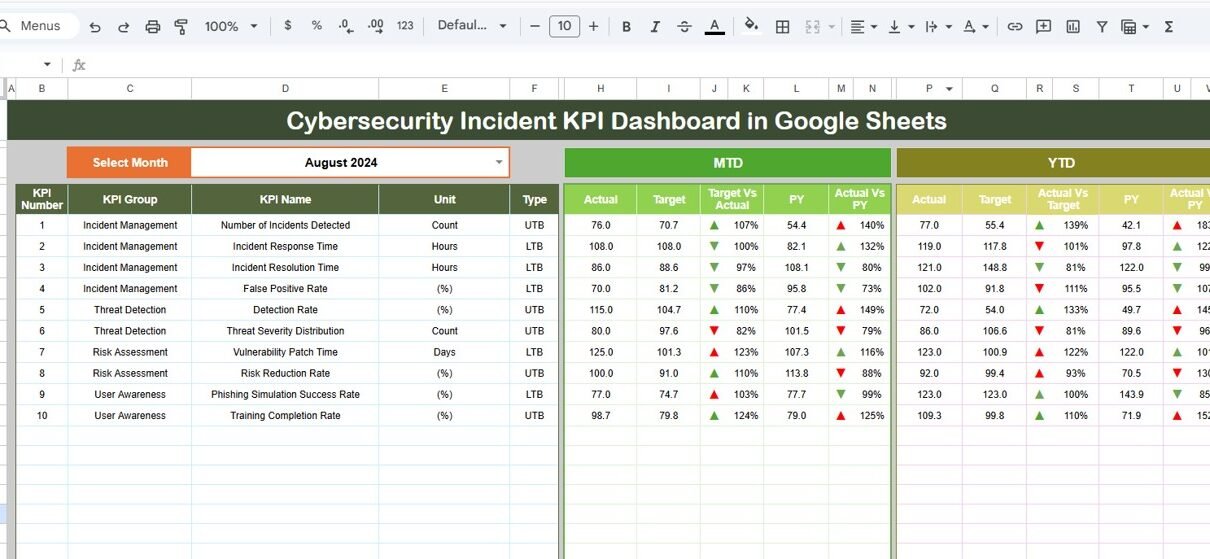
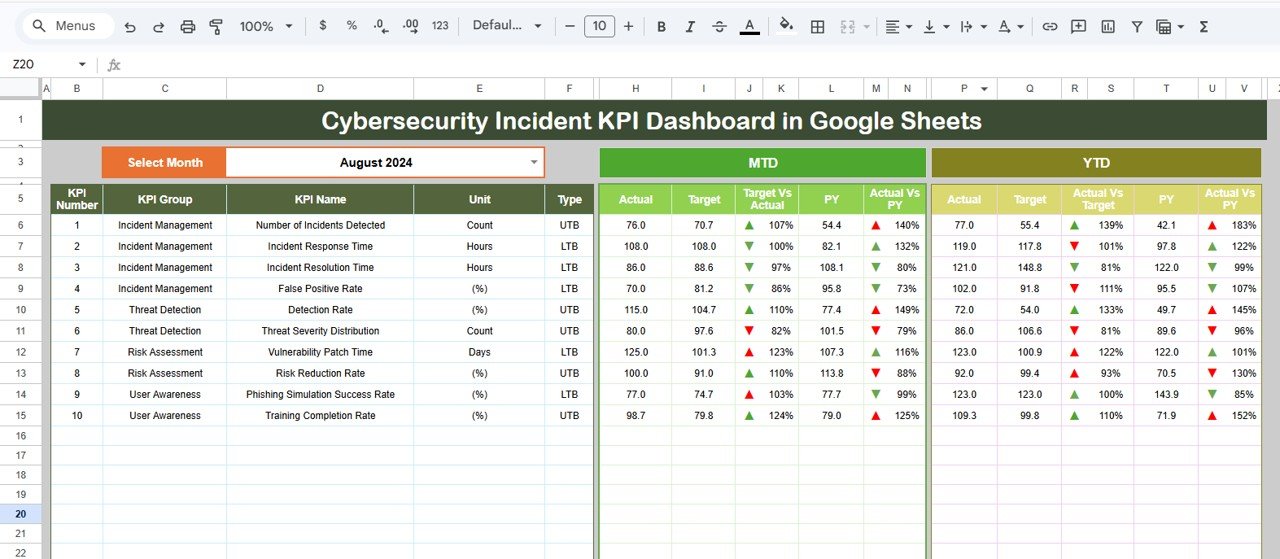
1. Dashboard Sheet – Cybersecurity Performance Overview
The Dashboard Sheet serves as the main page of the KPI dashboard.
This sheet displays an overview of all cybersecurity KPIs.
At the top of the dashboard, users can select the month from the dropdown menu in cell D3. Once users select a month, the entire dashboard updates automatically.
Therefore, security teams can quickly analyze monthly performance.
MTD (Month-To-Date) Metrics
The dashboard displays the following metrics for the selected month:
- MTD Actual values
- MTD Target values
- Previous Year MTD values
- Target vs Actual comparison
- Previous Year vs Actual comparison
YTD (Year-To-Date) Metrics
The dashboard also provides yearly performance indicators.
These include:
-
YTD Actual values
-
YTD Target values
-
Previous Year YTD values
-
Target vs Actual comparison
-
Previous Year vs Actual comparison
Visual Performance Indicators
The dashboard uses conditional formatting arrows to indicate performance trends.
-
Green upward arrow – KPI performance improving
-
Red downward arrow – KPI performance declining
These visual indicators help managers quickly identify critical cybersecurity issues.
Click to Buy Cybersecurity Incident KPI Dashboard in Google Sheets
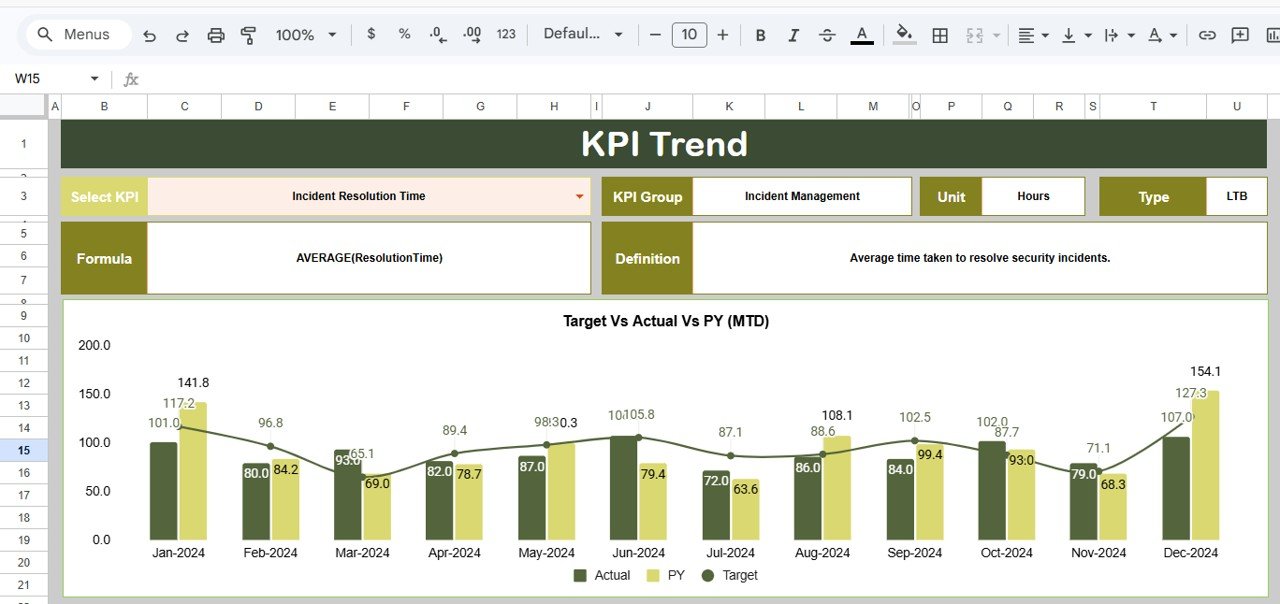
2. KPI Trend Sheet – KPI Performance Analysis
The KPI Trend Sheet allows users to analyze the performance trend of individual KPIs.
Users can select a KPI name from the dropdown menu in cell C3.
Once selected, the sheet displays detailed KPI information.
This includes:
-
KPI Group
-
KPI Unit
-
KPI Type (Lower the Better or Upper the Better)
-
KPI Formula
-
KPI Definition
Additionally, the sheet displays trend charts for the selected KPI, helping security teams monitor changes over time.
Click to Buy Cybersecurity Incident KPI Dashboard in Google Sheets
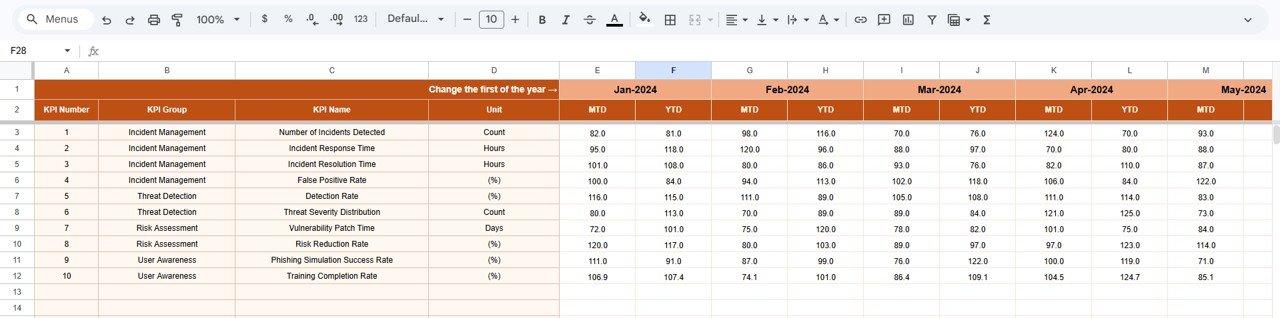
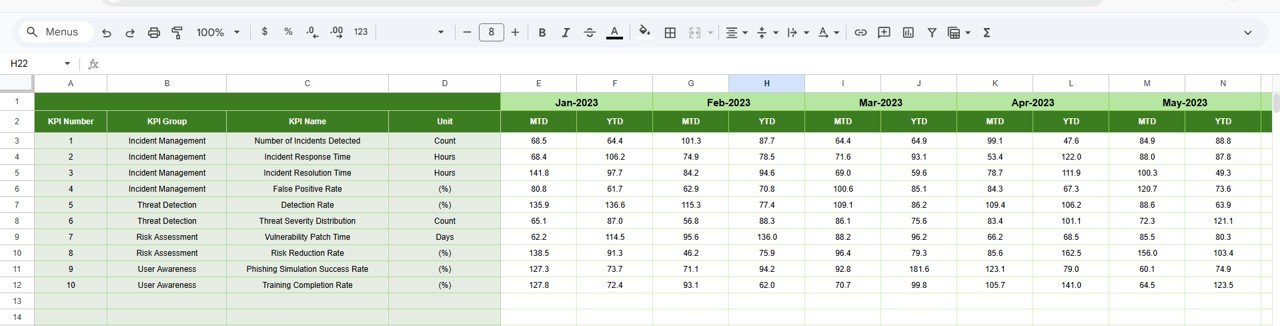
3. Actual Numbers Sheet – Current Year Data Entry
The Actual Numbers Sheet is used to enter current performance values.
Users must enter:
-
MTD actual values
-
YTD actual values
Users can select the starting month in cell E1.
Once the data is entered, the dashboard automatically updates performance calculations.
Therefore, this sheet acts as the primary data entry area.
Click to Buy Cybersecurity Incident KPI Dashboard in Google Sheets
4. Target Sheet – KPI Target Values
The Target Sheet stores the target values for each cybersecurity KPI.
Users must enter target numbers for:
-
MTD Targets
-
YTD Targets
The dashboard compares these targets with actual performance.
This comparison helps determine whether cybersecurity operations meet performance expectations.
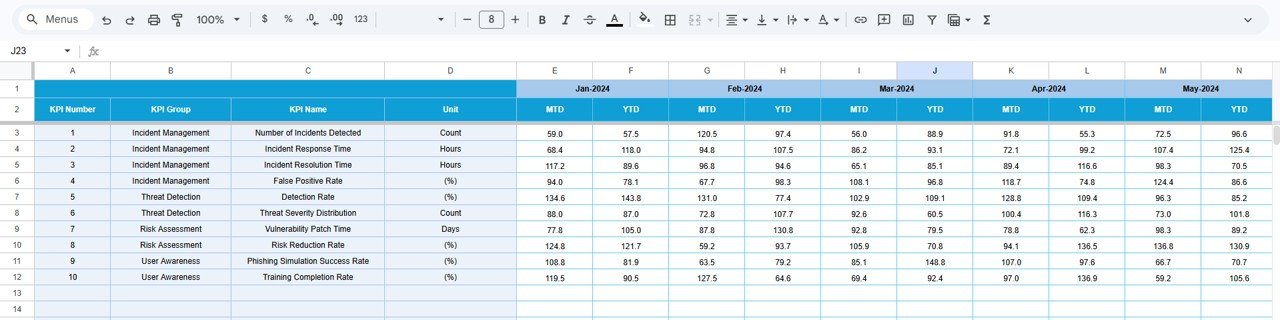
5. Previous Year Numbers Sheet – Historical Data
The Previous Year Numbers Sheet stores performance data from the previous year.
Users must enter the same KPI values used for the current year.
This data helps organizations compare:
-
Current security performance vs previous year performance
-
Long-term improvement trends
-
Effectiveness of cybersecurity strategies
Click to Buy Cybersecurity Incident KPI Dashboard in Google Sheets
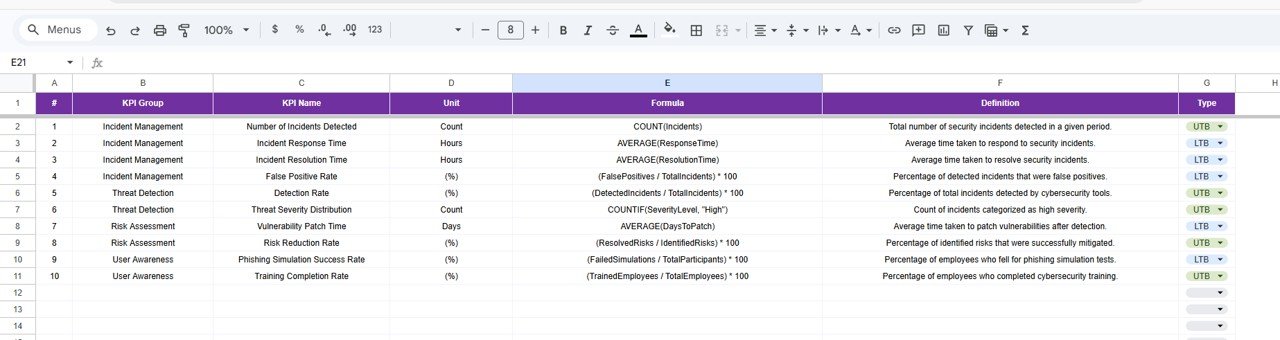
6. KPI Definition Sheet – KPI Documentation
The KPI Definition Sheet works as a reference library for all cybersecurity KPIs.
Users must enter the following information:
- KPI Name
- KPI Group
- KPI Unit
- KPI Formula
- KPI Definition
This sheet ensures all KPIs are clearly defined.
As a result, security teams can understand how each KPI is calculated and what it measures.
Click to Buy Cybersecurity Incident KPI Dashboard in Google Sheets
Advantages of Cybersecurity Incident KPI Dashboard in Google Sheets
Organizations gain several benefits when they use this dashboard.
1. Easy to Use
Google Sheets provides a simple interface that most professionals already know.
2. Real-Time Collaboration
Multiple security team members can update the dashboard simultaneously.
3. Cloud Accessibility
Teams can access the dashboard from anywhere with internet access.
4. Improves Cybersecurity Monitoring
Managers can track incidents and threats more effectively.
5. Faster Security Decision-Making
Trend analysis helps teams respond quickly to security threats.
6. Cost-Effective Solution
Google Sheets offers powerful analytics without requiring expensive security software.
Best Practices for the Cybersecurity Incident KPI Dashboard
Click to Buy Cybersecurity Incident KPI Dashboard in Google Sheets
Organizations should follow these best practices to maximize dashboard effectiveness.
1. Define Relevant Security KPIs
Select KPIs that directly measure incident detection, response, and prevention.
2. Update Security Data Regularly
Security teams should update incident data frequently.
3. Monitor Security Trends
Managers should analyze KPI trends to detect patterns and vulnerabilities.
4. Set Realistic Security Targets
Organizations should set targets based on historical security performance.
5. Train Security Teams
Security staff should understand how to interpret KPI data.
Conclusion
Click to Buy Cybersecurity Incident KPI Dashboard in Google Sheets
Cybersecurity threats continue to increase across industries. Therefore, organizations must monitor cybersecurity performance continuously.
The Cybersecurity Incident KPI Dashboard in Google Sheets provides a simple yet powerful solution for tracking security incidents and performance metrics.
Because this dashboard includes interactive dashboards, KPI trend analysis, automated calculations, and cloud collaboration, it helps organizations manage cybersecurity operations more effectively.
Moreover, Google Sheets allows teams to access data in real time, enabling faster threat detection and response.
Visit our YouTube channel to learn step-by-step video tutorials
Youtube.com/@NeotechNavigators
Watch the step-by-step video tutorial:
Click to Buy Cybersecurity Incident KPI Dashboard in Google Sheets