Running an e-commerce business means managing orders, customers, deliveries, and profitability — all at once. The E-Commerce Sales Performance Dashboard in Google Sheets is a ready-to-use solution that gives you a 360° view of your online sales performance.E-Commerce Sales Performance Dashboard in Google Sheets
With automated calculations, interactive charts, and an intuitive layout, this dashboard helps you track revenue trends, monitor order fulfillment, and analyze product-level performance — all within the simplicity and flexibility of Google Sheets.E-Commerce Sales Performance Dashboard in Google Sheets
What Is an E-Commerce Sales Performance Dashboard in Google Sheets?
An E-Commerce Sales Performance Dashboard is a centralized analytics tool that consolidates key sales, customer, and operational metrics into one visual report.E-Commerce Sales Performance Dashboard in Google Sheets
It enables e-commerce managers, analysts, and business owners to:E-Commerce Sales Performance Dashboard in Google Sheets
-
Track sales by region, category, and payment method.
-
Measure profitability, order trends, and customer ratings.
-
Evaluate operational efficiency across shipping and delivery processes.
-
Identify top-performing categories and underperforming areas instantly.
This dashboard transforms raw transactional data into actionable business insights — without the need for complex BI tools or coding.
Dashboard Structure Overview
Click to Buy E-Commerce Sales Performance Dashboard in Google Sheets
The E-Commerce Sales Performance Dashboard in Google Sheets includes the following sheets:
- Dashboard Sheet Tab (Main Visual Dashboard)
Search Sheet Tab
Data Sheet Tab
Support Sheet Tab
Each sheet plays a distinct role in creating a complete analytical ecosystem for your e-commerce data.
Dashboard Sheet Tab
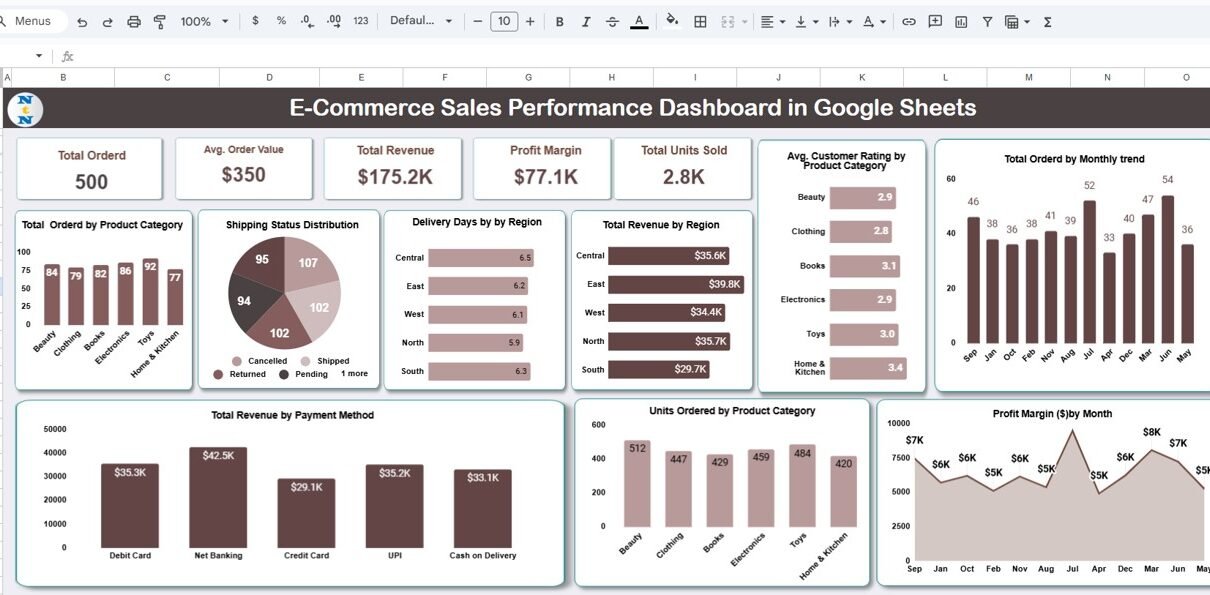
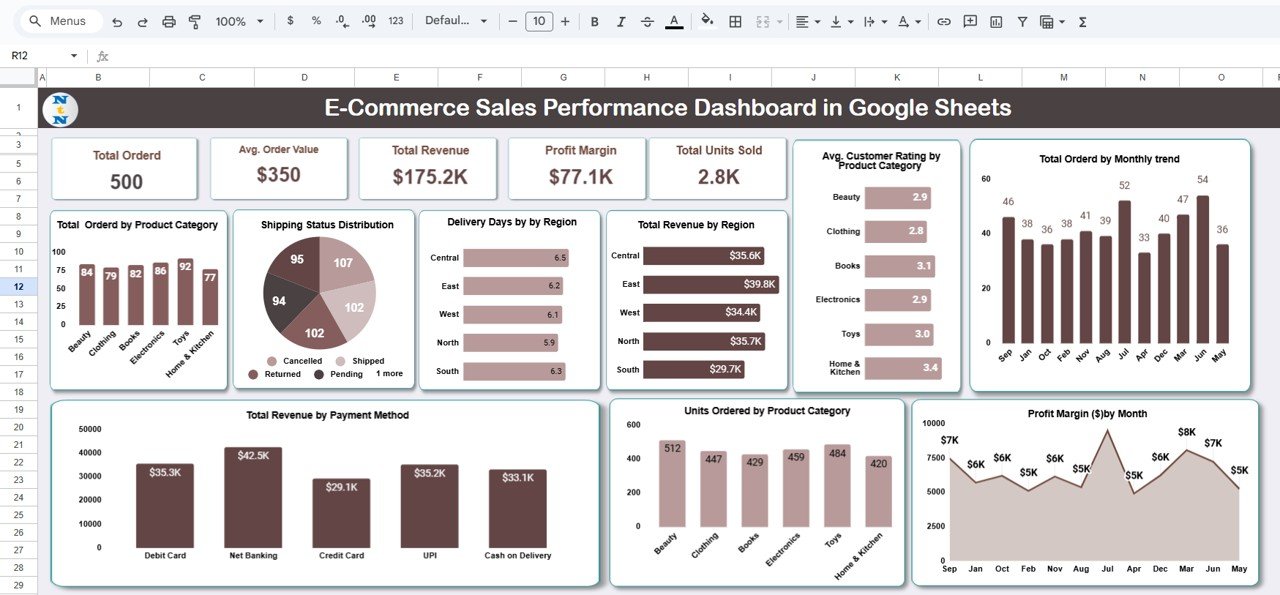
The Dashboard Sheet Tab is the main page that displays KPIs, charts, and performance trends. It’s fully automated — all visuals update dynamically as data changes in the Data Sheet Tab.
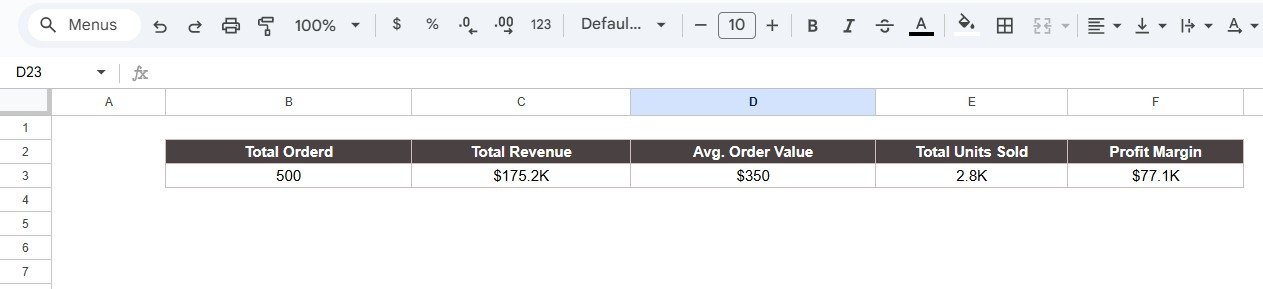
Cards (Key Metrics Displayed)
The top section of the dashboard features performance cards showing summary insights:
-
Total Orders: Total number of orders placed in the selected time period.
-
Total Revenue: Sum of all sales revenue.
-
Average Order Value (AOV): Revenue per order, calculated as Total Revenue ÷ Total Orders.
-
Total Units Sold: Number of items sold across all orders.
-
Profit Margin: Measures profitability percentage based on revenue and costs.
These KPIs give you a snapshot of your store’s performance at a glance.
Charts Included
The dashboard includes multiple pivot-based charts for deeper analysis:
Total Orders by Product Category
-
Identifies top-selling product categories.
-
Helps in inventory planning and demand forecasting.
Shipping Status Distribution
-
Visualizes order statuses such as Pending, Shipped, Delivered, and Returned.
-
Tracks fulfillment efficiency.
Delivery Days by Region
-
Displays average delivery duration per region.
-
Highlights logistics performance differences.
Total Revenue by Region
-
Shows regional contribution to total sales.
-
Helps in targeting marketing efforts geographically.
Average Customer Rating by Product Category
-
Tracks customer satisfaction levels for each category.
Total Orders by Monthly Trend
Click to Buy E-Commerce Sales Performance Dashboard in Google Sheets
-
Reveals month-over-month order growth and seasonality trends.
Profit Margin ($) by Month
-
Compares monthly profitability patterns.
Units Ordered by Product Category
-
Evaluates product demand and category performance.
Total Revenue by Payment Method
-
Breaks down sales by payment channels such as Credit Card, UPI, PayPal, etc.
All charts automatically update as soon as you modify or add new data in the Data Sheet Tab.
Click to Buy E-Commerce Sales Performance Dashboard in Google Sheets
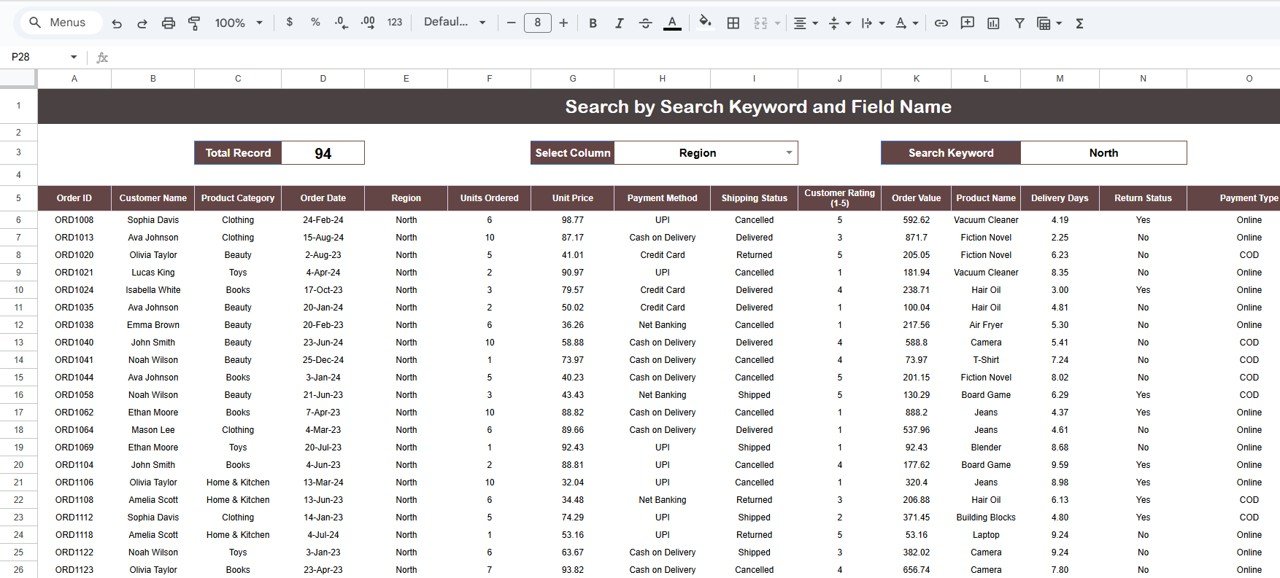
Search Sheet Tab
The Search Tab allows you to quickly locate specific records using keywords or field names.
You can search by:
-
Order ID
-
Product Name or Category
-
Customer Name
-
Region
-
Payment Method
-
Shipping Status
This makes it easy to perform quick lookups or audits directly within the dashboard.
Click to Buy E-Commerce Sales Performance Dashboard in Google Sheets
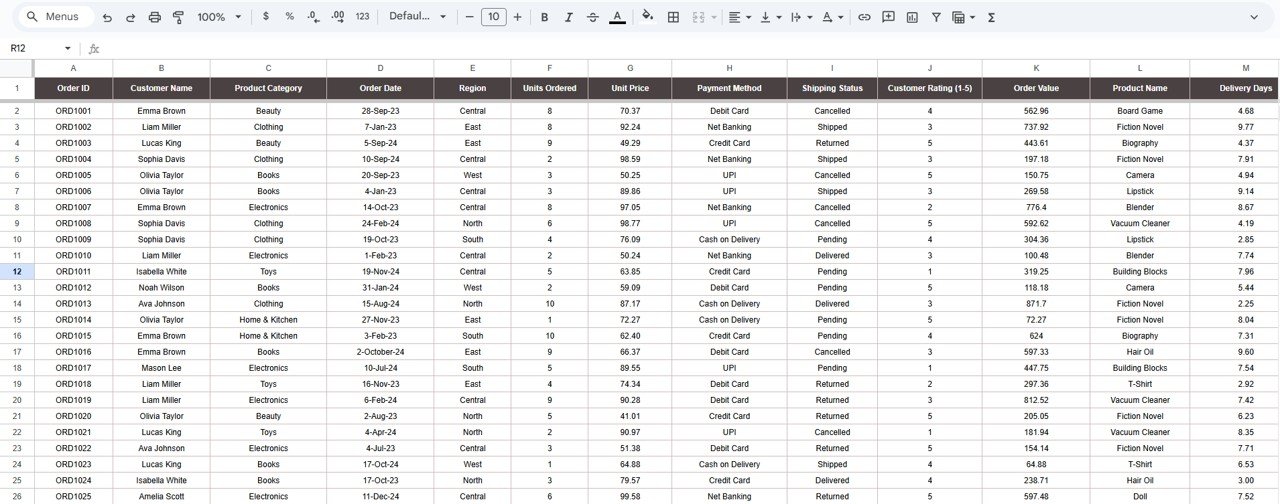
Data Sheet Tab
The Data Sheet Tab serves as the raw data input table. It’s the foundation of the dashboard and stores all transactional records.
Support Sheet Tab
This sheet contains reference lists and dropdown sources used throughout the dashboard — such as Product Categories, Regions, and Payment Methods. It ensures clean, standardized data entry.
Click to Buy E-Commerce Sales Performance Dashboard in Google Sheets
Advantages of the E-Commerce Sales Performance Dashboard
-
Real-Time Insights: View live performance without manual recalculation.
-
Comprehensive View: Covers sales, operations, logistics, and customer satisfaction.
-
Visual Storytelling: Charts make complex data simple and actionable.
-
Scalable: Easily adaptable for multiple regions, stores, or product lines.
-
Collaborative: Google Sheets enables multiple users to view and edit in real time.
-
Customizable: Add new KPIs, product types, or regions as business evolves.
Opportunities for Improvement
Click to Buy E-Commerce Sales Performance Dashboard in Google Sheets
You can extend this dashboard further by adding automation and deeper analytics:
-
Google Form Integration: Collect order and delivery data automatically.
-
Email Alerts: Notify managers when profit margins drop below thresholds.
-
Advanced Filters: Add slicers for date range, region, or payment method.
-
Predictive Analysis: Add revenue forecasting based on past trends.
-
Customer Segmentation: Analyze repeat vs new customer behavior.
Best Practices for Using the Dashboard
-
Maintain Data Consistency: Use standardized field names and dropdowns.
-
Validate Data Regularly: Check for missing or duplicate order IDs.
-
Update Frequently: Refresh data daily or weekly for accurate tracking.
-
Use Filters: Narrow down insights by category or geography.
-
Monitor Trends: Review monthly performance to adjust sales strategies.
-
Protect Calculations: Lock formula cells to prevent accidental changes.
Conclusion
Click to Buy E-Commerce Sales Performance Dashboard in Google Sheets
The E-Commerce Sales Performance Dashboard in Google Sheets is a complete analytical toolkit for online sellers who want to track performance, optimize processes, and maximize profitability.
With its automated charts, dynamic KPIs, and intuitive structure, it empowers teams to make informed, data-driven decisions — without expensive software.
From order management to customer satisfaction, this dashboard covers every aspect of e-commerce performance in one interactive workspace.
Frequently Asked Questions (FAQ)
Click to Buy E-Commerce Sales Performance Dashboard in Google Sheets
1. Can I track multiple stores or websites?
Yes. Add a “Store” column in the Data Sheet to filter performance by store or platform.
2. Can I include cost and profit calculations automatically?
Yes. Simply input Revenue and Cost, and the Profit and Margin will auto-calculate.
3. Can I share the dashboard with my team?
Yes, Google Sheets supports real-time collaboration and version tracking.
4. Can I add new charts?
Absolutely. You can insert new pivot charts for additional analysis like customer behavior or shipping time distribution.
5. How do I ensure accurate results?
Maintain clean data, update regularly, and verify formulas in the KPI Definition tab.
Visit our YouTube channel to learn step-by-step video tutorials
Youtube.com/@NeotechNavigators
Watch the step-by-step video Demo:
Click to Buy E-Commerce Sales Performance Dashboard in Google Sheets