Energy trading is a data-intensive business. Traders, analysts, and management teams must track prices, volumes, margins, risks, and efficiency every single day. However, when KPIs remain scattered across multiple sheets or systems, decision-making becomes slow and unreliable.
That is exactly why the Energy Trading KPI Dashboard in Google Sheets plays a critical role.
In this detailed article, you will learn what this dashboard is, how it works, all KPIs with units, formulas, and definitions, and how to use the dashboard effectively. Moreover, you will explore its advantages, best practices, and frequently asked questions, so you can use it confidently in real-world energy trading operations.
What Is an Energy Trading KPI Dashboard in Google Sheets?
Click to Buy Energy Trading KPI Dashboard in Google Sheets
An Energy Trading KPI Dashboard in Google Sheets is a structured performance-tracking solution designed to monitor trading performance, financial efficiency, operational effectiveness, and risk exposure in the energy trading business.
Instead of relying on complex systems or manual reports, this dashboard provides:
- Monthly and yearly KPI tracking
- Target vs Actual comparison
- Previous Year comparison
- Trend analysis
- Clear visual indicators
Because the dashboard runs on Google Sheets, teams can collaborate easily and update data in real time.
Why Do Energy Trading Teams Need a KPI Dashboard?
Energy markets change rapidly. Therefore, trading decisions must rely on accurate and timely KPIs.
Without a proper dashboard:
-
Performance visibility remains low
-
Risk exposure increases
-
Targets become difficult to track
-
Manual errors increase
As a result, an Energy Trading KPI Dashboard helps teams stay in control, reduce risk, and improve profitability.
Overview of Energy Trading KPI Dashboard in Google Sheets
Click to Buy Energy Trading KPI Dashboard in Google Sheets
This dashboard is built with 6 structured worksheet tabs, each serving a specific purpose.
Worksheets Included in the Dashboard
- Dashboard Sheet
- KPI Trend Sheet
- Actual Number Sheet
- Target Sheet
- Previous Year Number Sheet
- KPI Definition Sheet
Together, these sheets create a complete KPI management system.
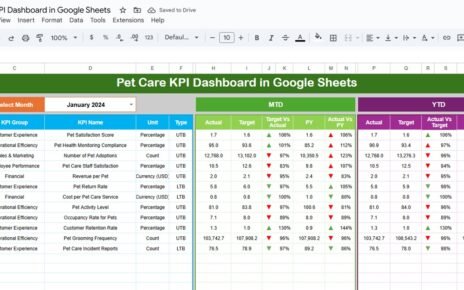
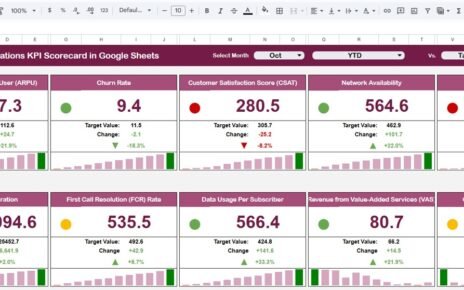
Dashboard Sheet: How Does the Main KPI Dashboard Work?
The Dashboard Sheet is the main reporting page.
Key Features of Dashboard Sheet
-
Month selection dropdown at D3
-
Automatic refresh of all KPIs based on selected month
-
MTD (Month-to-Date) performance
-
YTD (Year-to-Date) performance
-
Target vs Actual comparison
-
Previous Year vs Actual comparison
-
Conditional formatting with Up/Down arrows
KPIs Displayed on Dashboard
-
MTD Actual, Target, Previous Year
-
YTD Actual, Target, Previous Year
-
Variance indicators for performance tracking
Because of conditional formatting, users can instantly identify good or poor performance.

Click to Buy Energy Trading KPI Dashboard in Google Sheets
KPI Trend Sheet: How Can You Analyze KPI Trends?
The KPI Trend Sheet focuses on individual KPI analysis.
Features of KPI Trend Sheet
-
KPI selection dropdown at C3
Display of:
- KPI Group
- KPI Unit
- KPI Type (Upper the Better / Lower the Better)
- KPI Formula
- KPI Definition
This sheet helps users understand KPI behavior over time instead of looking only at static numbers.

Click to Buy Energy Trading KPI Dashboard in Google Sheets
Actual Number Sheet: Where Do You Enter Actual Performance?
The Actual Number Sheet captures real performance data.
How This Sheet Works
-
Select the first month of the year in Cell E1
-
Enter MTD and YTD actual values for each KPI
-
Monthly data updates automatically
Because of structured input, data remains consistent and accurate.

Click to Buy Energy Trading KPI Dashboard in Google Sheets
Target Sheet: How Do You Set Performance Goals?
The Target Sheet stores KPI targets.
Key Details
-
Enter MTD Target values
-
Enter YTD Target values
-
Targets drive dashboard comparisons
This sheet ensures alignment between strategy and execution.

Click to Buy Energy Trading KPI Dashboard in Google Sheets
Previous Year Number Sheet: Why Is Historical Comparison Important?
The Previous Year Number Sheet allows year-over-year analysis.
Benefits
-
Performance benchmarking
-
Trend comparison
-
Growth or decline identification
This comparison helps energy trading teams measure real progress.

Click to Buy Energy Trading KPI Dashboard in Google Sheets
KPI Definition Sheet: Why Is This Sheet Critical?
The KPI Definition Sheet acts as the backbone of the dashboard.
Columns Included
-
KPI Name
-
KPI Group
-
Unit
-
Formula
-
KPI Definition
-
KPI Type (Upper the Better / Lower the Better)
This sheet ensures clarity, consistency, and governance.

Click to Buy Energy Trading KPI Dashboard in Google Sheets
Advantages of Energy Trading KPI Dashboard in Google Sheets
- Centralized KPI tracking
- Clear MTD and YTD performance view
- Target and Previous Year comparison
- Easy trend analysis
- Google Sheets collaboration
- No complex software required
- Faster decision-making
Best Practices for Energy Trading KPI Dashboard
Click to Buy Energy Trading KPI Dashboard in Google Sheets
- Update actual data regularly
- Define KPIs clearly in the definition sheet
- Review YTD trends, not just monthly results
- Monitor risk-related KPIs frequently
- Keep targets realistic and aligned with strategy
- Share dashboard access with stakeholders
Who Should Use This Dashboard?
- Energy Trading Firms
- Power & Utility Companies
- Commodity Traders
- Risk Management Teams
- Finance & Trading Analysts
- Energy Portfolio Managers
Conclusion: Why Energy Trading KPI Dashboard in Google Sheets Matters
Click to Buy Energy Trading KPI Dashboard in Google Sheets
The Energy Trading KPI Dashboard in Google Sheets transforms raw trading data into actionable insights. Instead of reacting to market changes late, teams can monitor performance in real time and respond proactively.
Because the dashboard combines clarity, structure, and flexibility, it becomes an essential tool for improving profitability and managing risk in energy trading operations.
Frequently Asked Questions (FAQs)
What is the main purpose of this dashboard?
It tracks energy trading performance using structured KPIs.
Can I customize KPIs?
Yes, all KPIs, formulas, and targets are customizable.
Does it support MTD and YTD analysis?
Yes, both MTD and YTD metrics are included.
Can multiple users collaborate?
Yes, Google Sheets supports real-time collaboration.
Is it suitable for power and gas trading?
Yes, it works for electricity, gas, oil, and commodities.
Visit our YouTube channel to learn step-by-step video tutorials
Youtube.com/@NeotechNavigators
Watch the step-by-step video tutorial: