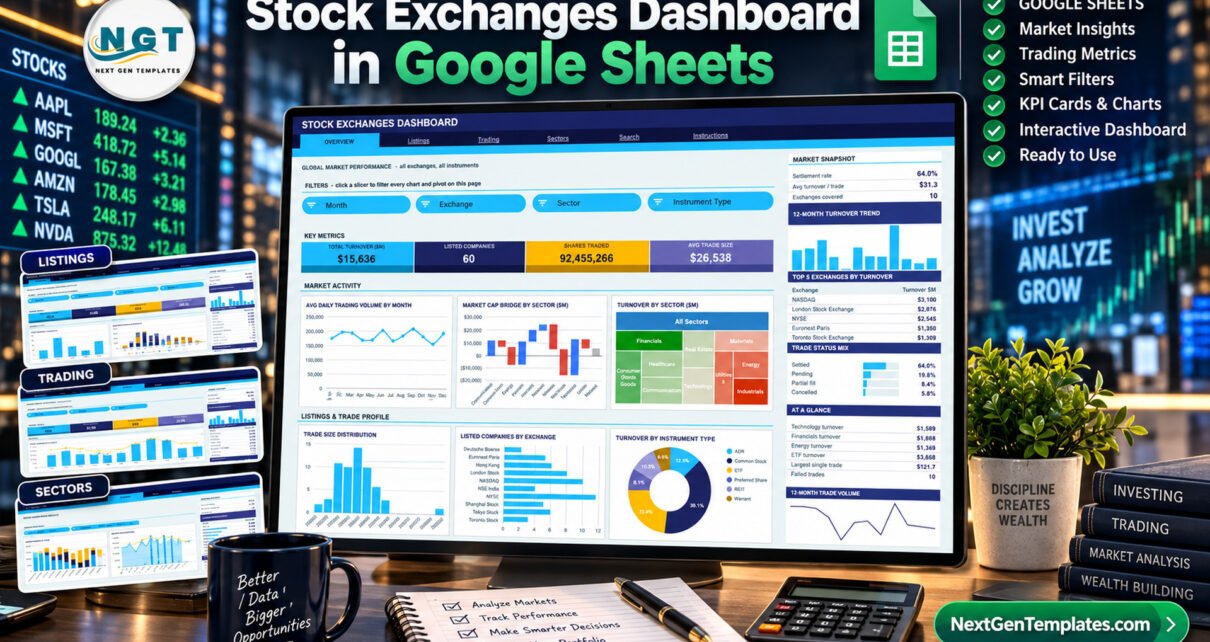
Stock Exchanges Dashboard in Google Sheets: 4 slicer-driven pages, 16 KPI cards and 500 fictional sample trades covering turnover, listings, order flow and sectors. A reporting template, not a trading or advice tool.
Online Tutorial for Data Analysis and Automation
Stock Exchanges Dashboard in Google Sheets: 4 slicer-driven pages, 16 KPI cards and 500 fictional sample trades covering turnover, listings, order flow and sectors. A reporting template, not a trading or advice tool.

Energy trading is a data-intensive business. Traders, analysts, and management teams must track prices, volumes, margins, risks, and efficiency every single day. However, when KPIs remain scattered across multiple sheets or systems, decision-making becomes slow and unreliable. That is exactly why the Energy Trading KPI Dashboard in Google Sheets plays a critical role. In this […]