Google Sheets is a powerful tool for data analysis and organization. One of its most valuable features is the ability to quickly filter and analyze data without complex software. This article will guide you about Filter and Filter View in Google Sheet.
Understanding Filter and Filter View in Google Sheet
Filters in Google Sheets allow you to view only the data that meets certain criteria. This makes analyzing large datasets manageable and helps you focus on the information that matters most.
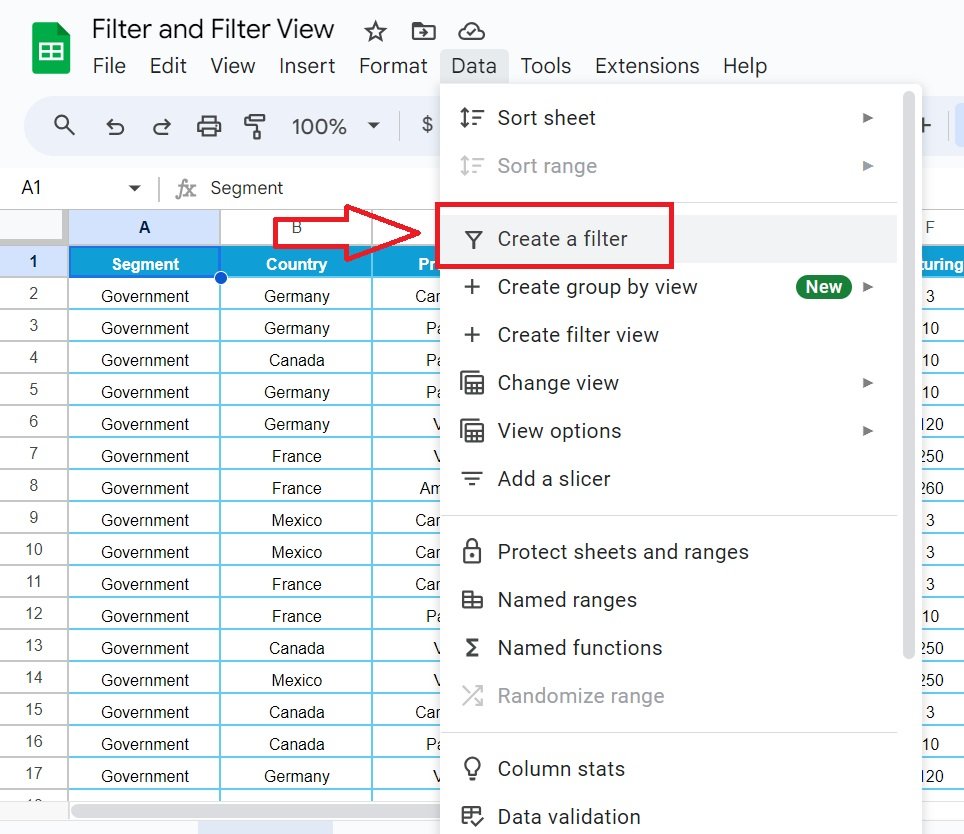
How to Apply a Filter
Navigate to the ‘Data’ tab and select ‘Create a Filter’, or use the shortcut key Alt+D+F. Filter icons will appear on your sheet, allowing you to start filtering data.
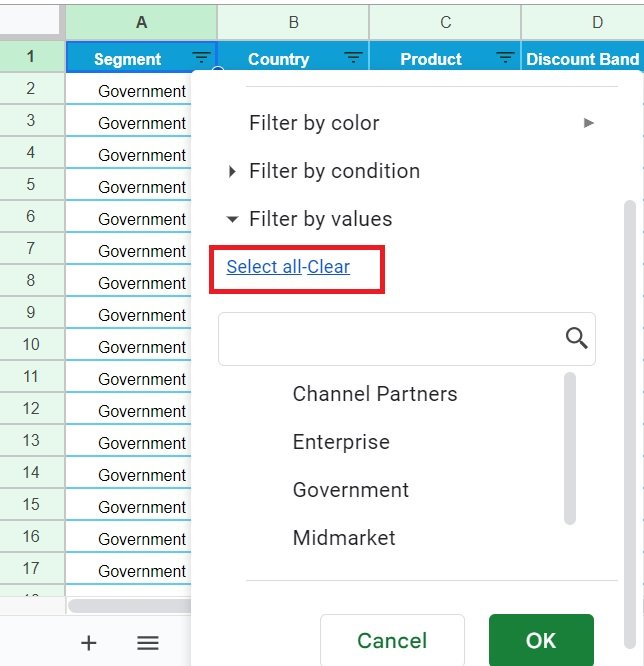
Using Text Filters
Click the filter arrow in a text column, select ‘Clear All’, and then choose the values you wish to see. This filters the sheet to show only the rows that meet your criteria.
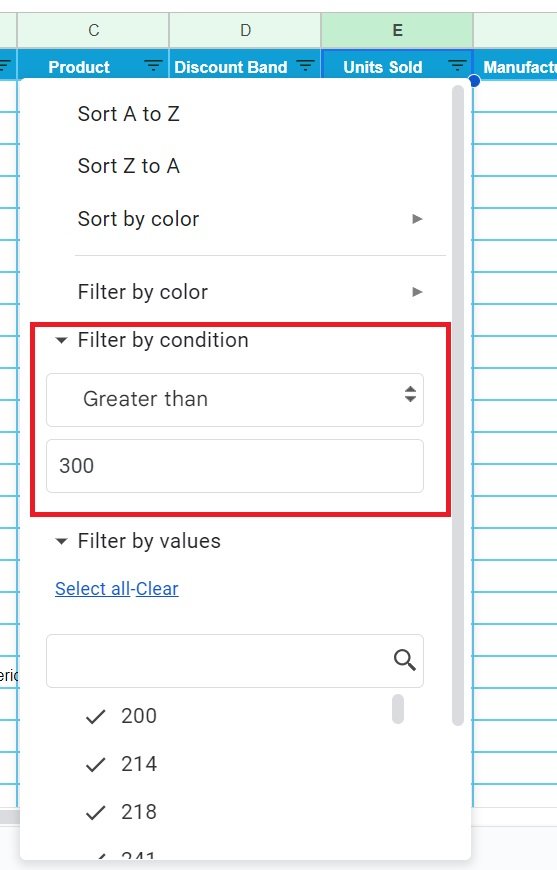
Number Filters
For numbers, click the filter arrow, select ‘Filter by condition’, and choose conditions like ‘greater than’, ‘less than’, or ‘equal to’ to refine your data view.
Date Filters
To filter by date, select the filter arrow in a date column, choose ‘Filter by condition’, and then ‘date is before’ or any other relevant condition to narrow down your data to a specific timeframe.
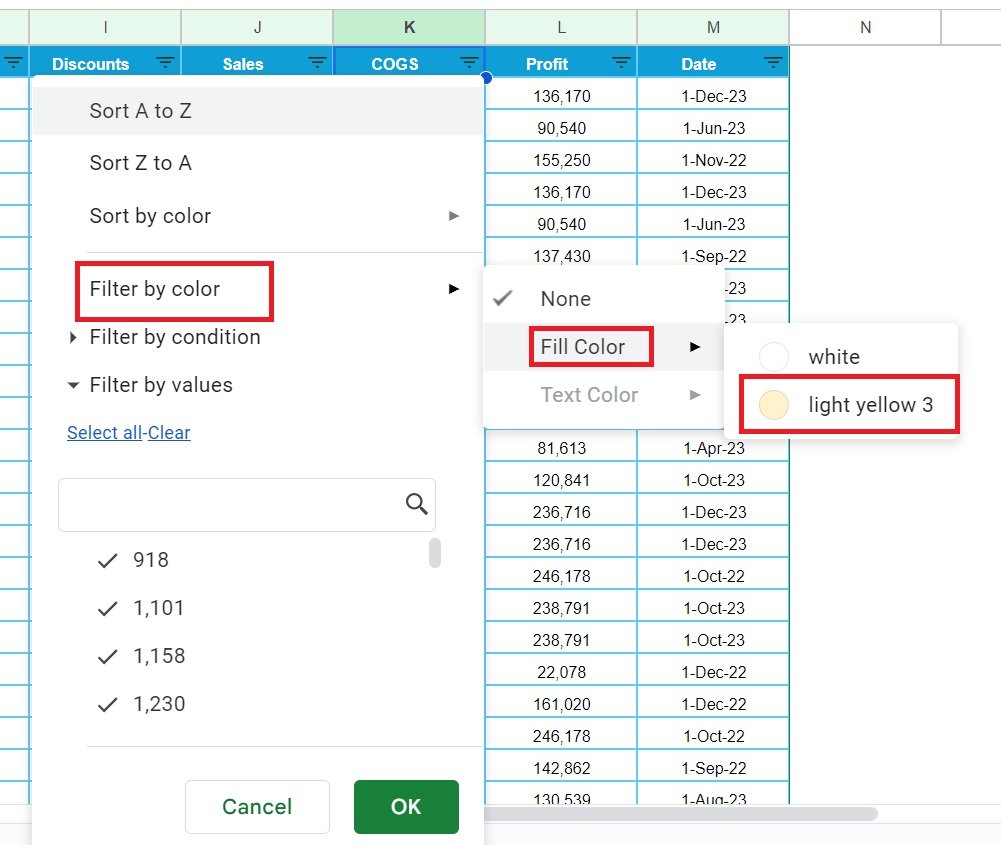
If your data is color-coded, filter by color by clicking the filter arrow, going to ‘Filter by color’, and selecting the color you want to see.
Exploring Filter Views in Google Sheets
Filter Views are particularly useful for collaborating on shared sheets. They allow you to create personalized views without altering what others see.
How to
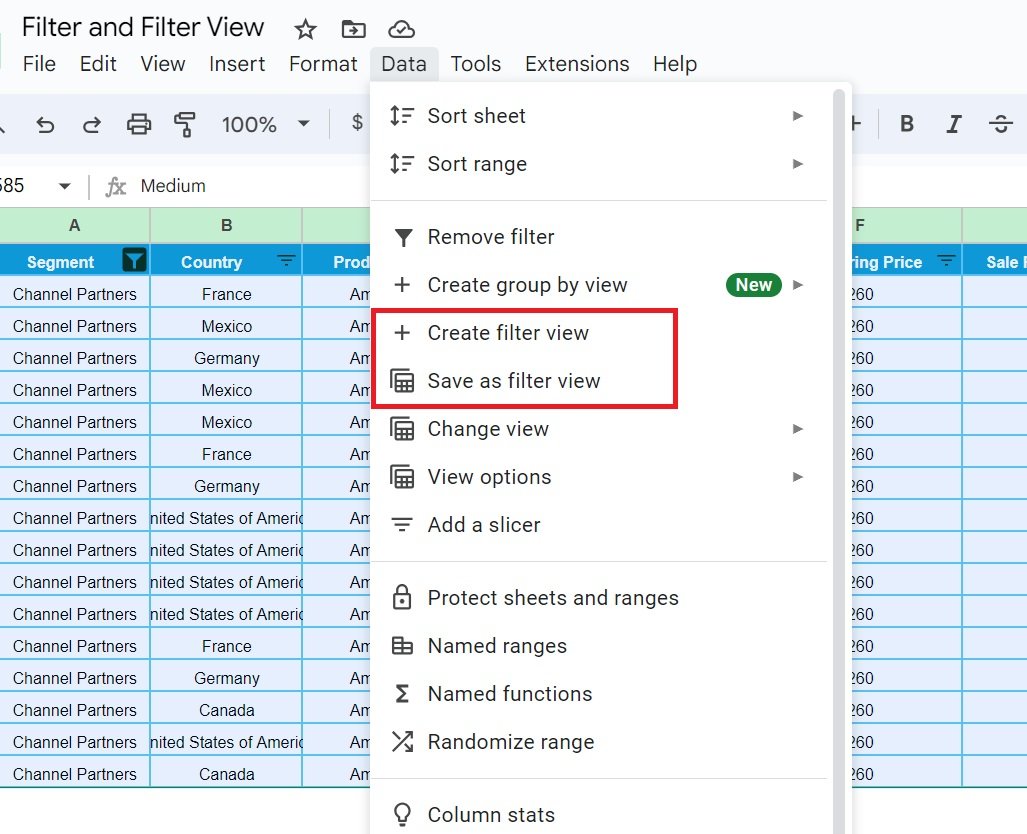
Go to the ‘Data’ tab, select ‘Filter views’, and then ‘Create new filter view’. This changes the color of your column and row headers to black, signaling that you are in a filter view mode.
Name your filter view for easy identification, like ‘Canada country’, and apply filters specifically for this view. If needed, data can be sorted without affecting other users.
Advantages of Using Filters and Filter Views
- Efficiency in Data Handling: Quickly sift through large amounts of data to find exactly what you need.
- Collaboration without Confusion: Create and use Filter Views to analyze shared data without disrupting others’ views.
- Customizable Data Analysis: Tailor filters to meet specific data analysis needs, enhancing your productivity and data insights.
Opportunities for Improvement in Filter Usage
While Google Sheets’ filtering capabilities are robust, users often underutilize these features due to unawareness of all available options, such as filtering by conditions or using advanced custom formulas in filters.
Best Practices for Filters in Google Sheets
- Regularly Update Filter Ranges: Ensure your filters cover all relevant data, especially when new data is added to your sheets.
- Combine Filters for Deeper Analysis: Use multiple filter types together to refine your data views further.
- Use Named Ranges: This makes managing filters easier, especially in complex sheets.
Conclusion
Filters and Filter Views in Google Sheets are powerful tools for managing and analyzing data efficiently. By understanding and utilizing these features, you can enhance your productivity and make data-driven decisions more effectively.
Frequently Asked Questions
Q. How do I save a Filter View?
A. After creating a Filter View, it automatically saves in your Google Sheet. You can access it anytime from the ‘Data’ tab under ‘Filter views’.
Q. Can I share a Filter View with someone?
A. Yes, Filter Views are shareable. Just ensure the person you’re sharing with has access to the Google Sheet.
Q. Is it possible to apply multiple filters in one column?
A. Yes, you can apply multiple conditions to a single column to further refine your data filtering.
By integrating these instructions and tips into your routine, you can fully leverage the power of Google Sheets’ filtering capabilities to streamline your workflow and improve data management.
Visit our YouTube channel to learn step-by-step video tutorials
Youtube.com/@NeotechNavigators