The fishing industry plays a vital role in global food production and coastal economies. From small-scale fisheries to large commercial operations, the need for data-driven decision-making has never been greater. Tracking key performance indicators (KPIs) helps managers, fleet owners, and regulators ensure operational efficiency, sustainability, and profitability.
However, managing multiple spreadsheets and reports manually can become complex and time-consuming. That’s why a Fishing Industry KPI Dashboard in Google Sheets is the perfect solution. It brings all performance data together in one dynamic and interactive place — helping you visualize progress, compare results, and make smarter business decisions.
In this article, we’ll explore everything you need to know about the Fishing Industry KPI Dashboard in Google Sheets — including its structure, advantages, best practices, and frequently asked questions.
Click to buy Fishing Industry KPI Dashboard in Google Sheets
What Is a Fishing Industry KPI Dashboard in Google Sheets?
A Fishing Industry KPI Dashboard in Google Sheets is a ready-to-use, data-driven reporting tool that helps you monitor and analyze critical performance indicators in the fishing sector.
Whether you’re tracking catch volumes, vessel efficiency, cost per trip, revenue trends, or sustainability metrics, this dashboard provides a centralized system to view, compare, and evaluate key results.
Built entirely in Google Sheets, the dashboard is easy to use, share, and customize — no coding or complex setup required. You can access it from anywhere, collaborate in real-time with your team, and make instant updates whenever needed.
Key Features of the Fishing Industry KPI Dashboard in Google Sheets
This dashboard includes six interactive worksheet tabs, each designed for specific analysis and reporting. Let’s explore how each one works.
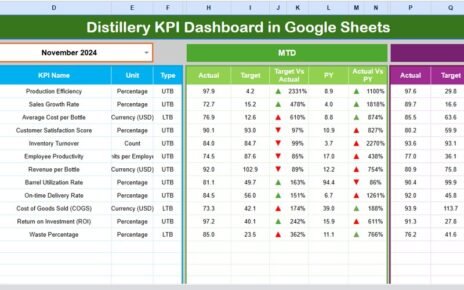
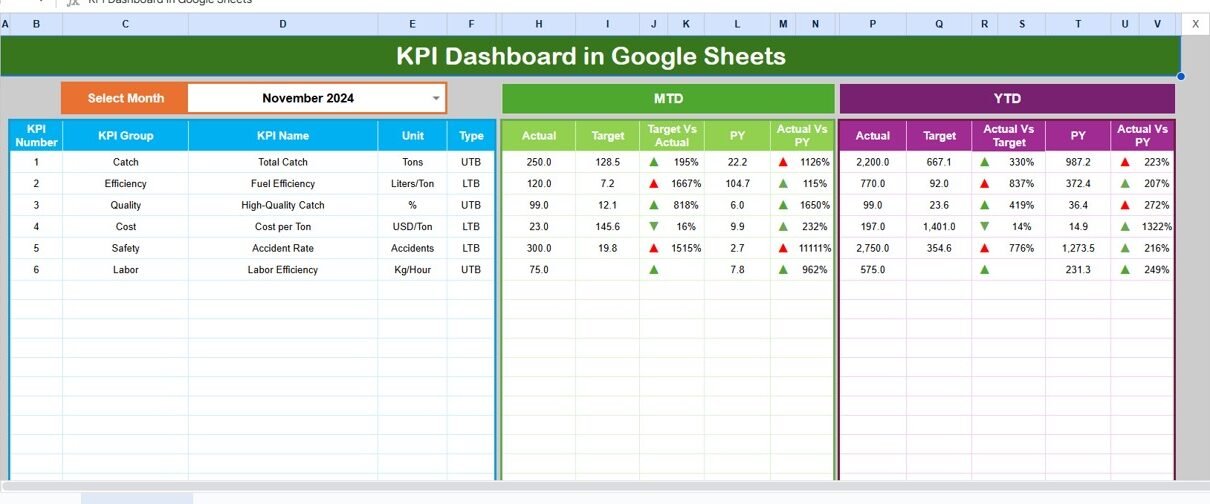
Dashboard Sheet Tab
The Dashboard sheet serves as the main visualization page.
Here, you can:
- Select the desired month from the dropdown in cell D3.
- View automatically updated data for that month.
- Analyze MTD (Month-to-Date) and YTD (Year-to-Date) results.
- Compare Actual vs Target and Actual vs Previous Year values.
- Use built-in conditional formatting with up/down arrows to highlight performance trends.
This visual layout gives you an instant understanding of how your fishing operations are performing at any given time.

Click to buy Fishing Industry KPI Dashboard in Google Sheets
Trend Sheet Tab
The Trend sheet tab provides a detailed view of performance trends over time.
On this tab:
- You can choose a specific KPI name from the dropdown in cell C3.
- Automatically see details such as KPI Group, Unit, Type (Lower/Upper the Better), Formula, and Definition.
- Review both MTD and YTD trend charts that display Actual, Target, and Previous Year numbers.
This tab is essential for spotting patterns, identifying seasonal variations, and understanding how various operational factors influence results.

Click to buy Fishing Industry KPI Dashboard in Google Sheets
Actual Numbers Input Sheet
The Actual Numbers Input sheet is the foundation of your dashboard.
Here’s how it works:
- You input monthly actual data for MTD and YTD values.
- The month sequence automatically updates when you adjust cell E1, which defines the first month of the year.
- This flexibility allows you to start tracking performance from any point in the year — perfect for companies with different fiscal periods.

Target Sheet Tab
The Target sheet allows you to define goal values for each KPI.
You can:
- Set monthly targets for both MTD and YTD performance.
- Use historical data or industry benchmarks as a reference.
- Instantly visualize whether you’re meeting your objectives when comparing with actual performance on the dashboard.
Setting measurable targets is the backbone of continuous improvement in the fishing industry — and this tab keeps you focused on hitting those goals.

Previous Year Numbers Sheet
In the Previous Year sheet, you can store and analyze the previous year’s KPI data.
This is crucial for:
- Understanding long-term growth or decline.
- Comparing year-over-year progress.
- Benchmarking performance against historical results.
The dashboard automatically uses these numbers for visual comparisons, allowing you to see if this year’s catch volumes, fuel efficiency, or operational costs are improving or not.

Click to buy Fishing Industry KPI Dashboard in Google Sheets
KPI Definition Sheet
The KPI Definition sheet is your reference guide.
It includes:
- KPI Name
- KPI Group
- Unit of Measurement
- Formula
- KPI Definition
- Type (Lower or Upper the Better)
This ensures consistency and clarity for everyone using the dashboard. Team members can easily understand what each KPI measures and how it’s calculated.

Why You Need a KPI Dashboard for the Fishing Industry
The fishing sector involves many moving parts — fleet management, logistics, sustainability compliance, weather dependency, and more. Without clear visibility into your KPIs, it’s easy to miss out on opportunities or overlook inefficiencies.
A KPI dashboard in Google Sheets simplifies this by giving you a single source of truth. It helps you:
- Track productivity per vessel or crew.
- Analyze profit margins for each fishing trip.
- Monitor sustainability KPIs like bycatch rate or carbon emissions.
- Measure cost and yield efficiency per ton of fish caught.
- Identify underperforming regions, fleets, or seasons.
With this dashboard, you move away from guesswork and toward data-backed decision-making.
Important KPIs to Track in the Fishing Industry
When building your fishing industry KPI dashboard, it’s important to choose metrics that reflect both financial performance and sustainability
Advantages of Using a Fishing Industry KPI Dashboard in Google Sheets
- Real-Time Insights
Google Sheets allows live data updates, so your dashboard always reflects the latest numbers. No need to wait for end-of-month reports.
- Cost-Effective Solution
Unlike expensive software tools, Google Sheets is free and accessible, making it perfect for small and medium-sized fishing companies.
- Customizable and Flexible
You can easily add new KPIs, adjust calculations, or integrate with Google Forms or Apps Script for automation.
- Collaboration Made Easy
Teams across departments or regions can view, edit, and comment simultaneously. This improves communication and accountability.
- Cloud-Based Accessibility
Access your dashboard from any device — desktop, tablet, or mobile — without worrying about file versions or installations.
- Sustainable Decision-Making
By monitoring environmental metrics alongside production and financial KPIs, the fishing industry can adopt eco-friendly and compliant practices.
How to Build a Fishing Industry KPI Dashboard in Google Sheets
Creating this dashboard doesn’t require technical expertise. Follow these simple steps:
- List Your KPIs – Start with 10–15 relevant KPIs covering financial, operational, and sustainability performance.
- Prepare Your Data Sheets – Create tabs for Actuals, Targets, and Previous Year Data.
- Add Formulas – Use formulas like SUMIFS, AVERAGEIFS, and IFERROR to calculate MTD and YTD values.
- Use Data Validation – Create dropdown lists for month and KPI selection.
- Apply Conditional Formatting – Highlight KPIs that meet or miss targets with green and red arrows.
- Insert Charts – Use pivot charts for visual trends — bar charts for volumes, line charts for trends, and donut charts for category distribution.
- Link Everything to the Dashboard – Use IMPORTRANGE or QUERY if you’re pulling from external sources.
- Share and Collaborate – Give access to managers or stakeholders to review live data anytime.
Best Practices for Using the Fishing Industry KPI Dashboard
To get maximum value from your dashboard, follow these best practices:
- Keep It Simple
Avoid adding too many KPIs. Focus on those that truly drive performance and profitability.
- Update Data Consistently
Set a routine to update the Actual and Target sheets at regular intervals — daily, weekly, or monthly.
- Use Visuals Effectively
Leverage charts, bars, and arrows to simplify data interpretation. A visual dashboard is easier to understand than tables full of numbers.
- Integrate Automation
Use Google Apps Script or data connectors to automatically pull data from fleet tracking systems, accounting tools, or sales databases.
- Benchmark Performance
Compare performance not only against targets but also against previous years or industry averages.
- Maintain Data Accuracy
Validate entries regularly to avoid calculation errors or misleading insights.
- Encourage Team Engagement
Share the dashboard in team meetings. Discuss improvements and celebrate when targets are achieved.
How the Dashboard Supports Sustainable Fishing
Sustainability is at the heart of modern fishing operations. A well-designed KPI dashboard ensures your business supports long-term ecological balance.
Here’s how:
- Tracks Bycatch Rates: Helps reduce waste and protect marine biodiversity.
- Monitors Fuel Efficiency: Promotes energy conservation and cost reduction.
- Ensures Compliance: Tracks adherence to environmental and government regulations.
- Encourages Transparency: Builds trust with customers and regulators through data visibility.
Conclusion
In today’s data-driven era, fishing businesses must rely on performance intelligence to thrive. The Fishing Industry KPI Dashboard in Google Sheets is not just a reporting tool — it’s a strategic asset that transforms raw data into actionable insights.
By tracking essential metrics, analyzing trends, and aligning your targets with operational goals, this dashboard helps ensure efficiency, profitability, and sustainability — all within the simplicity of Google Sheets.
If you’re ready to bring clarity and control to your fishing operations, this KPI dashboard is the ultimate solution to get started.
Frequently Asked Questions (FAQs)
- What is a Fishing Industry KPI Dashboard?
It’s a Google Sheets-based tool that tracks key metrics like catch volume, cost efficiency, sustainability, and profitability to help manage fishing operations effectively.
- Who can use this dashboard?
Anyone in the fishing sector — from fleet owners and logistics managers to sustainability officers and financial controllers.
- How often should I update the dashboard?
It depends on your operations. For active fleets, update daily or weekly. For strategic reporting, monthly updates are sufficient.
- Can I add my own KPIs?
Yes. The dashboard is fully customizable — you can easily add, remove, or modify KPIs based on your business needs.
- Does this require technical skills?
Not at all. If you can use basic formulas and dropdowns in Google Sheets, you can use this dashboard.
- Can it integrate with other data sources?
Yes. You can use IMPORTRANGE, Google Apps Script, or third-party connectors to pull live data from other systems.
- How does it help sustainability goals?
By tracking metrics like bycatch rates, fuel consumption, and compliance rates, it ensures your operations are environmentally responsible.
Visit our YouTube channel to learn step-by-step video tutorials
Youtube.com/@NeotechNavigators
Watch the step-by-step video tutorial:
Click to buy Fishing Industry KPI Dashboard in Google Sheets