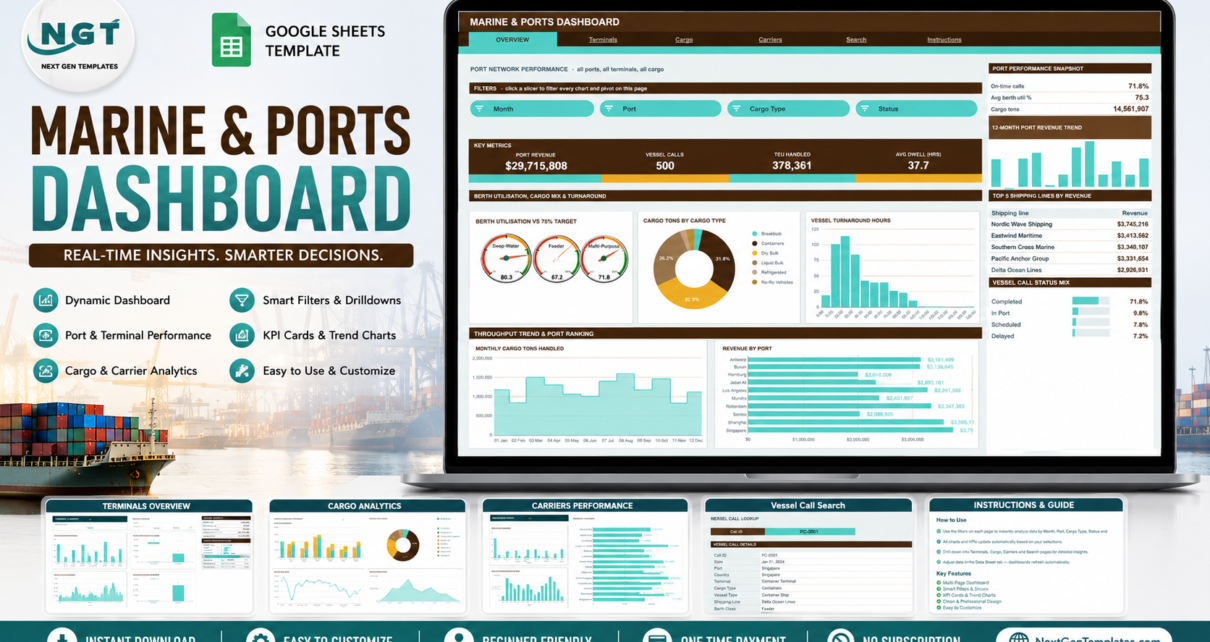
The Marine & Ports Dashboard in Google Sheets reports vessel calls, cargo tonnage, TEU, berth utilisation and shipping line revenue across 6 tabs, 16 KPI cards, 18 pivot-driven charts and 15 slicers – a one-time-purchase reporting layer over your own vessel call log.
Tag: Marine Management
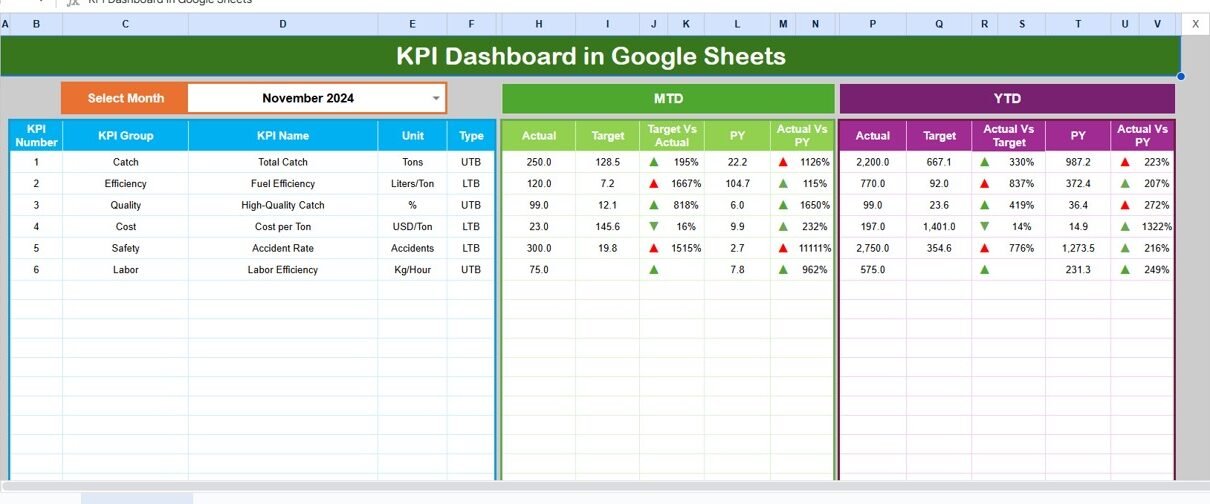
Fishing Industry KPI Dashboard in Google Sheets
The fishing industry plays a vital role in global food production and coastal economies. From small-scale fisheries to large commercial operations, the need for data-driven decision-making has never been greater. Tracking key performance indicators (KPIs) helps managers, fleet owners, and regulators ensure operational efficiency, sustainability, and profitability. However, managing multiple spreadsheets and reports manually can […]