Hospital emergency departments face constant pressure to provide timely, efficient, and high-quality care. Monitoring performance with the right Key Performance Indicators (KPIs) is crucial to ensure patient safety, reduce wait times, and optimize resources.
The Hospital Emergency KPI Dashboard in Google Sheets is a ready-to-use tool designed to help hospital administrators, healthcare managers, and emergency department staff track, analyze, and visualize all key metrics efficiently. This article will guide you through its features, advantages, best practices, and usage tips.
What is a Hospital Emergency KPI Dashboard in Google Sheets?
A Hospital Emergency KPI Dashboard in Google Sheets is an interactive tool that consolidates all emergency department KPIs in a single platform. With this dashboard, users can track Month-to-Date (MTD) and Year-to-Date (YTD) performance, compare current data with previous years, and identify trends in patient care, staffing, and resource utilization.
By using Google Sheets, hospitals can enjoy real-time updates, cloud access, and easy sharing across teams without relying on expensive or complex software.
Key Features of the Hospital Emergency KPI Dashboard
Click to Buy Hospital Emergency KPI Dashboard in Google Sheets
The dashboard is structured across six worksheet tabs, each serving a specific purpose:
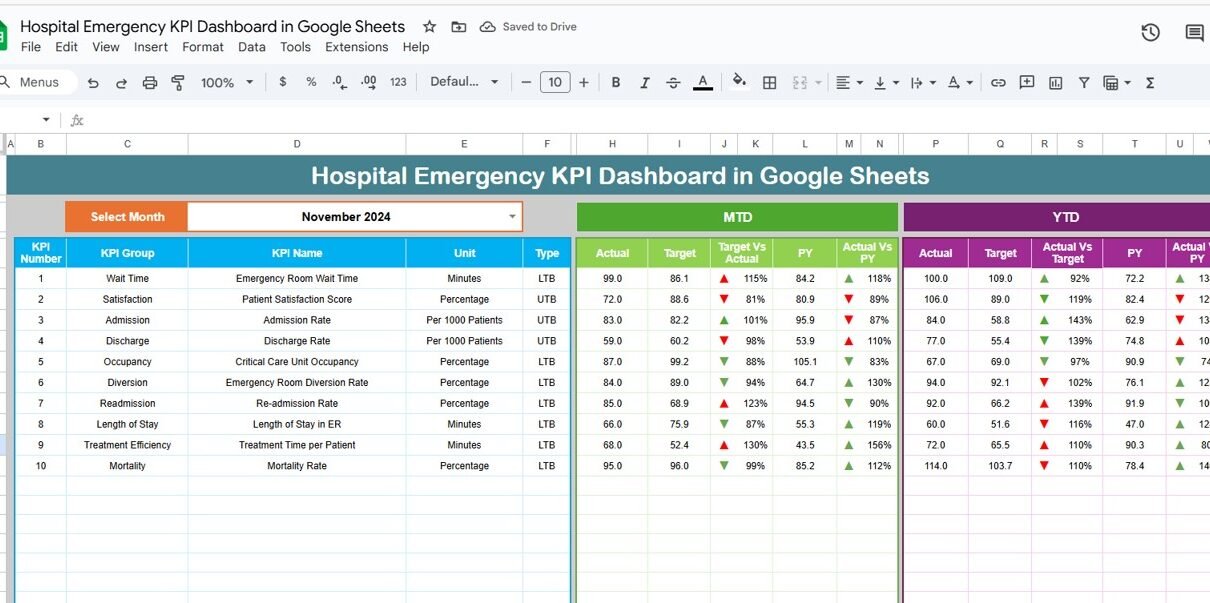
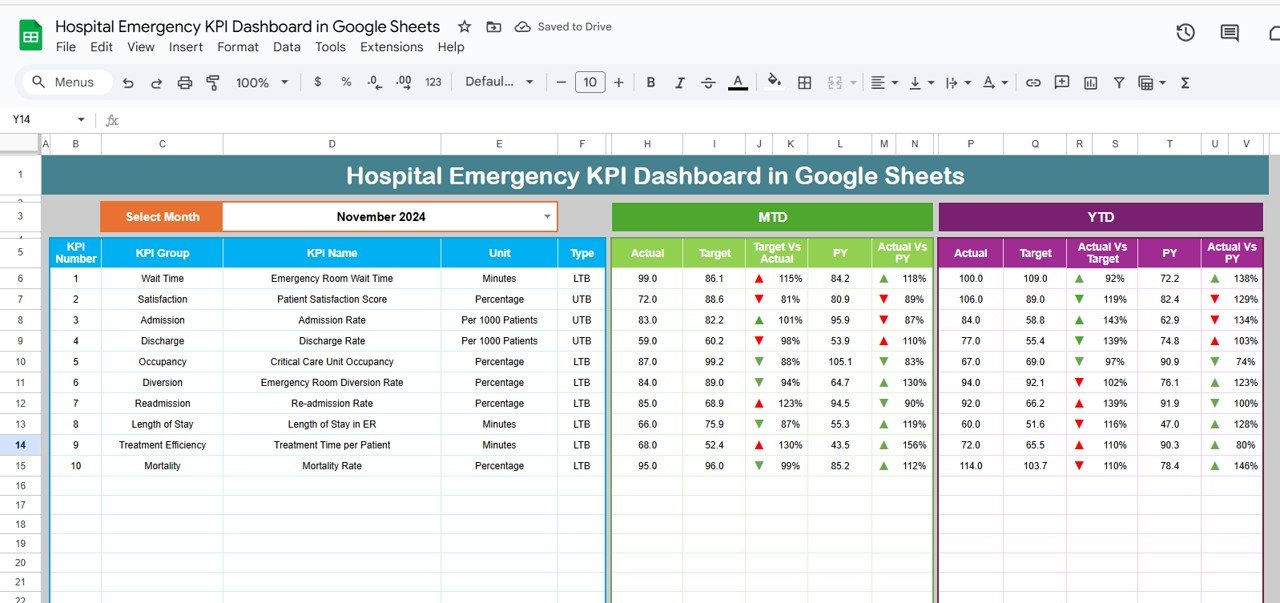
1. Dashboard Sheet Tab
-
The main interface to view all KPIs.
-
Select the month from the dropdown (range D3) to automatically update all dashboard numbers.
-
Displays MTD Actual, Target, and Previous Year (PY) data with Target vs Actual and PY vs Actual percentages.
-
Conditional formatting with up and down arrows highlights performance at a glance.
-
YTD data is also available with similar comparisons for long-term trend analysis.
Click to Buy Hospital Emergency KPI Dashboard in Google Sheets
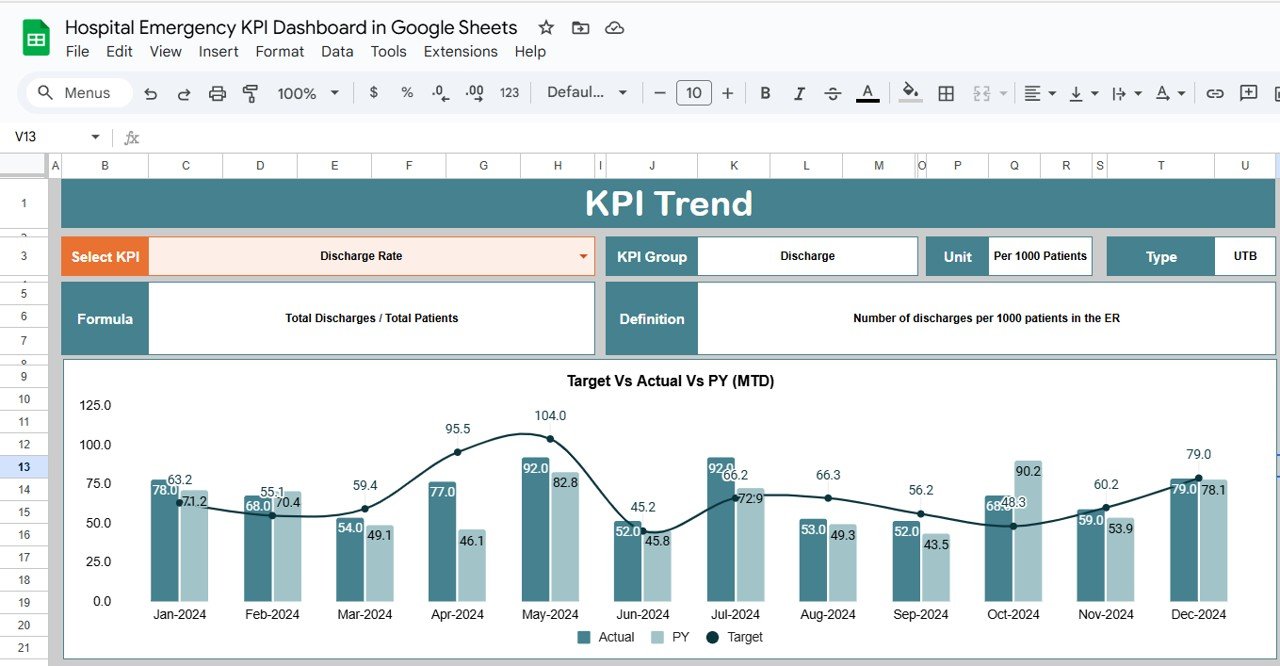
2. KPI Trend Sheet Tab
-
Select any KPI from the dropdown (range C3) to view its details.
-
Displays the KPI Group, Unit, Type (Lower the Better or Upper the Better).
-
Shows the formula used to calculate the KPI and its definition.
-
Helps users understand the purpose and calculation of each KPI for accurate reporting.
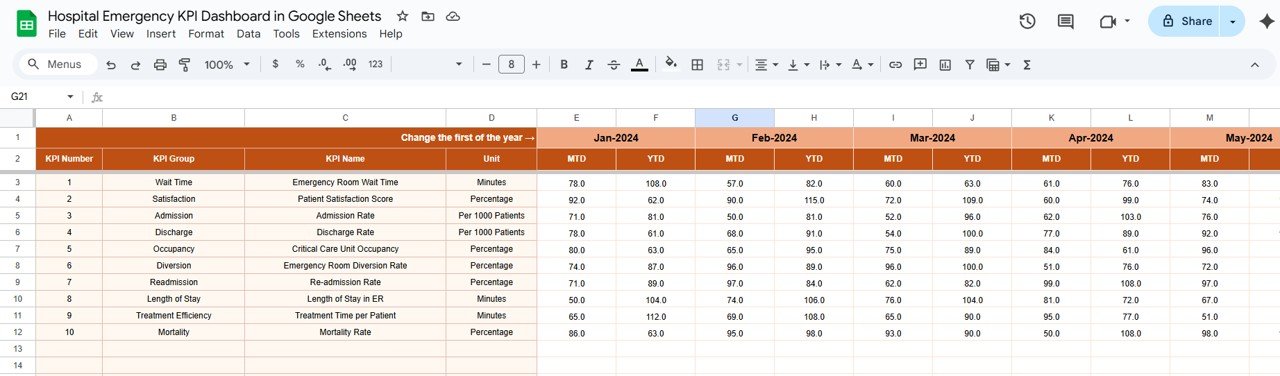
3. Actual Number Sheet Tab
-
Enter the actual MTD and YTD numbers for each KPI.
-
Select the starting month of the year in range E1 to auto-update calculations.
-
Provides a single source of truth for emergency performance data.
Click to Buy Hospital Emergency KPI Dashboard in Google Sheets
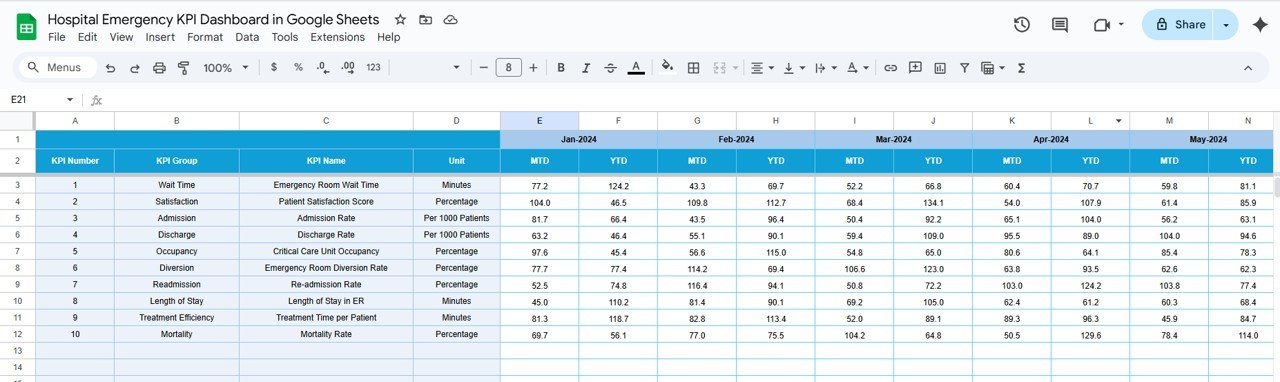
4. Target Sheet Tab
-
Enter the target values for each KPI for the selected month.
-
Supports both MTD and YTD targets.
-
Ensures consistent performance tracking and goal alignment across the emergency department
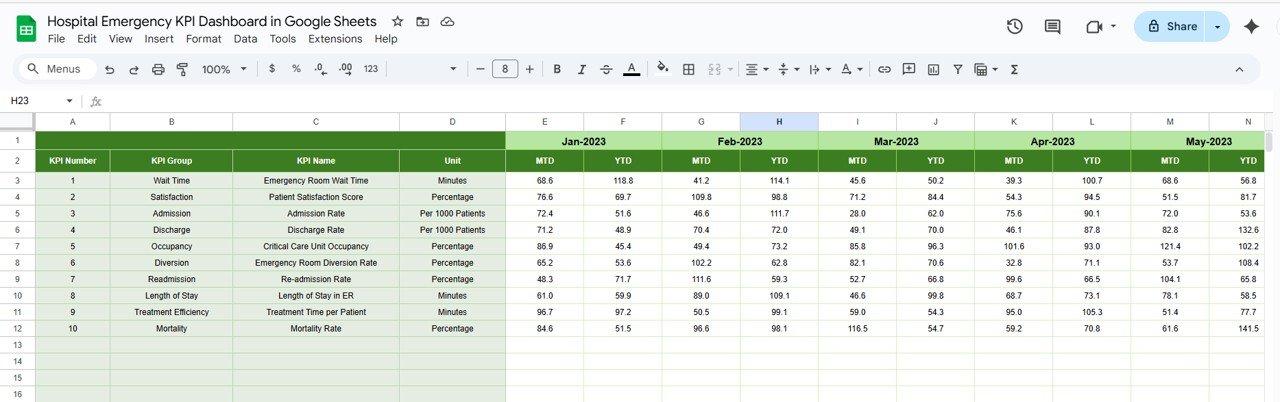
5. Previous Year Number Sheet Tab
-
Enter the previous year’s MTD and YTD data for the same KPIs.
-
Enables year-over-year comparisons to identify improvements or areas of concern.
Click to Buy Hospital Emergency KPI Dashboard in Google Sheets
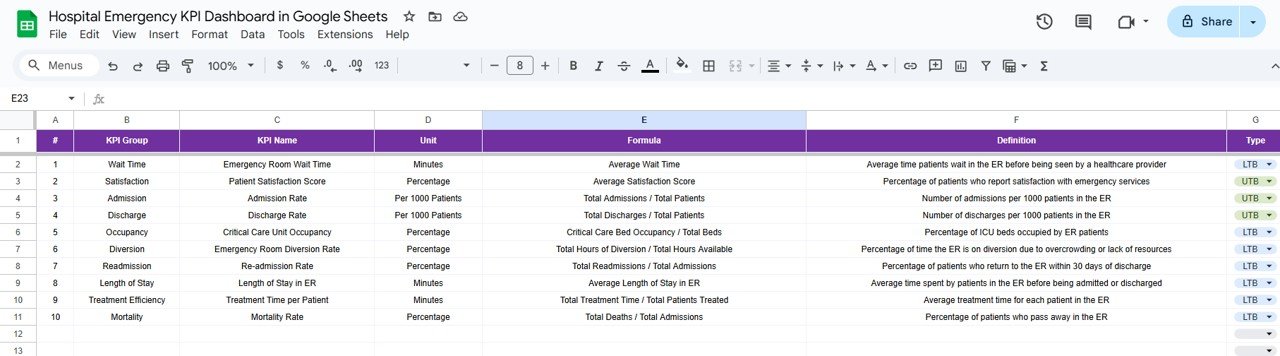
6. KPI Definition Sheet Tab
-
Maintain a master list of all KPIs.
-
Include KPI Name, KPI Group, Unit, Formula, and KPI Definition.
-
Supports clarity and standardization, ensuring all users interpret KPIs consistently.
Advantages of the Hospital Emergency KPI Dashboard
Using this dashboard brings multiple benefits to hospital emergency management:
-
Centralized Data: Consolidates all KPIs in one place for easy access and monitoring.
-
Real-Time Insights: Cloud-based Google Sheets enables live updates and team collaboration.
-
Visual Performance Tracking: Conditional formatting and charts provide instant visibility of trends and targets.
-
Comparative Analysis: Compare current MTD/YTD performance with targets and previous year data to track improvements.
-
Resource Optimization: Identify bottlenecks, improve patient flow, and allocate staff effectively.
-
Simplified Reporting: Generate reports for management or regulatory compliance without manual calculations.
Best Practices for Using the Dashboard
Click to Buy Hospital Emergency KPI Dashboard in Google Sheets
To maximize the value of the Hospital Emergency KPI Dashboard, follow these best practices:
-
Update Data Regularly: Enter MTD and YTD actual numbers at least weekly to keep the dashboard accurate.
-
Set Realistic Targets: Align targets with hospital capacity and patient demand to track meaningful performance.
-
Use KPI Trends: Monitor long-term trends to identify recurring issues or operational improvements.
-
Leverage Conditional Formatting: Quickly identify KPIs that require attention using red/green arrows.
-
Educate Staff: Train users on how to read KPIs, formulas, and definitions for consistent understanding.
-
Backup Regularly: Keep copies of previous month’s sheets to maintain historical data.
-
Collaborate: Share the Google Sheet with authorized staff to encourage data-driven decisions.
Key KPIs to Track in Hospital Emergency
Click to Buy Hospital Emergency KPI Dashboard in Google Sheets
Some essential KPIs commonly included in an emergency dashboard are:
-
Average Patient Wait Time (UTB) – Measures time from arrival to first contact with a healthcare provider.
-
Patient Satisfaction Score (UTB) – Feedback score from patients on the quality of care.
-
ED Length of Stay (LTB) – Average duration a patient spends in the emergency department.
-
Time to Treatment (LTB) – Average time taken to start treatment after diagnosis.
-
Bed Occupancy Rate (UTB) – Percentage of available beds being utilized.
-
Readmission Rate (LTB) – Percentage of patients returning within 30 days of discharge.
Each KPI can be tracked MTD, YTD, and year-over-year using the dashboard to identify operational trends and areas for improvement.
How to Use the Hospital Emergency KPI Dashboard
-
Input Data: Fill out the Actual Number, Target, and Previous Year Sheets for all relevant KPIs.
-
Check KPI Definitions: Review the KPI Definition sheet to understand each KPI’s purpose and formula.
-
Analyze Dashboard: Go to the Dashboard Sheet to view MTD/YTD performance and conditional formatting highlights.
-
Track Trends: Use the KPI Trend Sheet to analyze KPI performance over time.
-
Share Reports: Export or share Google Sheets with stakeholders for review and action.
By following these steps, hospitals can improve transparency, monitor performance, and make data-driven decisions to enhance patient care.
Conclusion
Click to Buy Hospital Emergency KPI Dashboard in Google Sheets
The Hospital Emergency KPI Dashboard in Google Sheets is a comprehensive, user-friendly tool for tracking and analyzing emergency department performance. It combines actual, target, and historical data in one platform, allowing hospital administrators to monitor KPIs, identify areas for improvement, and optimize emergency care processes.
With real-time updates, conditional formatting, and trend analysis, this dashboard provides actionable insights that can enhance patient care, reduce wait times, and streamline hospital operations.
Frequently Asked Questions (FAQs)
1. Can this dashboard track both MTD and YTD performance?
Yes, it provides Month-to-Date and Year-to-Date comparisons for all KPIs.
2. Is it possible to compare KPIs with the previous year?
Absolutely, the Previous Year Number sheet allows year-over-year comparisons for trend analysis.
3. Do I need Google Sheets experience to use this dashboard?
No. The dashboard is designed to be intuitive with dropdowns, easy-to-fill sheets, and conditional formatting.
4. Can I add new KPIs to the dashboard?
Yes, simply update the KPI Definition sheet with the new KPI details, formula, unit, and type.
5. Is the dashboard collaborative?
Yes, since it is cloud-based, multiple authorized users can access and update it in real-time.
Visit our YouTube channel to learn step-by-step video tutorials
Youtube.com/@NeotechNavigators
Watch the step-by-step video Demo:
Click to Buy Hospital Emergency KPI Dashboard in Google Sheets