Hospitality & Resorts Dashboard in Google Sheets
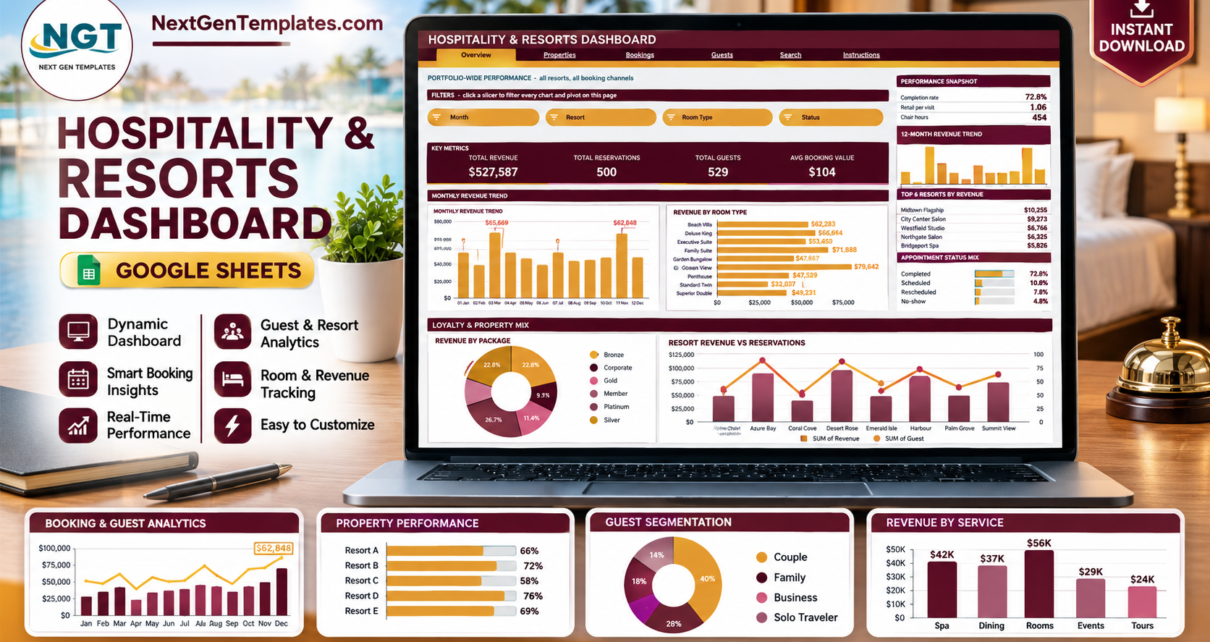
Every property management system will tell you last month’s revenue. Far fewer will tell you, on one screen, which property earns most per room night rather than in total, what a travel-agent booking is really worth against a direct one, and how much of the year quietly leaves as no-shows. The Hospitality & Resorts Dashboard in Google Sheets is built around those questions – 6 pages, 16 KPI cards, 16 charts, 4 named slicers per page and a reservation lookup, all running on native Google Sheets pivot tables and slicers rather than a wall of formulas. The sample file carries 500 reservations across 8 resorts, 9 room types, 8 packages and 10 booking channels.
Hospitality
Hospitality & Resorts Dashboard in Google Sheets
This article walks through each page, explains the pivot-and-slicer architecture and the one design decision people misread, compares the approach with Excel and PMS reporting, and covers what it does not do. The template is available here.Hospitality
Hospitality & Resorts Dashboard in Google Sheets
Get the Hospitality & Resorts Dashboard in Google Sheets
Key Features of the Hospitality & Resorts Dashboard
- Pivot-and-slicer architecture. Every chart reads a native pivot table parked to the right of its page. No hidden helper formulas, which is what keeps the file quick as reservation history builds up.
- Named slicers on every analysis page. Month, Resort, Room Type and Status on Overview; Resort, Package, Month and Loyalty Tier on Properties; Package, Room Type, Booking Channel and Guest Type on Bookings; Loyalty Tier, Guest Type, Payment Method and Month on Guests.Hospitality
- Sixteen KPI cards. Four per page, matched to that page’s question – total revenue and average booking value, room nights and guests per stay, package revenue and largest booking, unique guests and no-show rate.Hospitality
- A full sidebar on every page. Three-stat snapshot, 12-month revenue sparkline, Top 5 ranking, share-of-revenue bars, a six-row At a Glance panel and a 12-month reservation volume sparkline.HospitalityHospitality & Resorts Dashboard in Google Sheets
- Property comparison. Eight resorts ranked on revenue, guests, package mix and share of portfolio revenue.Hospitality & Resorts Dashboard in Google Sheets
- Booking channel economics. All ten routes ranked by revenue – direct website, mobile app, loyalty app, travel agent, phone, corporate portal, group sales, front desk, email enquiry and walk-in.
- Package and room type performance. Revenue by Package and Room Type Revenue vs Reservations, so you see which products earn per booking rather than just filling rooms.
- Loyalty tier analysis. Revenue and reservation counts across Bronze, Silver, Gold, Platinum, Member and Corporate.
- Reservation status mix. Checked-out, Confirmed, In-house and No-show as shares.
- Reservation lookup. Enter an ID and read the complete record for that stay.
Dashboard Pages Explanation
Hospitality & Resorts Dashboard in Google Sheets
Page 1 – Overview
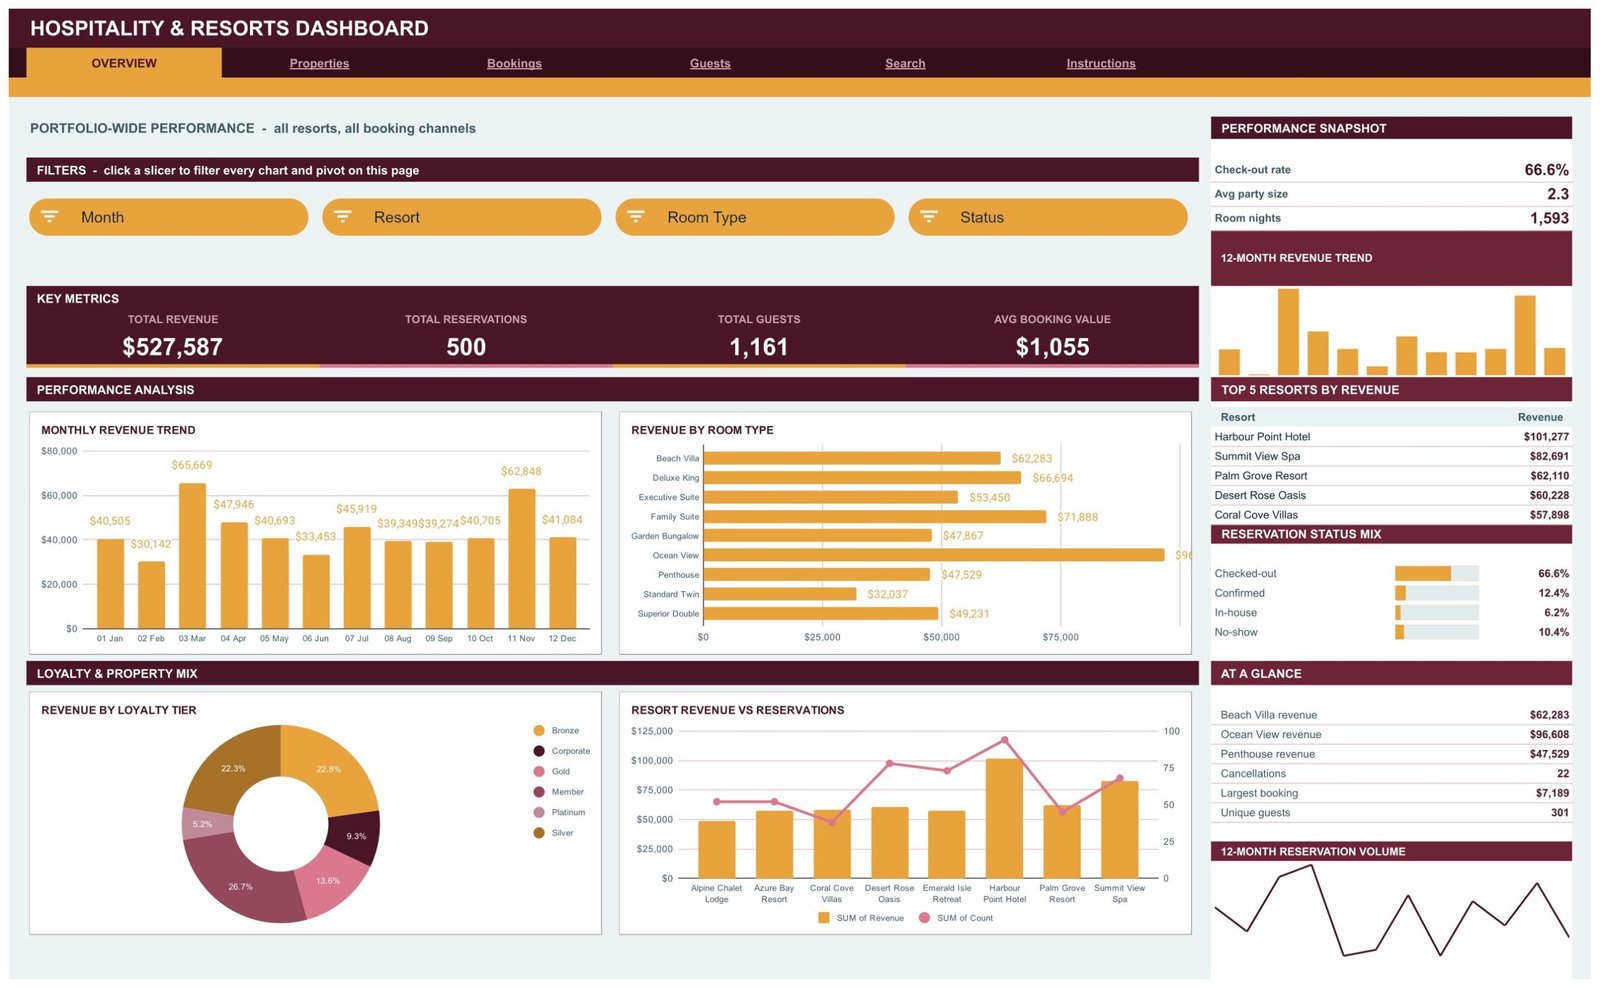
Portfolio-wide performance across all resorts and all booking channels. Total Revenue, Total Reservations, Total Guests and Avg Booking Value, with Monthly Revenue Trend, Revenue by Room Type, Revenue by Loyalty Tier and Resort Revenue vs Reservations. The sidebar adds check-out rate, average party size and room nights, plus the top five resorts by revenue and the reservation status mix.
Page 2 – Properties
Revenue, occupancy and package mix by resort. Completed Stays, Room Nights, the selected property’s revenue and Avg Guests per Stay, with Revenue vs Guests, Revenue by Resort & Package, Monthly Guest Volume and Reservations by Status. Average length of stay, revenue per night and no-show rate sit on the sidebar with each property’s share of portfolio revenue. This is the page that separates a genuinely weak property from a smaller one performing well per night.
Page 3 – Bookings
Hospitality & Resorts Dashboard in Google Sheets
Package, room type and channel performance. All Inclusive Revenue, Honeymoon Stays, Spa Retreat Revenue and Largest Booking, with Revenue by Package, Room Type Revenue vs Reservations, Revenue by Booking Channel and Guests by Guest Type. Revenue per guest, average party size and the top five channels sit on the sidebar. For most operators this is the page with the money in it – the gap between owned and intermediated channels is a commission negotiation in visual form.
Page 4 – Guests
Loyalty tiers, guest types and payment behaviour. Platinum Revenue, Family Stays, Unique Guests and No-Show Rate, with Reservations by Loyalty Tier, Guest Type Revenue vs Guests, Revenue by Payment Method and Monthly Reservation Volume.
Page 5 – Search
Hospitality & Resorts Dashboard in Google Sheets
Pick a Reservation ID and the page returns the full record: check-in date, resort, room type, package, guest name, loyalty tier, revenue, guests, nights, booking channel, payment method, status, guest type, month and quarter.
Page 6 – Instructions
A ten-point user guide covering how the pivots and slicers are wired, how to replace the sample data and how to raise the row limit. It also explains the design decision people most often misread: the KPI cards and the At a Glance list use SUMIFS and COUNTIFS against the Data sheet, so they always show unfiltered totals as a fixed reference, while the charts, pivots and Top 5 panels are slicer-aware.
Hospitality & Resorts Dashboard vs. an Excel Report vs. PMS Analytics – Feature Comparison
| This Google Sheets dashboard | A hand-built Excel report | PMS / channel manager analytics | |
|---|---|---|---|
| Cost | Under 10 once | Free, plus your build time | Bundled into 100 to 500 per property per month |
| Platform | Google Sheets, any browser | Excel on desktop | Vendor web app |
| Setup time | Under 30 minutes with your export | 2 to 3 days for six pages of pivots | Already there, with that vendor |
| Real-time collaboration | Yes, native sharing | Only via OneDrive co-authoring | Per paid seat |
| Mobile access | Yes, free Sheets app | Limited | Yes |
| Customizable metrics | Yes, every pivot and card | Yes, if you build them | No, fixed report set |
| Combines properties on different systems | Yes – reads a data sheet, not an API | Yes | No |
| Share with an owner or investor | Yes, view-only link | Send a file | Usually needs a seat |
| Data volume | 1,000 rows out of the box, extendable | Large | Unlimited |
| Year-1 cost, 3-property group | Under 10 | 0 plus several days | 3,600 and up |
Who Should Use This Template
Hospitality & Resorts Dashboard in Google Sheets
It fits resort and hotel groups with two or more properties; general managers whose PMS reporting stops at occupancy and ADR; owners and investors who want a monthly portfolio pack rather than a vendor login; revenue managers comparing channel and package performance; and boutique operators whose properties sit on different booking systems.
It is not a property management system – it reports on reservations rather than taking them. It cannot do live availability, rate parity or channel-manager pushes. And for a single small property with a handful of bookings a month, it is more machinery than the question needs.
Real-World Use Cases
Deciding which property to refurbish. One group’s flagship carried 19.2% of portfolio revenue against a chalet lodge at roughly 9%. Revenue per night and average length of stay showed the gap was volume rather than rate, which turned a repositioning discussion into a shoulder-season occupancy plan.
Pricing channel commission. The Bookings page ranked the direct website above travel agent and loyalty app by a clear margin. Knowing precisely what share owned channels carry is what turns a commission conversation with an intermediary into a numbers discussion.
Justifying a deposit policy. A 10.4% no-show rate against an average booking value above a thousand, across 500 reservations, is a large and specific annual figure – one KPI card rather than a week of reconciling exports.
Advantages of the Hospitality & Resorts Dashboard
Hospitality & Resorts Dashboard in Google Sheets
- Fast by design. Native pivots rather than thousands of array formulas is the difference between a dashboard that opens instantly and one that recalculates while you wait.
- Vendor-independent. It survives a change of PMS, and can hold properties running different systems side by side.
- Measures the PMS usually skips. Revenue per guest by channel, package revenue share across the group, loyalty tier contribution.
- Shareable without licences. A view-only link for an owner or accountant costs nothing per person.
- Fully editable. Every pivot, card and chart is an ordinary Google Sheets object.
Opportunities for Improvement
Stated plainly: there is no live PMS connection, so refreshing means exporting and pasting. Row capacity is 1,000 out of the box; beyond that you open the Apps Script file, raise DATA_ROWS and re-run main(). True RevPAR and occupancy are not calculated, because reservation data alone does not carry a room-inventory count per property – add an inventory column and both become short formulas. There is no year-on-year comparison page, so seasonality has to be read from the 12-month trend. And the KPI cards ignoring slicers is a deliberate choice some operators will want to change.
Best Practices
Hospitality & Resorts Dashboard in Google Sheets
- Read the Instructions page before the data goes in. Two minutes there prevents the most common misreading of the KPI cards.
- Keep the column headers exactly as they are when pasting your PMS export – the pivots, slicers and charts are bound to them.
- Sanity-check the Overview page after every import. If revenue, reservations and guests look right, the rest almost always is.
- Filter one variable at a time. With four slicers per page it is easy to end up with an empty chart and no idea which filter caused it.
- Clear slicers with Select all rather than leaving a page half-filtered for whoever opens it next.
- Refresh monthly and keep the history. The 12-month sparklines only earn their place if the file holds a full year.
Explore Relevant Templates
- Hospitality & Resorts Dashboard in Google Sheets – the template covered in this article.
- Hotel Revenue RevPAR Dashboard in Power BI – RevPAR and ADR with drillthrough.
- Hotel and Hospitality Revenue Dashboard in Excel – the same questions in Excel.
- Marina Management Dashboard in Google Sheets – the same architecture for marina operations.
- Hospitality & Restaurant Bundle – seven templates covering rooms and food service.
If you want to learn how pivot-table dashboards like this are put together, the Excel Pivot Tables & Dashboards course on NextGenTemplates Academy is a practical place to start, with practice files included.
Get the Hospitality & Resorts Dashboard in Google Sheets
Frequently Asked Questions
Hospitality & Resorts Dashboard in Google Sheets
Do I need a paid Google account?
No. A free personal Google account is enough. The download is a PDF with a Make a copy link that puts an editable copy in your own Drive.
Does it connect to my PMS?
No. You export reservations and paste them onto the Data sheet, which is what lets it work with any system – and lets you combine properties running different software.
How many reservations can it hold?
1,000 rows are pre-wired. Beyond that, open the Apps Script file, raise DATA_ROWS and re-run main().
Does it calculate RevPAR and occupancy?
Not directly. It gives revenue per night, average booking value, revenue per guest, room nights and average length of stay. RevPAR and occupancy need a room-inventory count per property, which reservation data does not carry; add an inventory column and both are a short formula away.
Why don’t the KPI cards change when I click a slicer?
By design – they use SUMIFS and COUNTIFS on the Data sheet and always show unfiltered totals as a reference point. The charts, pivots and Top 5 panels do respond.
Can I add my own resorts, room types or packages?
Yes. They are values in your data, not hard-coded lists. Google’s guide to slicers and pivot table filters covers the mechanics if you want to add more.
Can an owner view it without edit rights?
Hospitality & Resorts Dashboard in Google Sheets
Yes, through the normal Share button with view or comment access.
About the Author
Built by PK – Microsoft Certified Professional with 15+ years of Excel, Google Sheets, and Power BI experience. Founder of NextGenTemplates, reaching 300K+ subscribers across YouTube channels. Every template is hand-built and tested before release.Hospitality
Conclusion
Hotel reporting usually stops at revenue and occupancy per property. The decisions sit one level down – revenue per night, channel mix, package contribution, loyalty tier value, the cost of no-shows – and those need pivots rather than totals. Six pages of them, on a data sheet you own and can combine across systems, is a reasonable place to start. Export last year, paste it in, and open the Bookings page first.Hospitality
Get the template here: Hospitality & Resorts Dashboard in Google Sheets.