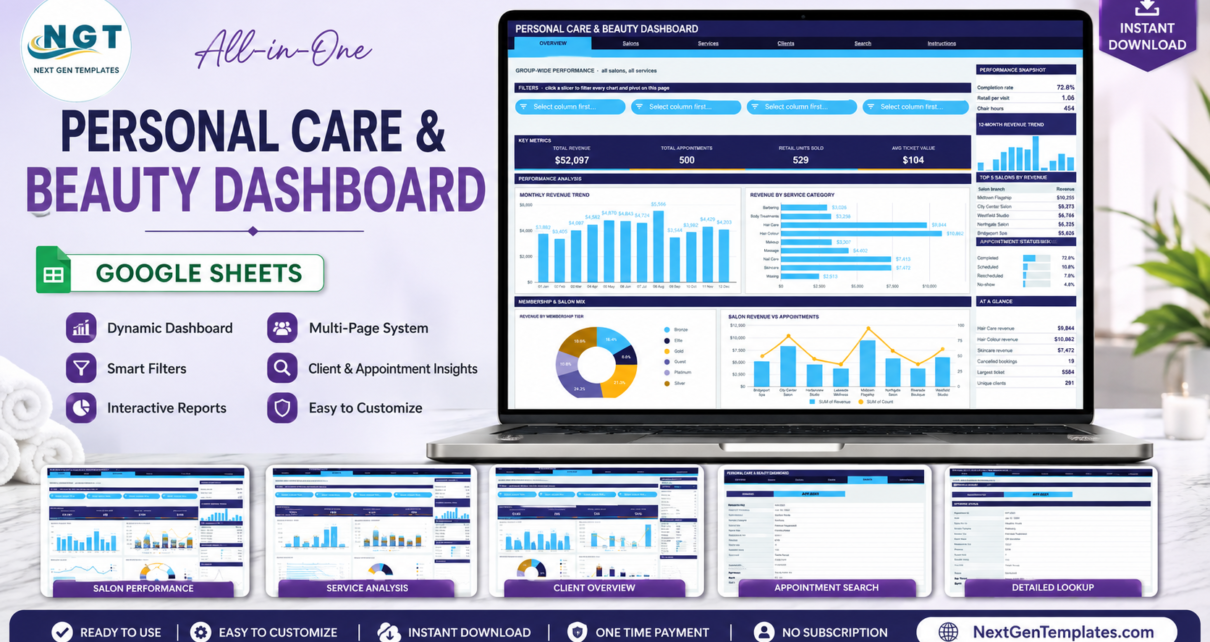
Salon owners are not short of data – the booking system produces plenty of it. What is usually missing is one screen that answers the questions that actually change decisions: which branch is quietly carrying the group, whether colour clients are worth more per chair hour than cuts, and how much revenue walks out of the door as no-shows. The Personal Care & Beauty Dashboard in Google Sheets is built to be that screen – 6 pages, 16 KPI cards, 16 charts, 4 slicers per page and an appointment lookup, all running on native Google Sheets pivot tables and slicers rather than a wall of formulas. The sample file ships with 500 appointments across 8 branches, 9 service categories and 10 specialists.Personal Care
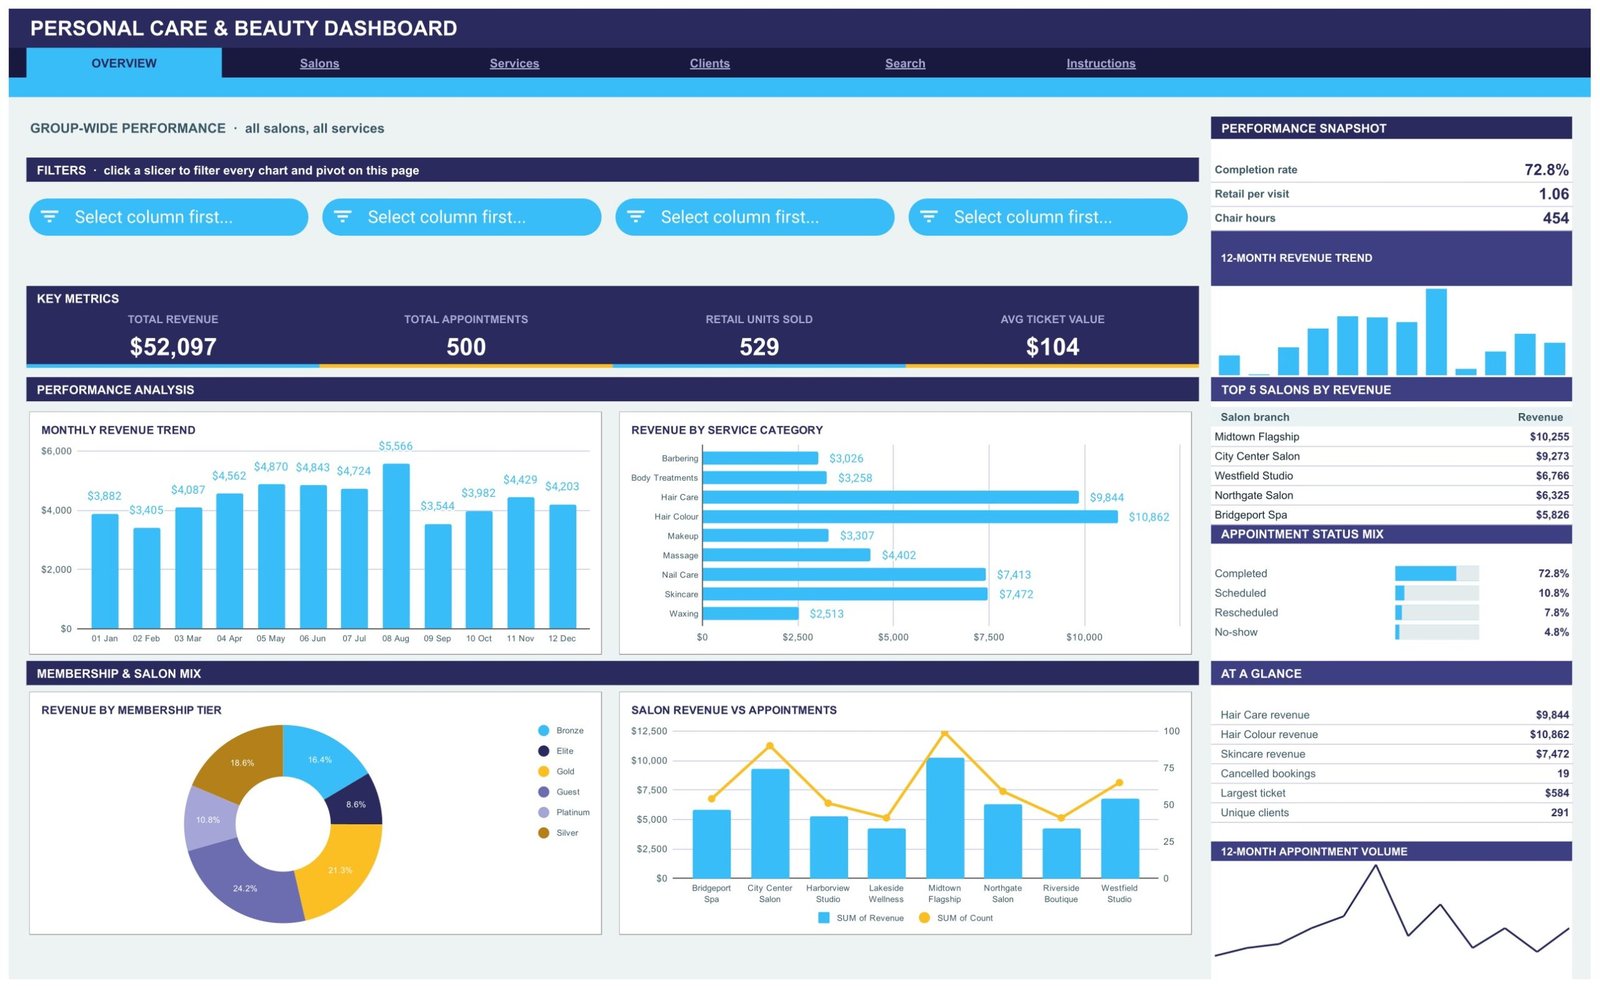
This article walks through each page, explains the pivot-and-slicer architecture and why the KPI cards deliberately ignore your slicers, compares the approach with Excel and with salon software reporting, and covers the habits that keep the numbers trustworthy. The template isPersonal Care available here.
Get the Personal Care & Beauty Dashboard in Google Sheets
Key Features of the Personal Care & Beauty Dashboard
- Pivot-and-slicer architecture. Every chart reads a native pivot table parked to the right of its page. No hidden helper formulas sit behind the visuals, which is what keeps the file quick as the appointment book grows.
- Four slicers on every analysis page. Click one and all four charts, the pivots and the sidebar Top 5 panel move together. Slicers are per page, so a filter on Salons leaves Services untouched.Personal Care
- Sixteen KPI cards. Four per page, matched to the question that page answers – total revenue and average ticket on Overview, service hours and retail per visit on Salons, premium treatment revenue and largest ticket on Services, unique clients and no-show rate on Clients.Personal Care
- A full sidebar on every page. A three-stat snapshot, a 12-month revenue sparkline, a Top 5 ranking, a share-of-revenue bar list, a six-row At a Glance panel and a 12-month appointment volume sparkline.
- Branch comparison. Eight locations ranked on revenue, retail units, service mix and share of group revenue.
- Specialist performance. Revenue by Specialist ranks all ten stylists and therapists, with a Top 5 panel that stays visible as you filter.Personal Care
- Membership and age analysis. Tier revenue, tier appointment counts and Age Group Revenue vs Retail Units – which is how you find out who actually buys product rather than just books a service.Personal Care
- Appointment status mix. Completed, Scheduled, Rescheduled and No-Show tracked as shares, so a drift in no-shows is a number rather than a hunch.Personal Care
- Payment behaviour. Cash, credit card, debit card, gift card, membership credit and mobile pay split by revenue.
- Appointment lookup. Enter an ID and read the full record for that booking – all fifteen fields.
Dashboard Pages Explanation
Page 1 – Overview
Group-wide performance across all salons and all services. Four KPI cards carry Total Revenue, Total Appointments, Retail Units Sold and Avg Ticket Value. Below them sit Monthly Revenue Trend, Revenue by Service Category, Revenue by Membership Tier and Salon Revenue vs Appointments. The sidebar adds completion rate, retail per visit and chair hours, plus the top five salons by revenue and the appointment status mix.
Page 2 – Salons
Personal Care & Beauty Dashboard in Google Sheets
Branch performance. Completed Visits, Service Hours, the leading branch’s revenue and Retail per Visit, with Revenue vs Retail Units, Revenue by Salon & Service Type, Monthly Retail Units and Appointments by Status. The sidebar carries average service minutes, revenue per hour and no-show rate, plus each branch’s share of group revenue. This is the page that separates a genuinely weak branch from a small one that is performing perfectly well per hour.
Page 3 – Services
Service, category and specialist performance. Premium Treatment Revenue, Bridal & Event Jobs, Hair Colour Revenue and Largest Ticket, with Revenue by Service Type, Category Revenue vs Appointments, Revenue by Specialist and Retail Units by Age Group. Category Revenue vs Appointments is the one to study: a category with high revenue and low appointment count earns per hour in a way a busy low-ticket category does not.
Page 4 – Clients
Membership tiers, age groups and payment behaviour. Platinum Revenue, Gold Appointments, Unique Clients and No-Show Rate, with Appointments by Membership Tier, Age Group Revenue vs Retail Units, Revenue by Payment Method and Monthly Appointment Volume.
Page 5 – Search
Pick any Appointment ID and the page returns the complete record: date, branch, service category and type, client name, membership tier, revenue, retail units, duration, specialist, payment method, status, age group, month and quarter. It exists so that a query about one visit does not mean scrolling a thousand-row data sheet.
Page 6 – Instructions
A ten-point user guide covering how the pivots and slicers are wired, how to replace the sample data, and how to raise the row limit. It also explains the design decision people most often misread: the KPI cards and the At a Glance list use SUMIFS and COUNTIFS against the Data sheet, so they always show unfiltered totals as a fixed reference point, while the charts, pivots and Top 5 panels respond to slicers. If you want everything to filter together, that is a deliberate choice you can change – but the constant is usually more useful than it first looks.
Personal Care & Beauty Dashboard vs. an Excel Report vs. Salon Software Analytics – Feature Comparison
| This Google Sheets dashboard | A hand-built Excel report | Salon software reporting | |
|---|---|---|---|
| Cost | Under 10 once | Free, plus your build time | Bundled into 50 to 200 per month |
| Platform | Google Sheets, any browser | Excel on desktop | Vendor web app |
| Setup time | Under 30 minutes with your export | 2 to 3 days for six pages of pivots | Already there, with that vendor |
| Real-time collaboration | Yes, native sharing | Only via OneDrive co-authoring | Per paid seat |
| Mobile access | Yes, free Sheets app | Limited | Yes |
| Customizable metrics | Yes, every pivot and card | Yes, if you build them | No, fixed report set |
| Works across booking systems | Yes – reads a data sheet, not an API | Yes | No, that vendor only |
| Share with an accountant | Yes, view-only link | Send a file | Usually needs a seat |
| Data volume | 1,000 rows out of the box, extendable | Large | Unlimited |
| Year-1 cost, 3-branch group | Under 10 | 0 plus several days | 600 to 2,400 |
Who Should Use This Template
It fits salon and spa owners running two or more locations; single-site owners whose booking reports stop at revenue totals; barbershop and beauty groups tracking specialist performance and retail attach; franchise managers comparing branches on identical measures; and bookkeepers producing a monthly pack for a salon client.
It is not a booking system – it reads appointments rather than taking them, and the Salon and Spa Management System Web App is the tool for that. It also does not connect live to your software; you export and paste, which takes a couple of minutes a week. And for a single chair doing twenty appointments a month, this is more machinery than the question needs.
Real-World Use Cases
Deciding where to invest across eight branches. One group saw its flagship at 19.7% of revenue and a smaller site at roughly 8%, which looked like an easy decision – until revenue per hour showed the smaller site close to the group average on productivity, with far fewer chair hours. The question changed from whether to close it to whether to extend its opening hours.
Chasing retail attach rate. Retail per visit sat at 1.06 units group-wide. Retail Units by Age Group showed young adults and the 30-44 bracket buying close to two-thirds of all product, which redirected the retail display and the staff briefing toward the appointment types those clients book.
Pricing a deposit policy. A 4.8% no-show rate against an average ticket of 104, across 500 appointments, is a specific annual number rather than a vague irritation – and it is one KPI card rather than an afternoon with a booking export.
Advantages of the Personal Care & Beauty Dashboard
Personal Care & Beauty Dashboard in Google Sheets
- Fast because of the architecture. Native pivots rather than thousands of array formulas is the difference between a dashboard that opens instantly and one that recalculates for ten seconds.
- Vendor-independent. Because it reads a data sheet, it survives a change of booking software – and can hold history from two different systems side by side.
- Metrics your software probably does not calculate. Revenue per chair hour, retail attach by branch, revenue by age bracket.
- Shareable without licences. A view-only link for an accountant or a partner, at no extra cost per person.
- Editable end to end. Every pivot, card and chart is a normal Google Sheets object you can change.
Opportunities for Improvement
Being straight about the limits: there is no live connection to booking software, so refreshing means exporting and pasting. The row capacity is 1,000 out of the box – beyond that you must open the Apps Script file, raise DATA_ROWS and re-run main(), which is easy but is a step. The KPI cards not responding to slicers is a deliberate design choice that some people will want to change. There is no year-on-year comparison page, so seasonality has to be read from the 12-month trend. And staff cost is not modelled, so revenue per hour is a gross figure rather than a margin.
Best Practices
Personal Care & Beauty Dashboard in Google Sheets
- Read the Instructions page before the data goes in. Two minutes there prevents the most common misreading, which is expecting the KPI cards to follow your slicers.
- Keep the column headers exactly as they are when you paste your export. The pivots, slicers and charts are bound to those headers.
- Sanity-check the Overview page after every import. If total revenue and appointment count look right, the rest almost always is.
- Filter one variable at a time. Four slicers on a page make it easy to end up with an empty chart and no idea which filter caused it.
- Clear slicers with Select all rather than leaving a page half-filtered for the next person who opens it.
- Reload monthly, not daily. Salon patterns move slowly; a monthly refresh gives you the trend without the noise.
Explore Relevant Templates
- Personal Care & Beauty Dashboard in Google Sheets – the template covered in this article.
- Salon and Spa Dashboard in Google Sheets – a lighter single-site view.
- Salon and Spa Dashboard in Power BI – the same analysis with drillthrough and tooltips.
- Salon Appointment Data Entry System in Excel – captures the bookings this dashboard reports on.
- Beauty Products Distributor Management Tracker in Google Sheets – the product supply side.
To learn how pivot-table dashboards like this are built, the Excel Pivot Tables & Dashboards course on NextGenTemplates Academy covers the method with practice files.
Get the Personal Care & Beauty Dashboard in Google Sheets
Frequently Asked Questions
Personal Care & Beauty Dashboard in Google Sheets
Do I need a paid Google account?
No. A free personal Google account is enough. The download is a PDF with a Make a copy link that puts an editable copy in your own Drive with all pivots and slicers working.
Does it connect to my booking software?
No. You export appointments and paste them onto the Data sheet, which is what makes it work with any booking system – and keeps it working after you switch.
How many appointments can it hold?
1,000 rows are pre-wired. To go further, open the Apps Script file, raise DATA_ROWS and re-run main().
Why don’t the KPI cards change when I click a slicer?
By design. The cards use SUMIFS and COUNTIFS on the Data sheet so they always show unfiltered totals as a reference point. The charts, pivots and Top 5 panels are slicer-aware.Personal Care
Can I add my own branches, services or specialists?
Yes – they are values in your data, not hard-coded lists. Paste in your rows and the pivots and slicers pick up whatever names you use. Google’s guide to slicers and pivot table filters explains the underlying mechanics if you want to add more.Personal Care
Can I change the colours to match my brand?
Yes. The palette lives in one block at the top of the Apps Script file – a dark ink, a bright accent and an amber for second chart series.Personal Care
Can my accountant see it without edit rights?
Yes, through the normal Share button with view or comment access.
About the Author
Personal Care & Beauty Dashboard in Google Sheets
Built by PK – Microsoft Certified Professional with 15+ years of Excel, Google Sheets, and Power BI experience. Founder of NextGenTemplates, reaching 300K+ subscribers across YouTube channels. Every template is hand-built and tested before release.Personal Care
Conclusion
Most salon reporting stops at revenue by branch. The useful questions are one level down – revenue per chair hour, retail attach by age group, no-show cost, which specialist carries which category – and those need pivots rather than totals. Six pages of them, on a data sheet you control, is a reasonable place to start. Export last quarter, paste it in, and look at the Salons page first.Personal Care
Get the template here: Personal Care & Beauty Dashboard in Google Sheets.