Income Expense Dashboard Isn’t it great when managing your money becomes less of a chore and more like a breeze? That’s exactly what Google Sheets can do for you. Imagine a tool that not only helps you track every dollar of income and expense but also updates itself in real time and is a cinch to use. Well, it’s not just a daydream—it’s totally doable! Let’s walk through setting up an Income Expense Dashboard that’s both intuitive and powerful.
What’s on Your Dashboard?
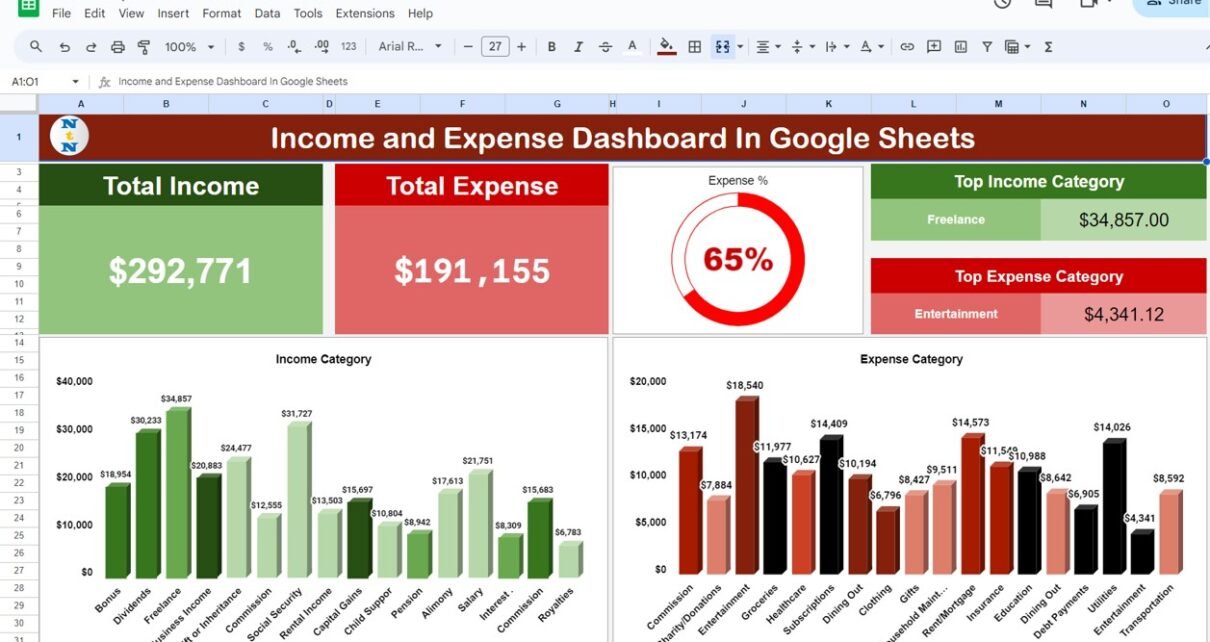
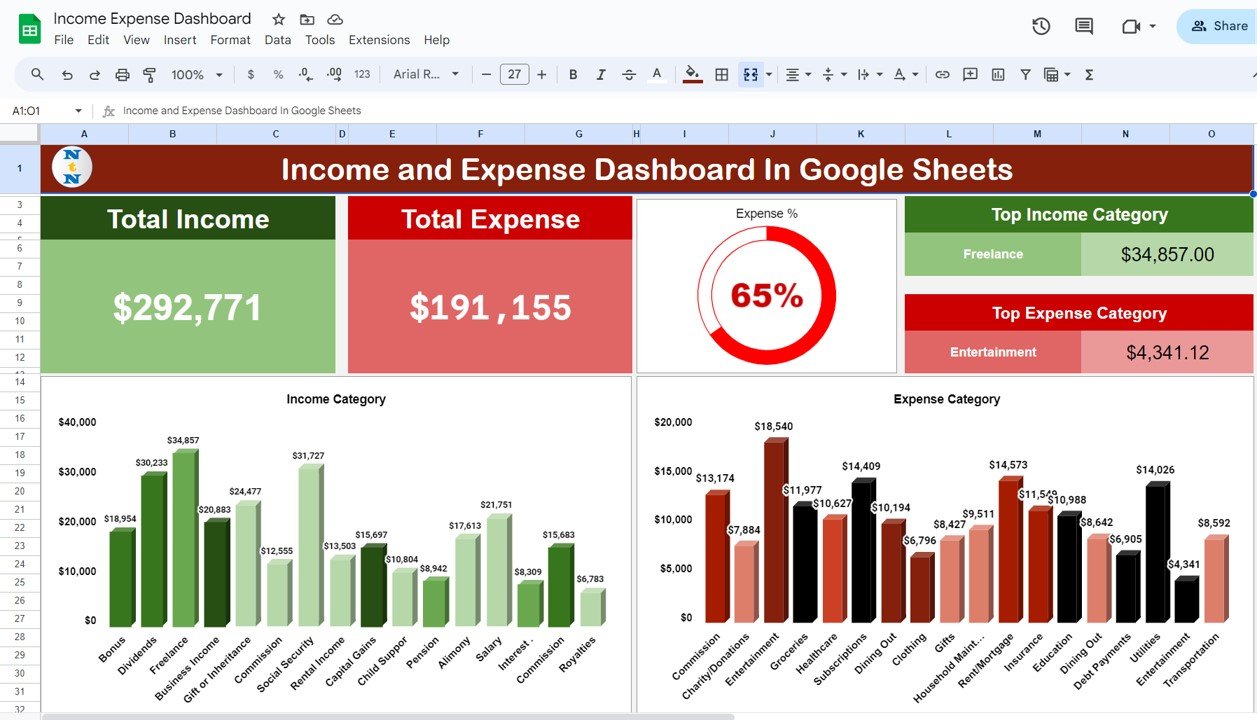
Your dashboard isn’t just a bunch of numbers and charts; it’s a comprehensive overview of your financial health. Here’s what you can expect to find on it:
The Dashboard Sheet Tab
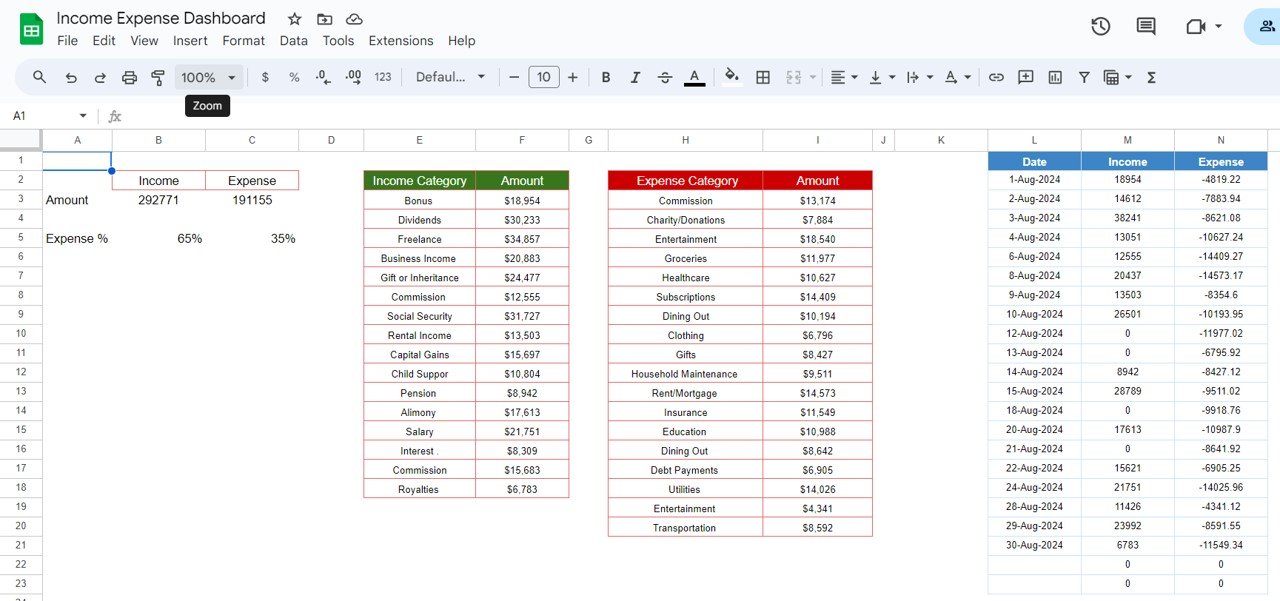
- Total Income: See your total earnings over any period at a glance.
- Total Expense: All your outgoings summed up here help keep your spending in check.
- Expense Percentage Doughnut Chart: This visual treat shows what portion of your income you’re spending, making it easier to spot trends.
- Top Income and Expense Categories Cards: Identify where you make the most money and where you spend it.
- Income and Expense Category Column Charts: Get a detailed breakdown of your financial categories.
- Date-wise Income and Expense Chart: This chart maps out your financial activity over time, showing you the ups and downs at a glance.
Click to buy Income and Expense Dashboard in Google Sheets
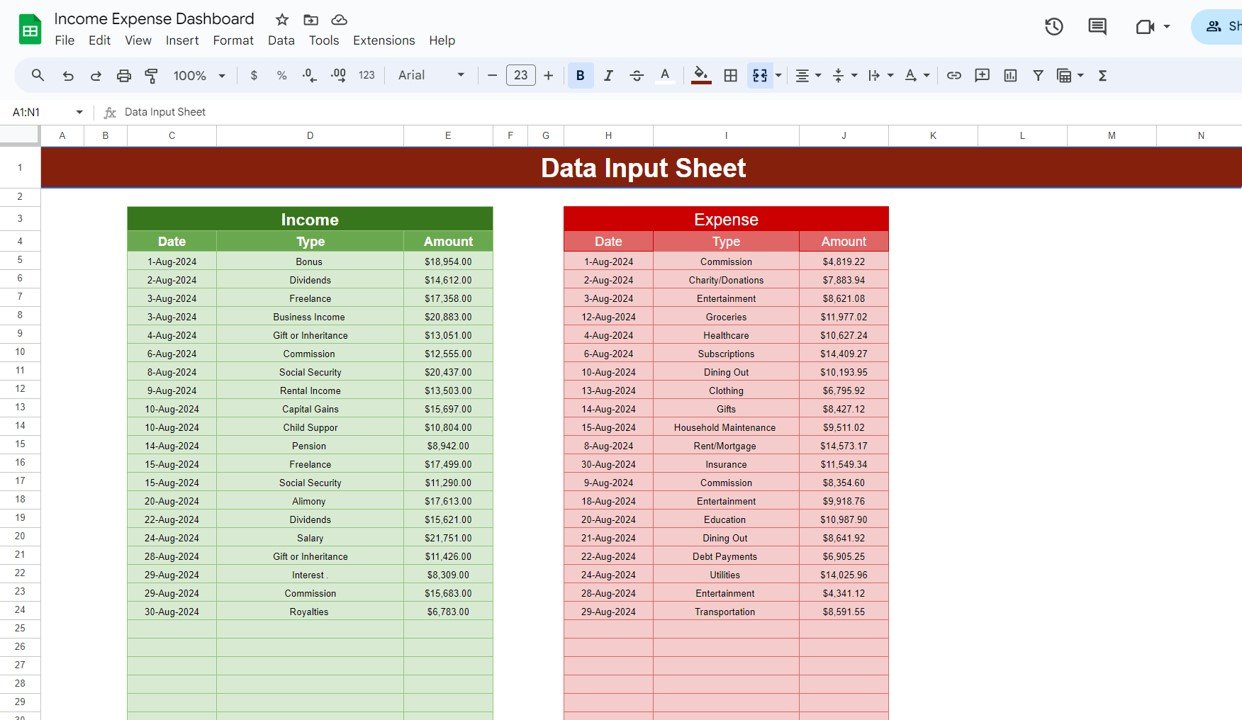
Data Sheet Tab
- Data Entry: This is where you log all transaction details. It’s the backbone of your dashboard, keeping everything else accurately informed.
Click to buy Income and Expense Dashboard in Google Sheets
Behind the Scenes: Support Sheet Tab
- Calculations and References: This section takes care of the complex stuff like calculations and stores important data such as exchange rates and tax rates.
Click to buy Income and Expense Dashboard in Google Sheets
Advantages of Using an Income Expense Dashboard
Implementing an Income Expense Dashboard in Google Sheets provides several benefits:
- Real-time Updates: As data is entered, the dashboard updates automatically, offering up-to-the-minute insights.
- Customization: Users can tailor the dashboard to their specific needs, adding or modifying categories and metrics.
- Accessibility: Since it’s hosted on Google Sheets, the dashboard can be accessed from any device, anywhere, as long as there’s internet connectivity.
- Cost-Effective: Unlike specialized financial software, Google Sheets is free and widely accessible, reducing overhead costs.
Best Practices for Managing Your Dashboard
To maximize the effectiveness of your Income Expense Dashboard, consider these best practices:
- Regular Updates: Keep your dashboard accurate by regularly updating the data sheets.
- Data Verification: Periodically check the data for errors to ensure reliability.
- Backup: Regularly save backups of your dashboard to prevent data loss.
Conclusion
An Income Expense Dashboard in Google Sheets is an invaluable tool for anyone looking to manage their finances efficiently. With its customizable features and real-time data processing, it provides clear insights into financial health, aiding in better decision-making.
Click to buy Income and Expense Dashboard in Google Sheets
Frequently Asked Questions
Q. How do I get started with the Income Expense Dashboard?
Just copy the template to your Google Drive and start entering your financial details in the pre-defined sheets.
Q. Can I share this dashboard with others?
Absolutely! Google Sheets allows you to control access, so you can decide whether others can view or edit.
Q. Can the dashboard track financial changes over the years?
Yes, by expanding your data sheets to include past years, you can use charts to visualize long-term financial trends.
Q. How safe is my financial information in Google Sheets?
Google Sheets is secure, but for added peace of mind, activate two-factor authentication and only share your sheets with people you trust.
Q. Ready to get a handle on your finances?
Your Google Sheets dashboard is here to help!
Click to buy Income and Expense Dashboard in Google Sheets
Visit our YouTube channel to learn step-by-step video tutorials
Youtube.com/@NeotechNavigators
Watch the step-by-step video tutorial:
Click to buy Income and Expense Dashboard in Google Sheets