When everything feels urgent, nothing gets done in the right order. A Task Priority Tracker in Google Sheets helps you sort work into Urgent, High, Medium and Low, see who owns each task, and spot overdue items before they pile up.
This guide walks through a ready-made tracker with a dashboard, a Kanban-style Task Priority View, a detailed task list and a support sheet that calculates completion percentages. It is aimed at team leads, project coordinators, small business owners and anyone juggling tasks for several people. You will see what each sheet shows, how the numbers are calculated, and how to set it up with your own tasks.
🎥 Watch the Video Tutorial
What Is Inside the Task Priority Tracker in Google Sheets
| Sheet | What it shows | Sample values in the screenshots |
|---|---|---|
| Dashboard | Total Task card, Task Count by Priority, Task Count by Status, Overdue Status and Task by Assigned To | 21 tasks; 17 overdue |
| Task Priority View | Kanban-style columns for Urgent, High, Medium and Low, each with a Completed vs Pending doughnut | High: 8 tasks, 1 completed, 7 pending |
| Task list | One row per task with dates, priority, status and an Is Overdue flag | 21 sample tasks |
| Support sheet | Totals, Completed, Pending and Completion% for each priority | Urgent completion 42.86% |
The Dashboard
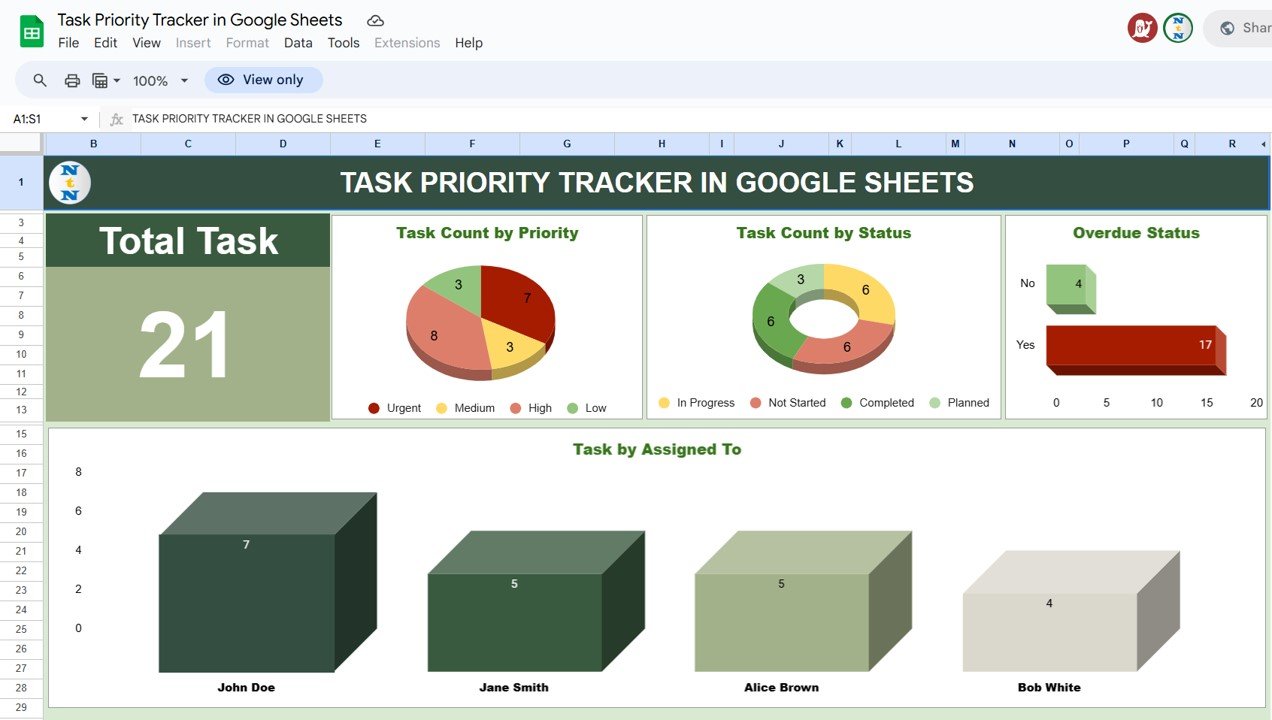
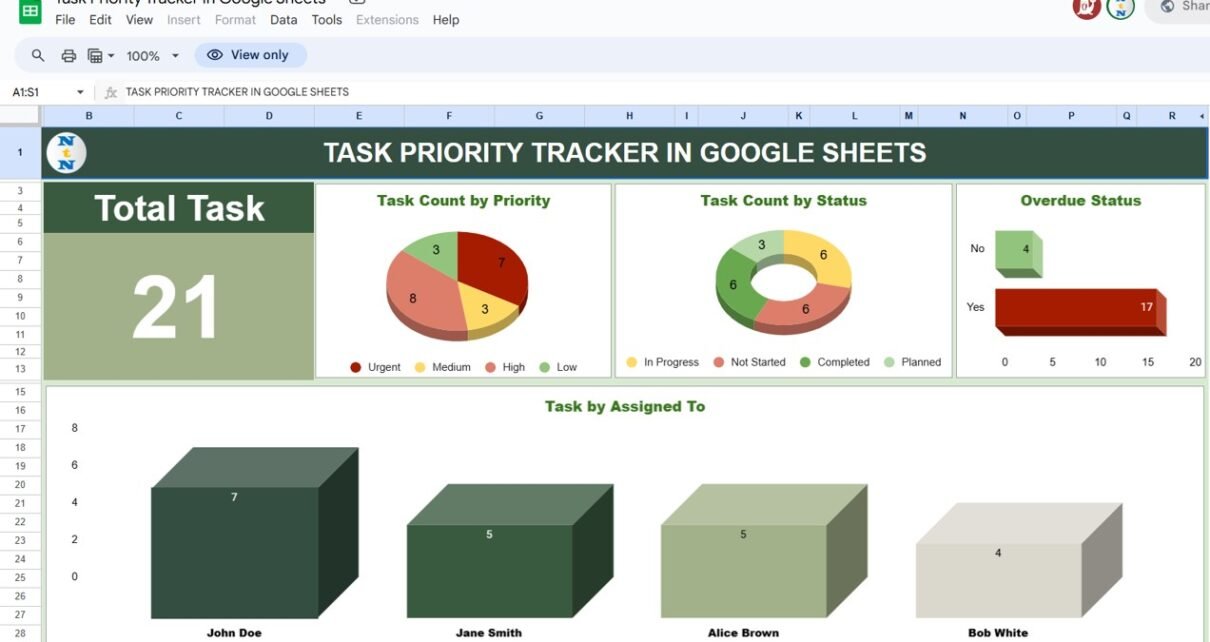
- Total Task: the number of tasks in the list (21 in the sample).
- Task Count by Priority (3D pie): Urgent 7, High 8, Medium 3 and Low 3.
- Task Count by Status (3D doughnut): In Progress 6, Not Started 6, Completed 6 and Planned 3.
- Overdue Status (bar): Yes 17 and No 4, a clear sign the sample team is behind on deadlines.
- Task by Assigned To (3D column): John Doe 7, Jane Smith 5, Alice Brown 5 and Bob White 4, so you can see whose plate is fullest.
The Task Priority View (Kanban Board)
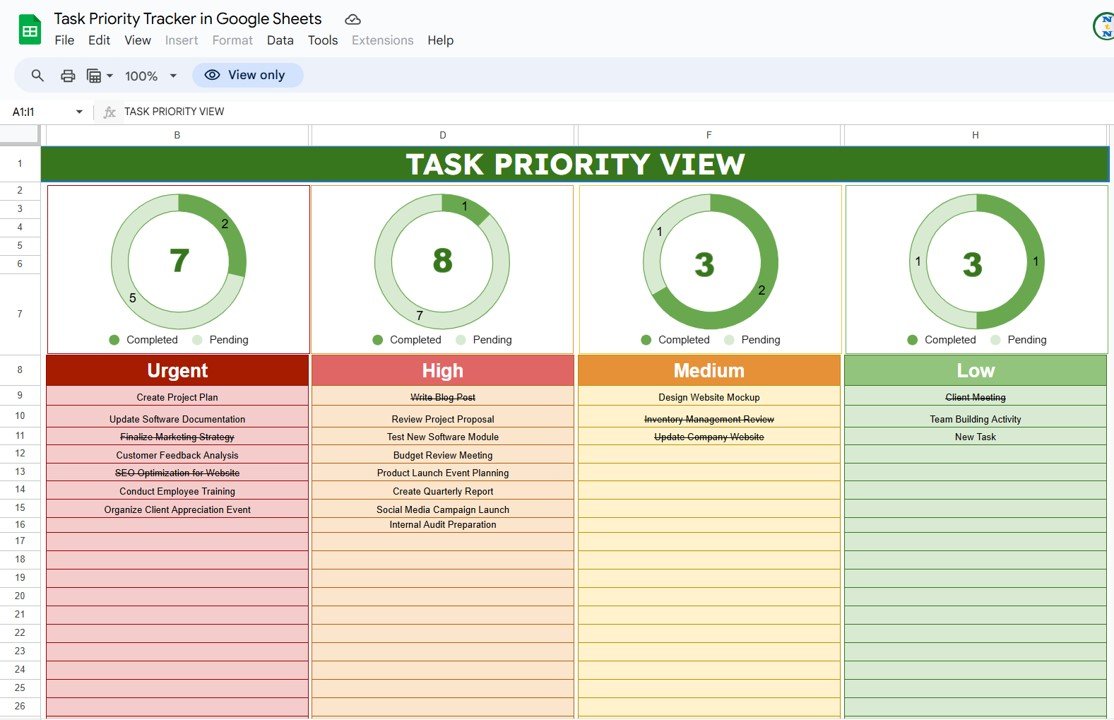
This sheet lays tasks out in four colour-coded columns: Urgent, High, Medium and Low. Above each column, a doughnut shows the total for that priority split into Completed and Pending. Completed tasks stay in the list but appear with a strikethrough, for example “Write Blog Post” in the High column, so you can see what is done without losing the history.
It is the sheet to open in a daily stand-up: read the Urgent column top to bottom, then High.
The Task List, Column by Column
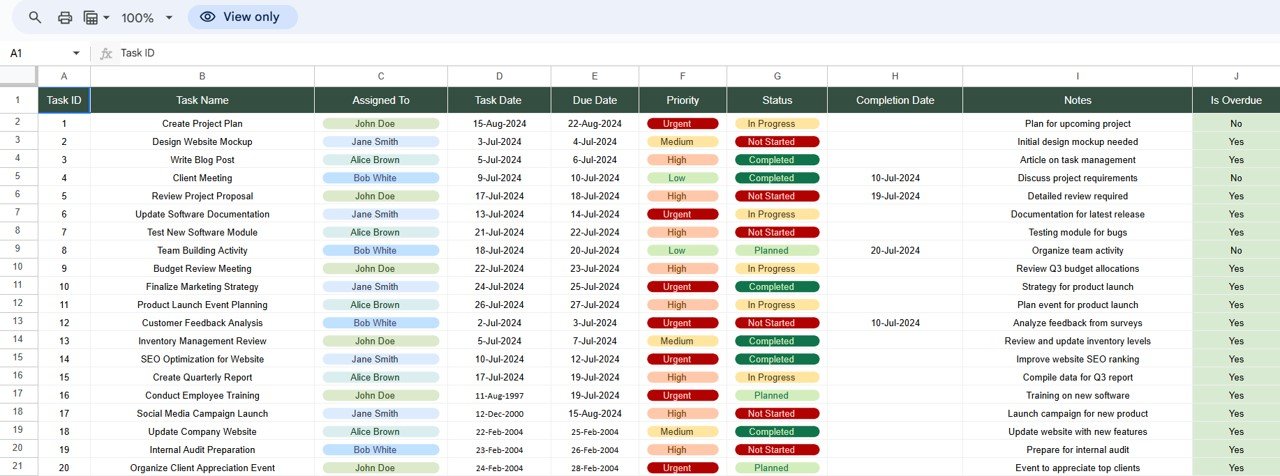
| Column | What it holds | Sample value |
|---|---|---|
| Task ID | Running number for each task | 1 |
| Task Name | What needs doing | Create Project Plan |
| Assigned To | Owner, chosen from a drop-down | John Doe |
| Task Date | When the task was created or started | 15-Aug-2024 |
| Due Date | Deadline | 22-Aug-2024 |
| Priority | Urgent, High, Medium or Low | Urgent |
| Status | Not Started, Planned, In Progress or Completed | In Progress |
| Completion Date | When it was finished | (blank while open) |
| Notes | Extra detail | Plan for upcoming project |
| Is Overdue | Calculated Yes or No | No |
How Is Overdue is decided
In the sample data, a task shows Yes when it is still open after its due date, or when it was completed after its due date. It shows No when it was completed on or before the due date, or when the due date has not arrived yet. For example:
| Task | Due Date | Completion Date | Is Overdue |
|---|---|---|---|
| Client Meeting | 10-Jul-2024 | 10-Jul-2024 | No (finished on time) |
| Review Project Proposal | 18-Jul-2024 | 19-Jul-2024 | Yes (one day late) |
| Team Building Activity | 20-Jul-2024 | 20-Jul-2024 | No |
| Create Project Plan | 22-Aug-2024 | (open) | No (deadline not reached when the screenshot was taken) |
If you build your own version, this formula gives the same result (Due Date in column E, Completion Date in column H):
=IF(E2<IF(H2="",TODAY(),H2),"Yes","No")The Support Sheet and Completion %

For each priority, the support sheet lists the total, the number Completed, the number Pending and a Completion%. Completion% is simply Completed divided by the total. In the screenshot of this sheet:
| Priority | Total | Completed | Pending | Completion% |
|---|---|---|---|---|
| Urgent | 7 | 3 | 4 | 42.86% (3 ÷ 7) |
| High | 8 | 1 | 7 | 12.50% (1 ÷ 8) |
| Medium | 3 | 2 | 1 | 66.67% (2 ÷ 3) |
| Low | 2 | 1 | 1 | 50.00% (1 ÷ 2) |
The screenshots were captured at slightly different moments while the sample data was being edited, so a few counts differ between sheets. In your own copy, every sheet reads from the same task list and stays in sync.
Formulas to Check the Numbers Yourself
These are handy if you want to verify a chart or add your own summary cell. They assume the task list sits in rows 2 to 1000 with Priority in column F and Status in column G.
=COUNTIF(F2:F1000,"Urgent")Counts Urgent tasks.
=COUNTIFS(F2:F1000,"Urgent",G2:G1000,"Completed")/COUNTIF(F2:F1000,"Urgent")Gives the Urgent completion rate. Format it with Format > Number > Percent.
=COUNTIFS(F2:F1000,"Urgent",J2:J1000,"Yes")Counts Urgent tasks that are overdue, which is usually the first number a manager wants to see.
How to Use It With Your Own Tasks
- Replace the sample names in the Assigned To list with your team members.
- Clear the sample rows in the task list, keeping the Is Overdue formula.
- Add each task with a name, owner, task date, due date and priority.
- Agree as a team what each priority means, for example Urgent = due within 48 hours or blocking others.
- Update Status as work moves and enter the Completion Date when a task is done.
- Open the Task Priority View each morning and the dashboard once a week to check overdue counts and workload by person.
Real-World Use Cases
- Marketing or content team: blog posts, campaigns and launches ranked by urgency, with the Kanban view used in stand-ups.
- IT or operations team: software updates, audits and documentation tasks where the Overdue Status chart shows how much is slipping.
- Small business owner: split work across a few staff and use Task by Assigned To to balance the load.
Best Practices and Limitations
- Keep Urgent small: if more than a third of tasks are Urgent, the label stops meaning anything. Review priorities weekly.
- Always fill the Completion Date: without it, a finished task can still be judged against today’s date.
- Use Planned on purpose: keep it for tasks that are scheduled but not yet started, so Not Started really means “should have started”.
- Limitations: the tracker does not send reminders, track hours or show dependencies between tasks. Teams that need those features will be better served by a dedicated project tool or a Gantt chart.
Related Guides
For a tracker that also measures how long tasks have been pending, see the Task Management Tracker in Google Sheets. For a simple personal list, try the To Do List in Google Sheets. Teams logging blockers can use the Project Management Issue Tracker, and the Pro Gantt Chart project plan in Google Sheets adds a timeline view.
If you want to build dashboards like this one yourself, the Excel Pivot Tables and Dashboards course on NextGenTemplates Academy covers counting, summarising and charting task data step by step.
Frequently Asked Questions
What priority levels does the tracker use?
Four: Urgent, High, Medium and Low. Each has its own colour and its own column in the Task Priority View.
What statuses can a task have?
Not Started, Planned, In Progress and Completed.
How is Completion% calculated?
Completed tasks divided by total tasks for that priority. For example, 3 completed out of 7 Urgent tasks gives 42.86%.
Why does a completed task still show as overdue?
Because it was finished after its due date. The tracker keeps late completions visible so you can see how often deadlines slip.
Can my whole team update it at once?
Yes. It is a Google Sheets file, so you can share it with edit access and everyone sees changes in real time.
Wrapping Up
The Task Priority Tracker in Google Sheets gives you three views of the same task list: a dashboard for the big picture, a Kanban board for daily priorities, and a support sheet that turns progress into a completion percentage for each priority. Add your team, enter this week’s tasks, and start each day with the Urgent column.
Related template: Task Management Tracker in Google Sheets.
📅 Last updated: October 2026