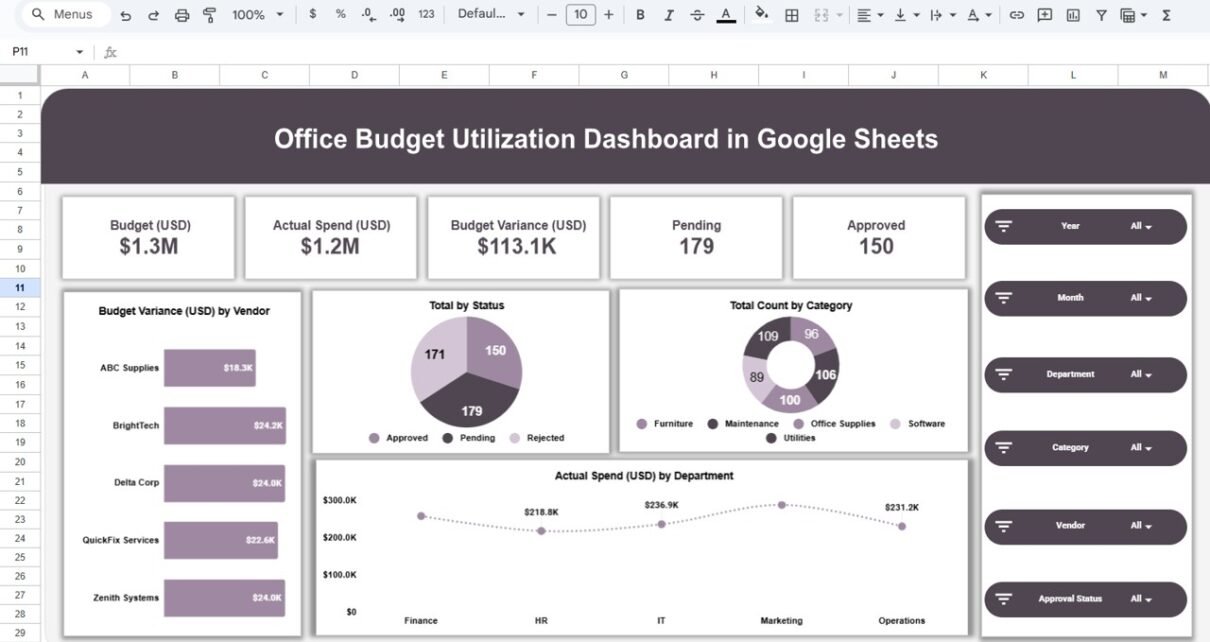
Managing office budgets across departments, categories, and vendors is never simple. When budget data is spread across multiple spreadsheets, tracking actual spend, variances, approvals, and trends becomes time-consuming and error-prone. That is exactly why the Office Budget Utilization Dashboard in Google Sheets is a powerful, ready-to-use solution for finance teams, operations managers, and business leaders.Office Budget Utilization Dashboard in Google Sheets
This dashboard converts raw budget and expense data into clear KPIs, interactive charts, and actionable insights—directly inside Google Sheets, without complex tools or coding.Office Budget Utilization Dashboard in Google Sheets
What Is an Office Budget Utilization Dashboard in Google Sheets?
Click to Buy Office Budget Utilization Dashboard in Google Sheets
An Office Budget Utilization Dashboard in Google Sheets is a centralized reporting and analysis tool that helps organizations monitor:
-
Budget vs actual spend
-
Budget variances
-
Approval and pending status
-
Department, category, and vendor-wise spending
-
Monthly budget utilization trends
Because it is built in Google Sheets, the dashboard is cloud-based, shareable, and easy to update—making it ideal for teams that need real-time visibility into office expenses.
Key Features of the Office Budget Utilization Dashboard
Ready-to-Use Dashboard Design
The dashboard comes fully designed and pre-structured. You only need to paste your data, and all visuals update automatically.
Interactive Filters & Slicers
Analyze data instantly using slicers for:
- Year
- Month
- Department
- Category
- Vendor
- Approval Status
This allows decision-makers to drill down into specific expense areas within seconds.
KPI Cards for Quick Insights
At the top of the dashboard, key metrics are displayed as cards, including:
- Total Budget (USD)
- Actual Spend (USD)
- Budget Variance (USD)
- Pending Requests
- Approved Requests
These KPIs give an instant snapshot of overall budget health.
Dashboard Sheet Structure Explained
Click to Buy Office Budget Utilization Dashboard in Google Sheets
1️⃣ Overview Sheet
The Overview sheet provides a high-level summary of office budget utilization.
Key Insights Available:
-
Total budget vs actual spend
-
Overall budget variance
-
Total pending and approved records
-
Budget variance by vendor
-
Spend distribution by status and category
-
Actual spend by department
This page is ideal for management reviews and executive reporting.

Click to Buy Office Budget Utilization Dashboard in Google Sheets
2️⃣ Department Analysis
The Department Analysis sheet focuses on how each department utilizes its budget.
Analysis Includes:
-
Budget variance by department
-
Actual spend by department
-
Budget allocation by department
-
Department-wise spending trends
This helps identify departments that are over-spending or under-utilizing allocated budgets.

Click to Buy Office Budget Utilization Dashboard in Google Sheets
3️⃣ Category Analysis
The Category Analysis sheet highlights spending patterns across expense categories.
Common Categories Covered:
-
Furniture
-
Maintenance
-
Office Supplies
-
Software
-
Utilities
Insights You Get:
-
Budget variance by category
-
Actual spend vs budget by category
-
High-cost categories requiring cost control
This is extremely useful for procurement and finance planning.

Click to Buy Office Budget Utilization Dashboard in Google Sheets
4️⃣ Vendor Analysis
The Vendor Analysis sheet enables vendor-wise budget tracking.
Key Metrics:
-
Budget vs actual spend by vendor
-
Budget variance by vendor
-
Identification of high-cost vendors
This analysis supports vendor negotiations and contract optimization.

Click to Buy Office Budget Utilization Dashboard in Google Sheets
5️⃣ Monthly Trends
The Monthly Trends sheet shows how budgets and spending evolve over time.
Trend Analysis Includes:
-
Budget amount by month
-
Actual spend by month
-
Budget variance by month
With this view, organizations can spot seasonal spikes, recurring overspend patterns, and forecast future budgets more accurately.

Click to Buy Office Budget Utilization Dashboard in Google Sheets
6️⃣ Search by Keyword & Field Name
The Search Sheet allows users to quickly find records using:
-
Column selection (e.g., Department, Vendor, Category)
-
Search keyword
It is especially useful when working with large datasets containing hundreds or thousands of records.

Click to Buy Office Budget Utilization Dashboard in Google Sheets
Advantages of Using an Office Budget Utilization Dashboard
-
Clear Financial Visibility – Understand exactly where money is spent
-
Time Saving – No manual reporting or repeated calculations
-
Cost Control – Identify overspending early
-
Better Decision-Making – Data-driven budget planning
-
Cloud-Based – Accessible anytime in Google Sheets
Opportunities for Improvement
-
🔹 Add forecast or projected spend metrics
-
🔹 Integrate automated data imports from accounting systems
-
🔹 Include alerts for budget threshold breaches
-
🔹 Expand approval workflow tracking
Best Practices for Using This Dashboard
Click to Buy Office Budget Utilization Dashboard in Google Sheets
-
Update data regularly (daily or weekly)
-
Maintain consistent department and category naming
-
Review budget variance monthly
-
Share dashboard access with key stakeholders
-
Archive historical data annually for performance comparison
Who Can Benefit from This Dashboard?
Click to Buy Office Budget Utilization Dashboard in Google Sheets
-
Finance & Accounting Teams
-
Operations Managers
-
Procurement Teams
-
Admin & Facility Management
-
Business Owners & CFOs
Any organization that tracks office expenses and budgets can benefit from this dashboard.
Final Thoughts
The Office Budget Utilization Dashboard in Google Sheets is a practical, professional, and scalable solution for tracking office budgets effectively. It transforms raw expense data into meaningful insights, helping organizations control costs, improve financial transparency, and make smarter budgeting decisions.
Visit our YouTube channel to learn step-by-step video tutorials
Youtube.com/@NeotechNavigators
Watch the step-by-step video tutorial:
Click to Buy Office Budget Utilization Dashboard in Google Sheets