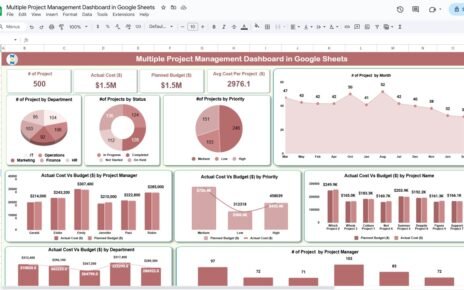
Office relocation involves multiple departments, locations, vendors, budgets, and timelines. Teams must manage tasks such as packing, IT setup, furniture movement, lease coordination, and employee communication. However, without a centralized tracking system, tasks often get delayed, budgets overrun, and accountability breaks down.
An Office Relocation Dashboard in Google Sheets solves these challenges by giving a single, visual control center for the entire relocation project. It tracks task status, urgency, budget, cost variance, department-wise progress, location-wise execution, and individual responsibility—all in real time. Moreover, because this dashboard runs in Google Sheets, it remains easy to use, share, and update without complex software.
In this article, we explain how the dashboard works, each card and chart, department and location analysis, task analysis, search feature, advantages, improvement opportunities, best practices, and FAQs.
What Is an Office Relocation Dashboard in Google Sheets?
Click to Buy Office Relocation Dashboard in Google Sheets
An Office Relocation Dashboard is a project monitoring solution that tracks every relocation task from planning to completion. It consolidates task progress, cost tracking, urgency levels, and accountability into one dashboard.
This dashboard helps managers answer key questions such as:
- How many relocation tasks are complete?
- Are we within the planned budget?
- Which departments face delays?
- Which locations exceed cost estimates?
- Who owns delayed tasks?
Because it uses Google Sheets, teams update data instantly, and leadership sees accurate progress without waiting for reports.
Key Features of the Office Relocation Dashboard
This ready-to-use dashboard includes:
- Executive summary KPI cards
Task-level visual analysis
Department-wise insights
Location-wise breakdown
Assigned-to performance analysis
Task-specific budget and delay tracking
Smart search functionality
Each section plays a critical role in controlling relocation execution.
Dashboard Sheet Tab – Executive Overview
Click to Buy Office Relocation Dashboard in Google Sheets
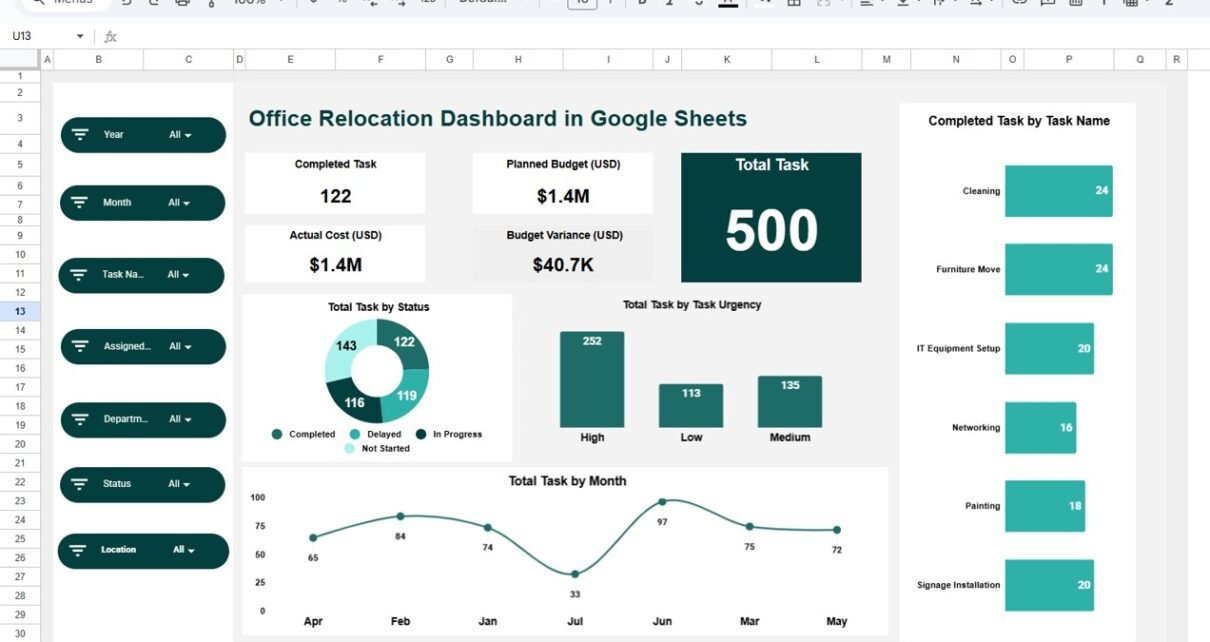
The Dashboard Sheet Tab presents the high-level status of the office relocation project.
Dashboard Cards (KPIs)
These cards show instant project health.
Completed Task
Shows the total number of tasks completed successfully.
Total Task
Displays the total relocation tasks planned.
Planned Budget (USD)
Shows the approved relocation budget.
Actual Cost (USD)
Reflects the actual spend incurred till date.✅ Budget Variance (USD)
Dashboard Charts – Overall Task Analysis
Total Task by Status
This chart displays tasks grouped by:
- Completed
- In Progress
- Delayed
- Not Started
Helps identify execution gaps
Highlights overall project risk
Total Task by Task Urgency
This chart shows tasks by urgency:
- Low
- Medium
- High
Supports priority-based decision making
Helps allocate resources effectively
Total Task by Month
This chart tracks task distribution month-wise.
Helps monitor project timeline
Identifies peak relocation periods
Completed Task by Task Name
This chart shows which tasks reach completion.
Highlights progress task-by-task
Helps verify milestone achievement

Click to Buy Office Relocation Dashboard in Google Sheets
Department Analysis Section
This section helps management understand departmental performance.
Completed vs Delayed Task by Department
Identifies departments facing delays
Improves accountability
Total Task by Department
Highlights workload distribution
Supports resource planning
Medium vs Low vs High Task by Department
Shows urgency concentration
Helps prioritize departmental support
Planned Budget vs Actual Cost by Department
Tracks cost overruns
Supports department-wise budget control

Click to Buy Office Relocation Dashboard in Google Sheets
Location Analysis Section
This section tracks relocation progress across different office locations.
Total Task by Location
Shows workload by location
Helps coordinate relocation activities
Completed vs Delayed Task by Location
Identifies problem locations
Helps deploy corrective action swiftly
Medium vs Low vs High Task by Location
Highlights urgency by location
Improves logistics planning
Planned Budget vs Actual Cost by Location
Detects budget overruns
Supports financial control per location

Click to Buy Office Relocation Dashboard in Google Sheets
Assigned Analysis Section
This section monitors individual ownership and responsibility.
Completed vs Delayed Task by Assigned To
Tracks accountability
Highlights performance gaps
Medium vs Low vs High Task by Assigned To
Shows urgency load per person
Helps balance workload
Planned Budget vs Actual Cost by Assigned To
Evaluates cost responsibility
Improves task ownership

Click to Buy Office Relocation Dashboard in Google Sheets
Task Analysis Section
This section drills down into individual relocation tasks.
Completed vs Delayed Task by Task Name
Identifies problematic tasks
Supports focused troubleshooting
Total Task by Task Name
Shows task volume
Helps standardize task templates
Medium vs Low vs High Task by Task Name
Highlights risk-heavy tasks
Improves planning for future relocations
Planned Budget vs Actual Cost by Task Name
Detects cost-intensive tasks
Enables better vendor negotiations

Click to Buy Office Relocation Dashboard in Google Sheets
Search Functionality – Search by Keyword and Field Name
The dashboard includes a smart search panel.
You just enter:
-
Search Keyword (Task name, department, location, assigned person)
-
Field Name (Task Name, Department, Location, Assigned To)
The dashboard instantly filters matching records.
Saves time
Avoids manual scrolling
Improves audit readiness
Helps during review meetings

Click to Buy Office Relocation Dashboard in Google Sheets
Why Organizations Need an Office Relocation Dashboard
Office relocation projects fail when visibility remains low and data stays scattered. This dashboard ensures:
- Transparency across teams
- Clear accountability
- Budget control
- Timeline adherence
- Better vendor coordination
- Data-driven decisions
Advantages of the Office Relocation Dashboard
Centralized relocation tracking
Improved budget visibility
Faster decision making
Reduced task delays
Department and location clarity
Easy collaboration in Google Sheets
Opportunities for Improvement
Click to Buy Office Relocation Dashboard in Google Sheets
Organizations can enhance the dashboard by adding:
SLA tracking for task completion
Vendor-wise performance analysis
Automated alerts for delayed tasks
Document upload links
Risk scoring per task
Best Practices for Using the Dashboard
- Update task status regularly
Review department and location charts weekly
Monitor budget variance closely Assign clear task owners
Use search during audits and reviews
Lock formulas to avoid errors
Conclusion
Click to Buy Office Relocation Dashboard in Google Sheets
An Office Relocation Dashboard in Google Sheets transforms a complex relocation program into a manageable, transparent, and data-driven process. It tracks tasks, urgency, cost, accountability, and progress across departments and locations—all in a single, visual dashboard. Because it is cloud-based, flexible, and easy to maintain, it becomes a powerful tool for successful office relocations.
Frequently Asked Questions (FAQs)
1. Who should use this dashboard?
Admin teams, project managers, operations leaders, and finance teams.
2. Can this dashboard handle multiple locations?
Yes, it supports unlimited locations.
3. Can we track relocation budget and cost?
Yes, planned vs actual cost tracking is built-in.
4. Is the dashboard customizable?
Yes, all charts and fields can be edited.
5. Is Google Sheets secure for relocation data?
Yes, with correct access permissions.
6. Can automation be added later?
Yes, Google Apps Script supports automation and alerts.
Visit our YouTube channel to learn step-by-step video tutorials
Youtube.com/@NeotechNavigators
Watch the step-by-step video tutorial: