Managing a pharmacy efficiently requires monitoring multiple metrics, including sales, inventory, prescriptions, and operational KPIs. The Pharmacy KPI Dashboard in Google Sheets is a ready-to-use tool that allows pharmacy managers, pharmacists, and administrators to track key performance indicators (KPIs), compare actual performance against targets, and make data-driven decisions.
In this article, we will explain the features, benefits, best practices, and frequently asked questions related to this dashboard.
What Is a Pharmacy KPI Dashboard?
A Pharmacy KPI Dashboard is a visual analytics tool built in Google Sheets that consolidates pharmacy performance data in a single place. It provides insights into sales, inventory turnover, prescription processing, revenue, and operational efficiency.
With this dashboard, pharmacy managers can:
-
Monitor MTD (Month-to-Date) and YTD (Year-to-Date) performance
-
Compare actual numbers with targets and previous year results
-
Identify trends and areas requiring corrective action
-
Make informed decisions to optimize operations and improve profitability
Key Features of the Pharmacy KPI Dashboard
This dashboard is structured into six worksheets, each serving a specific purpose:
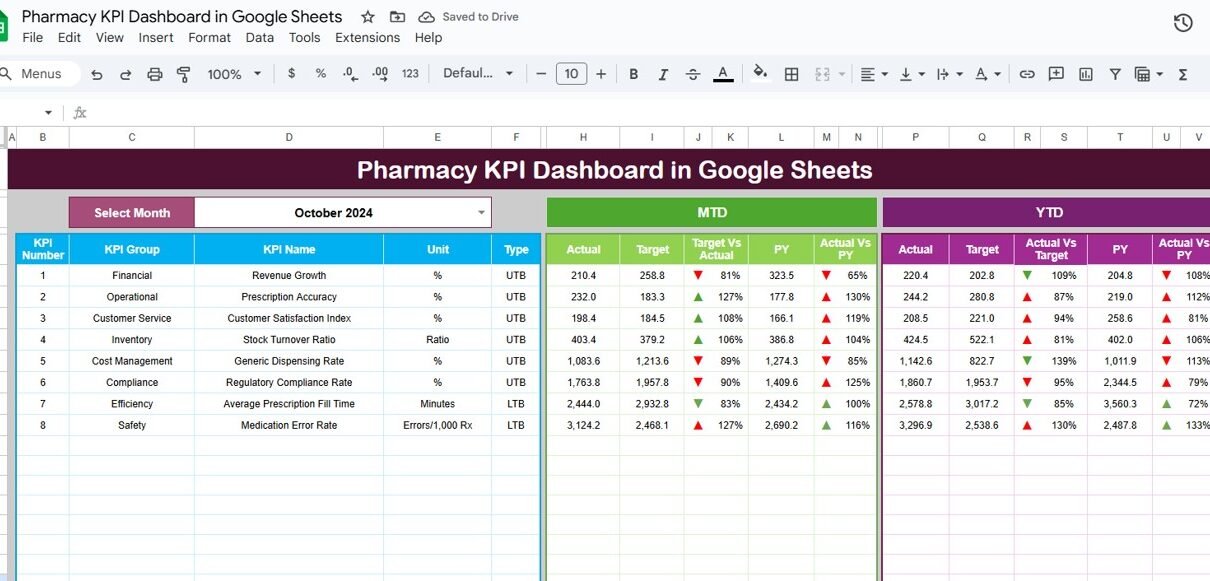
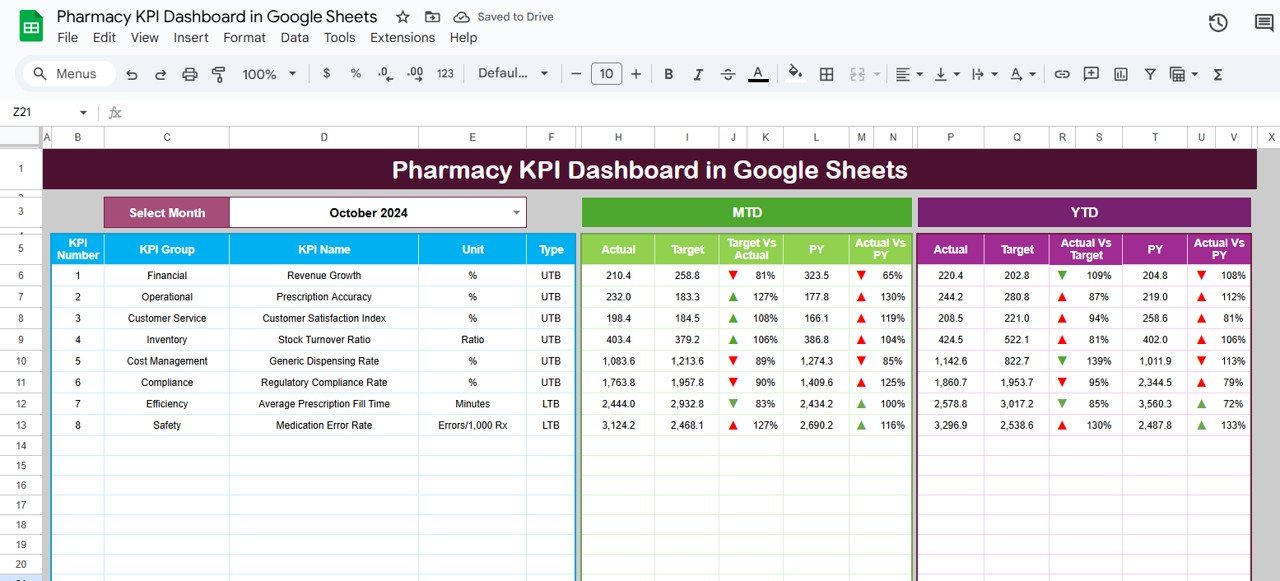
1. Dashboard Sheet Tab
The Dashboard Sheet is the main interface providing a complete overview of all KPIs.
Key features include:
-
Month Selection Dropdown (Range D3): Dynamically updates dashboard data for the selected month
-
MTD Metrics: Displays actual, target, and previous year data with conditional formatting (up/down arrows)
-
YTD Metrics: Tracks cumulative performance with target and previous year comparisons
-
Visual Analysis: Quickly spot underperforming KPIs using visual indicators
Click to Buy Pharmacy KPI Dashboard in Google Sheets
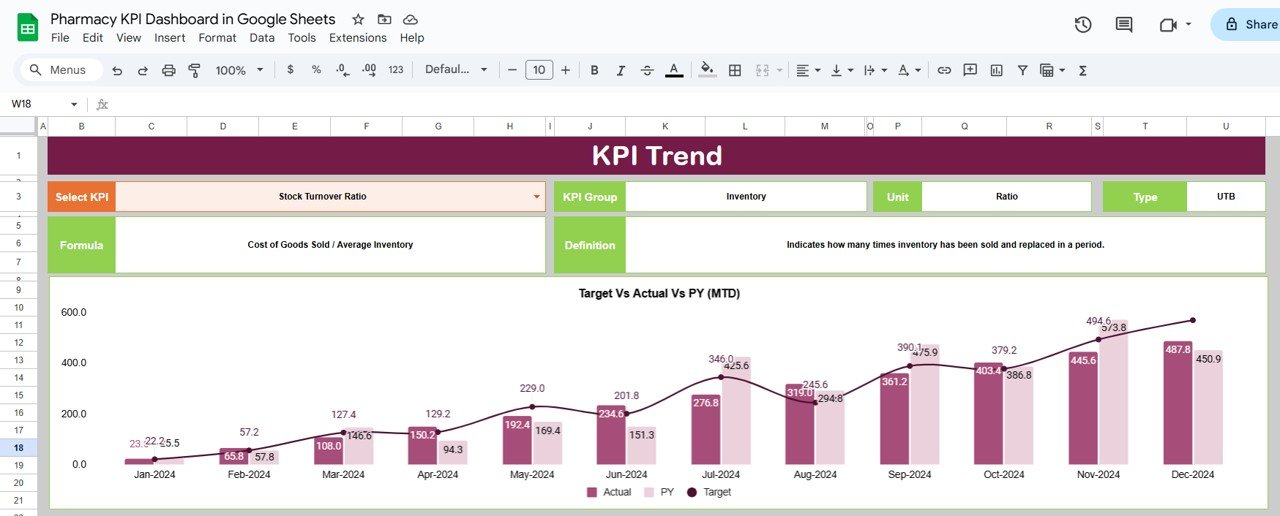
2. KPI Trend Sheet Tab
The KPI Trend Sheet provides detailed analytics for individual KPIs.
-
Select KPI from the dropdown in Range C3
-
Displays KPI Group, Unit, and Type (Upper-the-Better or Lower-the-Better)
-
Shows formula and KPI definition
-
Visualizes trends over time to monitor improvements or issues
This sheet helps managers identify underperforming areas and monitor KPI progress.
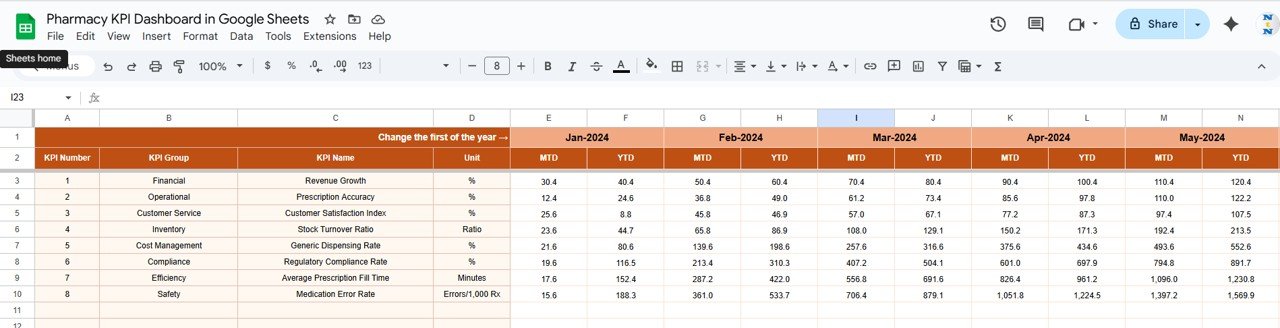
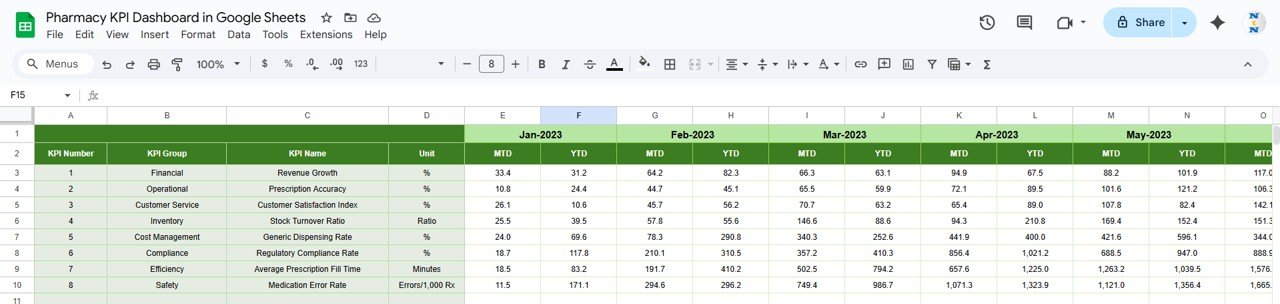
3. Actual Number Sheet Tab
-
Enter actual numbers for MTD and YTD for each KPI
-
Change the first month of the year in Range E1 to update calculations
-
Ensures that the dashboard reflects real-time performance accurately
Click to Buy Pharmacy KPI Dashboard in Google Sheets
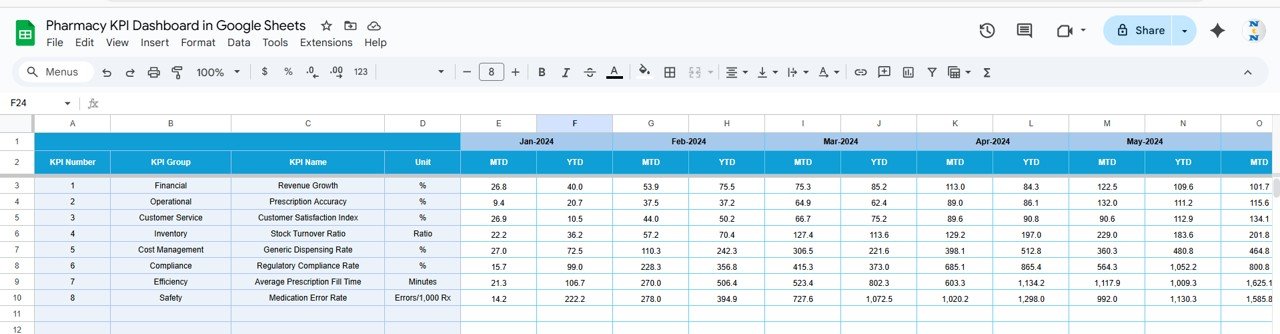
4. Target Sheet Tab
-
Enter target values for each KPI for the selected month
-
Track both MTD and YTD targets to measure performance against goals
-
Helps managers align pharmacy operations with organizational objectives
5. Previous Year Numbers Sheet Tab
-
Enter previous year’s KPI values for comparison
-
Enables year-over-year analysis to understand performance trends and seasonal variations
Click to Buy Pharmacy KPI Dashboard in Google Sheets
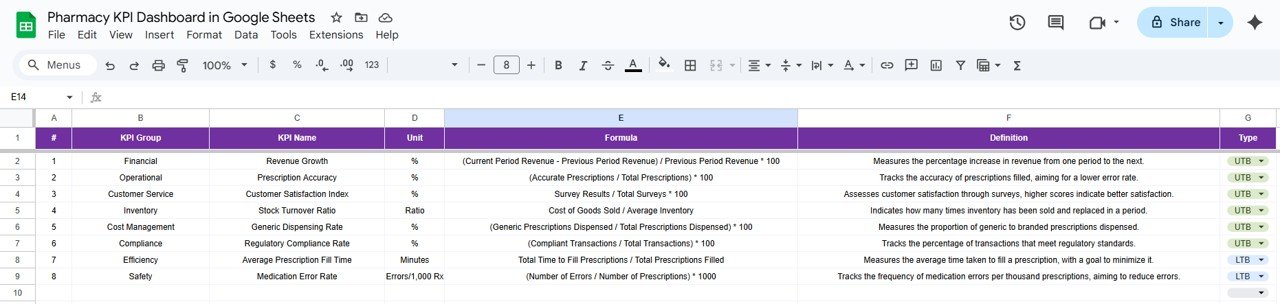
6. KPI Definition Sheet Tab
-
Document all KPI details including Name, Group, Unit, Formula, and Definition
-
Specify whether the KPI is Lower-the-Better (LTB) or Upper-the-Better (UTB)
-
Provides clarity and consistency for all performance metrics
Examples of KPIs to Track in a Pharmacy Dashboard
Some critical KPIs for pharmacy management include:
-
Total Prescription Volume: Number of prescriptions filled
-
Revenue ($): Total sales generated
-
Inventory Turnover Rate: Frequency of stock replenishment
-
Stockouts (%): Percentage of items out of stock (LTB)
-
Average Dispensing Time (mins): Time taken to fulfill prescriptions (LTB)
-
Customer Satisfaction Score: Feedback from patients or clients
-
Expired Stock (%): Percentage of expired inventory (LTB)
Each KPI should include:
-
Unit of Measure (e.g., $, %, count)
-
Formula (e.g., Total Revenue ÷ Total Prescriptions)
-
Performance Type (UTB / LTB)
Advantages of Using the Pharmacy KPI Dashboard
Click to Buy Pharmacy KPI Dashboard in Google Sheets
-
Centralized Data: Consolidate all pharmacy KPIs in one Google Sheet
-
Real-Time Insights: Update actual numbers and instantly see trends and performance
-
Identify Underperforming Areas: Quickly spot KPIs that need attention
-
Optimize Operations: Improve inventory management, prescription processing, and revenue
-
Track MTD and YTD Performance: Monitor monthly and annual trends for informed decisions
-
Customizable: Add or remove KPIs based on pharmacy-specific needs
Best Practices for Using the Pharmacy KPI Dashboard
-
Update Data Promptly: Enter actual numbers for MTD and YTD as soon as available
-
Segment by KPI Group: Track performance for sales, inventory, customer service, and operations separately
-
Monitor Trends: Compare current performance with previous years to identify patterns
-
Use Conditional Formatting: Highlight KPIs that are underperforming using up/down arrows
-
Align Targets with Goals: Ensure that MTD and YTD targets reflect organizational objectives
-
Review Regularly: Use dashboards to support monthly or quarterly management reviews
How This Dashboard Helps Pharmacy Managers
Click to Buy Pharmacy KPI Dashboard in Google Sheets
-
Improve Inventory Management: Track stockouts, expired stock, and turnover rates
-
Enhance Customer Service: Monitor dispensing time and satisfaction scores
-
Increase Revenue: Identify trends and optimize operations for higher profitability
-
Support Compliance: Maintain records of prescriptions and operational KPIs
-
Enable Data-Driven Decisions: Make informed choices using real-time analytics
Frequently Asked Questions (FAQs)
Click to Buy Pharmacy KPI Dashboard in Google Sheets
Q1: Can I add new KPIs to the dashboard?
Yes, the dashboard is fully customizable. You can add new KPIs in the KPI Definition sheet and link them to MTD/YTD calculations.
Q2: How often should the data be updated?
For accurate reporting, update data monthly or as new operational results are available.
Q3: Can the dashboard track multiple pharmacy branches?
Yes, you can add location or branch columns to segment KPIs across different pharmacies.
Q4: Does this dashboard support trend analysis?
Yes, the KPI Trend sheet visualizes changes in performance over time for each KPI.
Q5: Is Google Sheets suitable for large-scale pharmacy operations?
Absolutely. Google Sheets supports collaborative editing and can handle large datasets efficiently.
Conclusion
The Pharmacy KPI Dashboard in Google Sheets provides a powerful, easy-to-use solution for monitoring pharmacy operations. By tracking MTD and YTD performance, comparing against targets, and visualizing trends, managers can optimize workflows, improve service, and enhance profitability.
Visit our YouTube channel to learn step-by-step video tutorials
Youtube.com/@NeotechNavigators