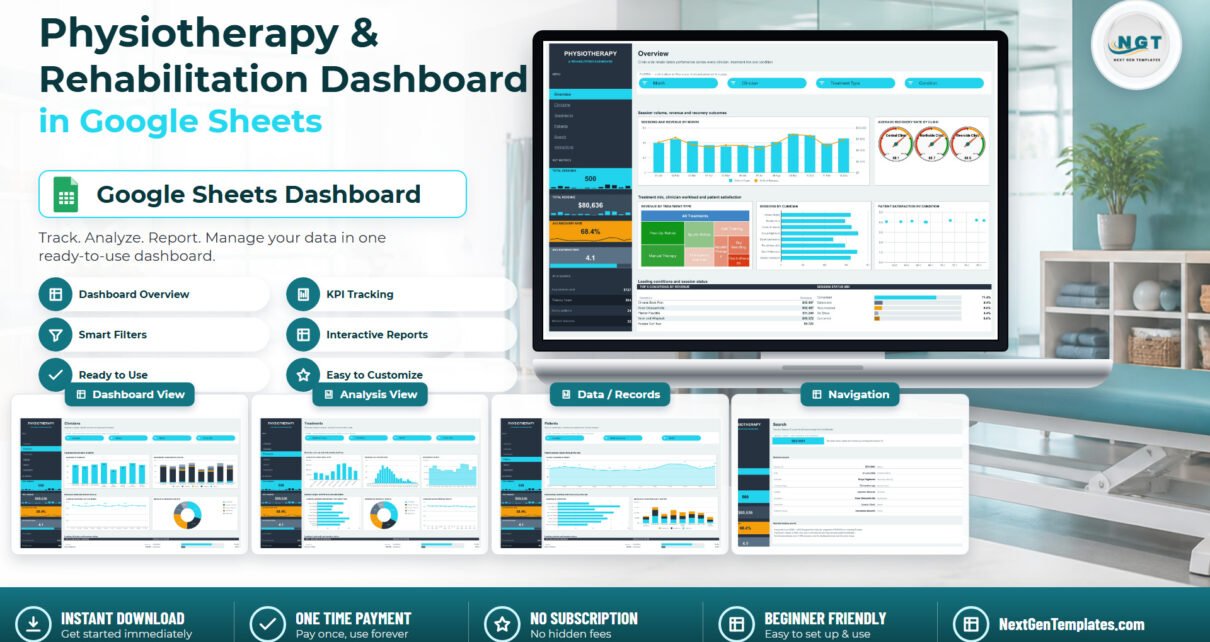
Most physiotherapy practices already own the data they need. It sits in a booking export or a shared sheet the front desk keeps: one row per session, a therapist, a treatment type, a fee. What is usually missing is the half-hour it takes to turn 500 of those rows into something you can put in front of a partners’ meeting. The Physiotherapy & Rehabilitation Dashboard in Google Sheets is that half-hour, done once and handed over: six linked report pages, four rolling KPI cards, fourteen charts and a session-level lookup, all reading a single 16-column table.Physiotherapy & Rehabilitation Dashboard in Google Sheets
The sample file ships with 500 sessions spread across 8 clinicians, 8 treatment lines, 8 conditions, 3 clinic sites and 5 referral sources, totalling $80,636 of recorded revenue, a 68.4% average recovery rate and a 4.1 average satisfaction score. The formulas already reach 1,000 rows, so most single-site practices will not touch a range for a year.Physiotherapy & Rehabilitation Dashboard in Google Sheets
Get the Physiotherapy & Rehabilitation Dashboard in Google Sheets
What This Template Is – and What It Is Not
It is worth being blunt about this before anything else, because the subject invites assumptions.
This is a static reporting spreadsheet. It has no live connection to a practice-management system, a booking platform or a medical record, and nothing in it refreshes on its own. You paste or import session rows into a Data tab and the pages recalculate. It is not an EHR and not a patient management system: there are no clinical notes, no diagnosis codes, no medication, no imaging, no contact details and no payment or insurance identifiers anywhere in the file.
It also makes no clinical claim of any kind. “Recovery Rate (%)” is a plain number that you record against a session. The dashboard averages it and charts it by month, clinician and clinic. It does not assess a patient, predict an outcome, or say anything about whether a course of treatment is working. Every figure on every page is arithmetic performed on rows you supplied.
The 16 columns are: Session ID, Date, Clinician, Treatment Type, Patient, Condition, Clinic Site, Referral Source, Status, Duration (Mins), Recovery Rate (%), Session Cost, Revenue, Satisfaction, Month and Count. The Patient column is used as a row label and nothing else, which is genuinely useful: swap the sample names for case references or initials and every chart, panel and ranking behaves identically. A reporting pack that never needs a patient’s real name is a smaller problem to look after than one that does.
Key Features of the Physiotherapy & Rehabilitation Dashboard in Google Sheets
- Six pages plus a Data tab – Overview, Clinicians, Treatments, Patients, Search and Instructions.
- A persistent KPI rail – Total Sessions, Total Revenue, Avg Recovery Rate and Avg Satisfaction stay on screen as you move between pages, each with a sparkline strip.
- An “At a glance” block – Avg session cost, Therapy hours, Active patients and Missed sessions.
- Page-level slicers – Month, Clinician, Treatment Type, Condition, Status and Clinic Site, arranged per page. Selections are page-scoped, so two pages can hold two different views at once.
- Fourteen charts on native pivots – combo column-and-line, gauges, treemap, horizontal bars, scatter, stacked columns, donuts, area and a histogram. No add-ons, no Apps Script, no macros.
- Top 5 ranking panels – by revenue for conditions, clinicians, treatments and patients, recomputed as you filter.
- A session status mix bar – Completed, Scheduled, Rescheduled, No Show and Cancelled as percentages of all bookings.
- An INDEX/MATCH session lookup – wrapped in IFERROR so a bad ID reads “Not found” rather than filling the panel with #N/A.
- Rail navigation – each page name is a link; no hunting along the tab strip.
Dashboard Pages Explanation
Overview
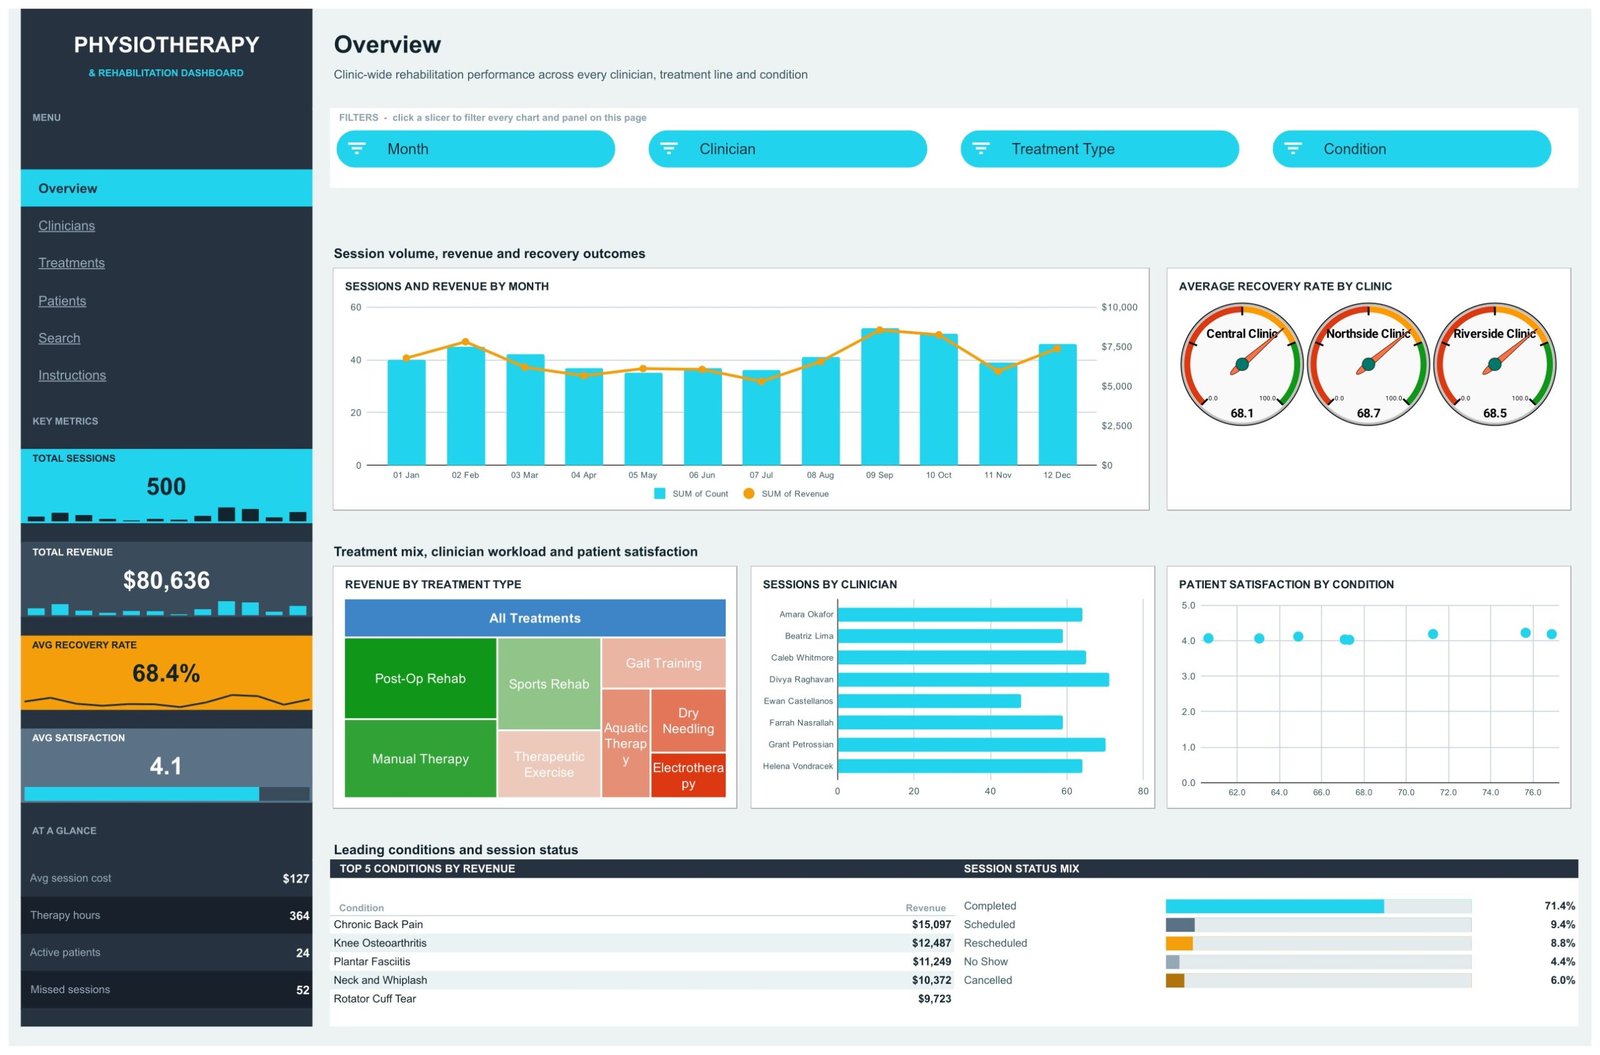
The clinic-wide view. Sessions and Revenue by Month puts session counts as columns against a revenue line. Average Recovery Rate by Clinic renders one gauge per site – in the sample data Central, Northside and Riverside sit within half a point of each other, which is exactly the sort of “nothing to see here” answer a management pack should be able to give quickly. Revenue by Treatment Type is a treemap, so the big earners are big rectangles. Sessions by Clinician and Patient Satisfaction by Condition fill the rest of the band, and the page closes with Top 5 Conditions by Revenue beside the Session Status Mix.
Clinicians
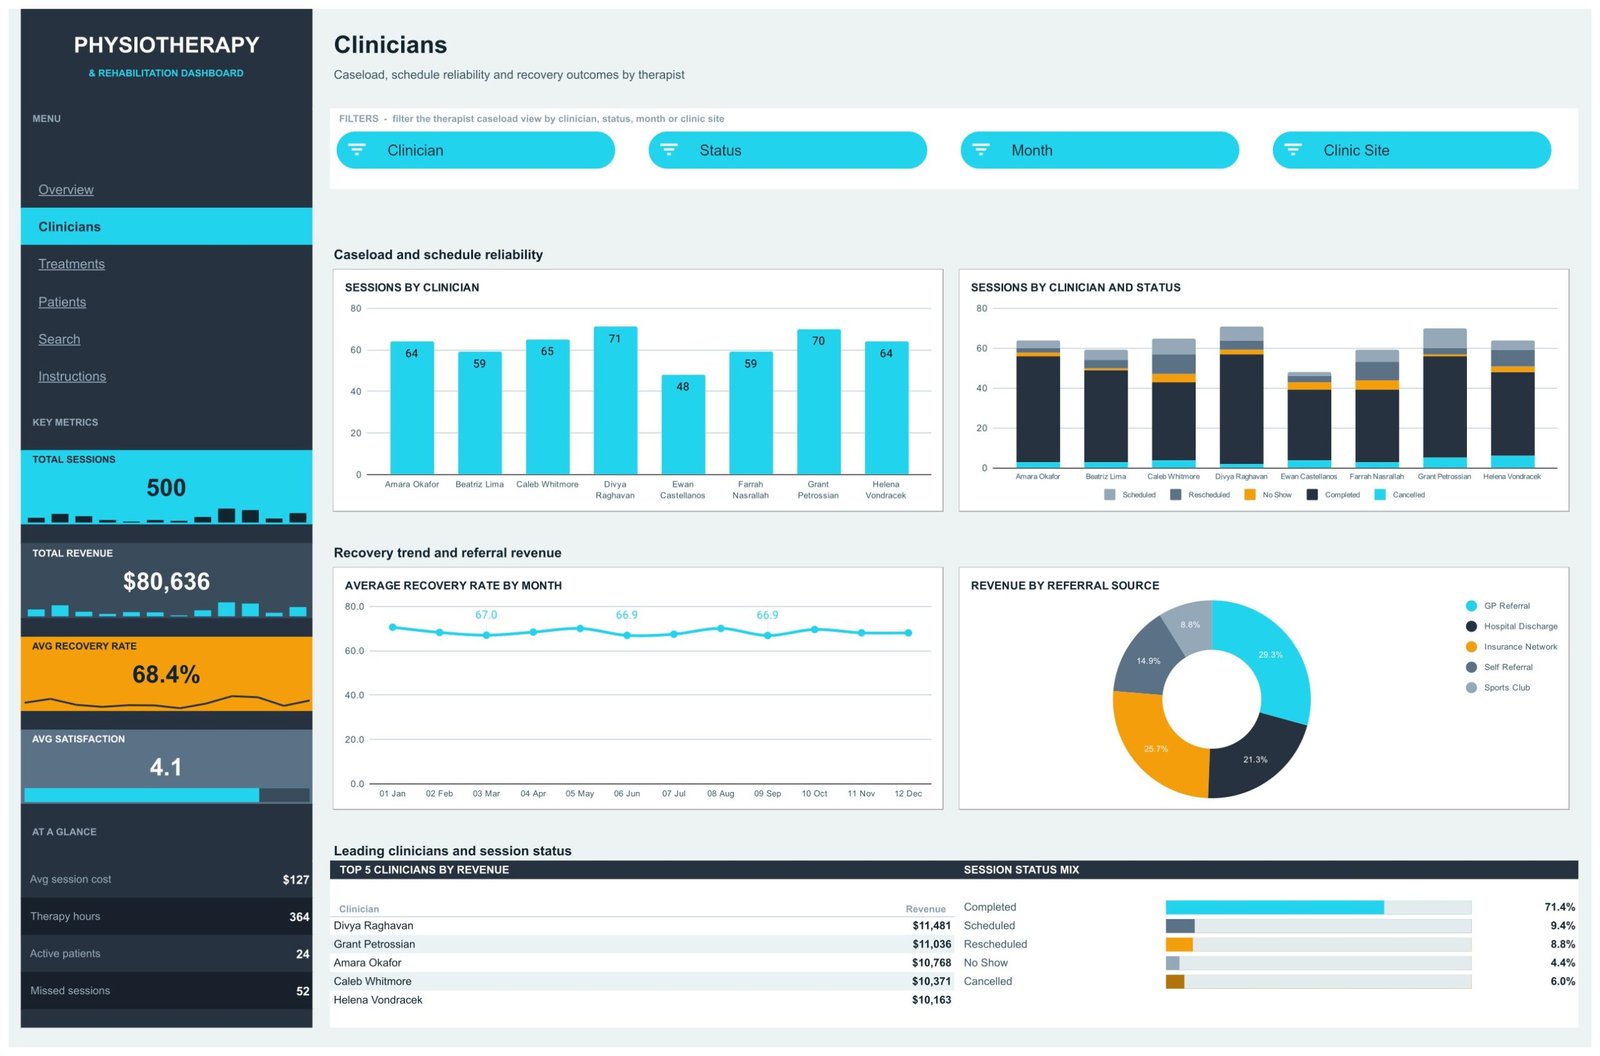
Caseload and schedule reliability by therapist. Sessions by Clinician carries data labels; Sessions by Clinician and Status stacks the five statuses on the same bars, which is where an uneven no-show load becomes obvious. Average Recovery Rate by Month is a flat-ish line in the sample data, and Revenue by Referral Source splits the money across GP Referral, Hospital Discharge, Insurance Network, Self Referral and Sports Club. A Top 5 Clinicians by Revenue panel finishes the page.
Treatments
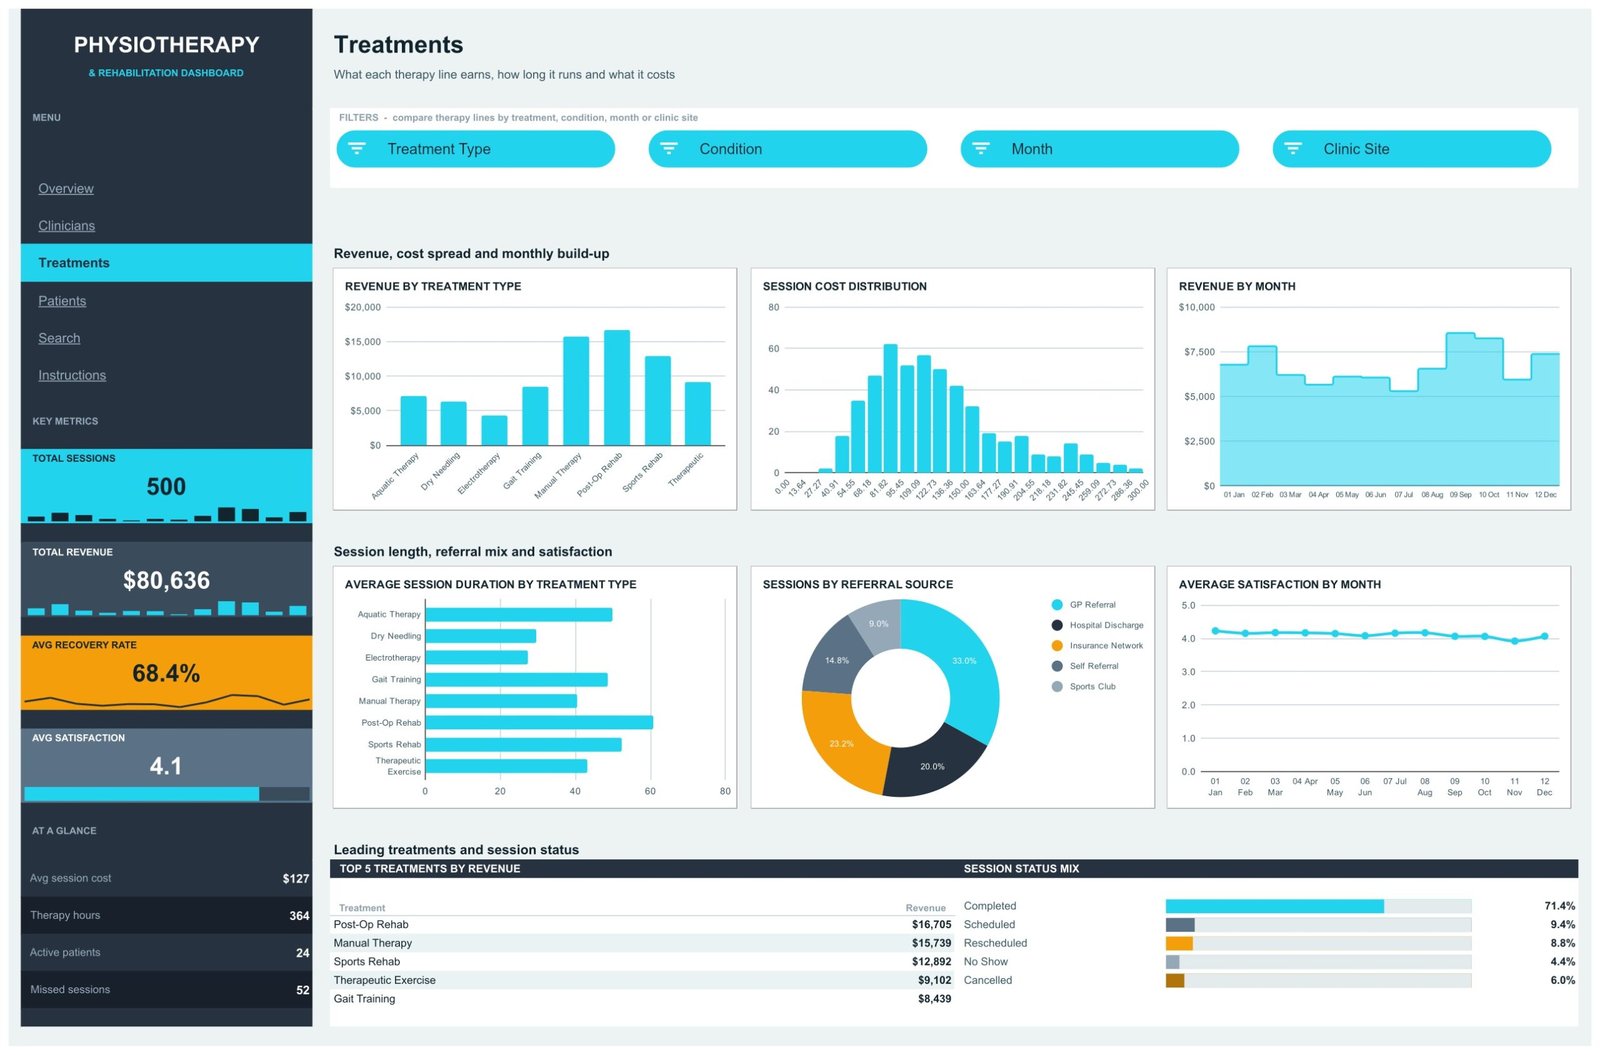
What each therapy line earns, how long it runs and what it costs. Six charts here: Revenue by Treatment Type, Session Cost Distribution (a histogram of individual session costs), Revenue by Month, Average Session Duration by Treatment Type, Sessions by Referral Source and Average Satisfaction by Month. The duration chart next to the revenue chart is the useful pairing – it shows which lines earn well per hour rather than just in total.
Patients
Three slicers on this page – Condition, Referral Source and Month. Patient Sessions by Month is a labelled area chart, Sessions by Condition ranks the eight conditions by volume, and Revenue by Condition and Clinic Site stacks the three sites inside each condition so you can see which site carries which caseload. Top 5 Patients by Revenue sits at the foot.
Search
Type a Session ID such as SES-0001 and the panel returns that session’s whole record: date, clinician, treatment type, patient reference, condition, clinic site, referral source, status, duration, recovery rate, session cost, revenue, satisfaction and month. The page explains its own plumbing – every field is an INDEX/MATCH against the Data tab, and the formulas already cover 1,000 sessions.
Instructions
Four numbered steps: load your own data, use the filters, move around, make it yours. It also tells you where the pivot tables live – scroll right on any page and they start at column Z – which is the one thing people otherwise waste twenty minutes looking for.
Physiotherapy & Rehabilitation Dashboard in Google Sheets vs. an Excel Build vs. a Paid Clinic BI Suite – Feature Comparison
| This template (Google Sheets) | An Excel dashboard build | Clinic BI suite (Tableau / Qlik) | |
|---|---|---|---|
| Cost | One payment, no renewal | One payment, or days of internal build time | Per-user licence, billed annually |
| Platform | Google Sheets in any browser | Microsoft Excel on the desktop | Vendor app plus a server or cloud tenant |
| Setup time | Paste your sessions in – minutes | Similar, once the file is on the right machine | Weeks: modelling, gateway, publishing, training |
| Real-time team collaboration | Yes, native | Via OneDrive/SharePoint co-authoring | Yes, for licensed users |
| Mobile access | Google Sheets mobile app | Excel mobile app | Vendor mobile app, licence required |
| Customisable fields | Edit the 16 headers, repoint the pivots | Yes | Yes, usually through a modeller |
| Share with a link | Yes, standard Google sharing | File or cloud link | Only with licensed viewers |
| Year-1 cost at 5 users | The purchase price, once | Purchase price plus existing Office licences | Typically four figures and up |
| Session-level lookup | Built in on the Search page | Depends on the build | Yes, via drill-through |
| Automatic refresh from a booking system | No – you paste rows in | No, unless you build the query | Yes, with a connector and an integration project |
The comparison column that matters is the last one. If your reporting has to follow a live clinical system minute by minute, a licensed BI platform is the right purchase and this template is not. If your month starts with an export, this gets you the same picture for the price of a takeaway.
Who Should Use This Template
It suits a single physiotherapy practice or a small group of two to five sites; a rehabilitation service that reports caseload, revenue and satisfaction to a board or commissioner; a clinical lead who wants to compare therapy lines on duration and cost rather than gut feel; and any practice administrator who has been asked for “the numbers for last month” one time too many.
It is the wrong purchase if you need live sync, if you want to run appointments rather than report on them, if you need clinical documentation, or if you are looking for a month-picker scorecard with traffic lights – that is a different template family entirely.
Real-World Use Cases
A three-site group’s monthly partners’ pack. Export last month’s sessions on the first Monday, paste over the Data tab, screenshot the Overview and Clinicians pages. The status-mix bar – no-shows as a share of all bookings rather than a raw count – is usually the slide that starts the conversation about reminder calls.
Reviewing a therapy line before dropping it. Filter the Treatments page to one treatment type and read revenue against average session duration and the session-cost histogram. A line that looks weak on total revenue can look very different per therapist-hour.
Answering a billing query at the desk. The Search page takes a Session ID from the paperwork and returns the date, clinician, duration and revenue in one screen – no scrolling a thousand-row sheet with a finger on the monitor.
Advantages of the Physiotherapy & Rehabilitation Dashboard in Google Sheets
- Nothing to install or authorise. No add-on, no script, no OAuth screen, no connector pointed at a clinical system.
- It works the way Google Sheets works. The charts are native pivot charts and the slicers are native slicers, so the skills your team already has transfer directly. Google’s own pivot table documentation applies to this file unchanged.
- Page-scoped filters. Two people looking at two pages do not fight over one global filter.
- It degrades gracefully. A missing Session ID on the Search page says “Not found”; empty rows are ignored by the pivots rather than charted as zeros.
- Low data sensitivity by design. Because the Patient column is only ever a label, you can run the whole pack on pseudonymised references.
- One payment. No seat count, no renewal date.
Opportunities for Improvement
Four honest limitations, so nobody is surprised after buying:
- The ranges stop at 1,000 sessions. The pivots and lookups read A1:P1001. A busy multi-site group will outgrow that and will have to extend the ranges by hand.
- There is no import. Getting your booking data in is a copy-and-paste or an import of a CSV you produced. Nothing is automated.
- Month is a column, not a calculation. The sample data carries a “Month” label per row, so a fresh dataset needs that column populated for the monthly charts to group correctly.
- Recovery Rate is only as good as what is entered. The template has no view on how you measure it and applies no validation to the number.
Best Practices
- Decide what Recovery Rate means before anyone types one, and write the definition into the Instructions page. A column averaged across eight clinicians is only useful if all eight are measuring the same thing.
- Use case references instead of patient names. The dashboard does not care, and a management pack circulated by link is far easier to live with when it carries no names.
- Never leave Session ID blank. It is the key the pivots use to skip empty rows and the key the Search page looks up.Physiotherapy & Rehabilitation Dashboard in Google Sheets
- Load a full period at a time rather than drip-feeding rows, so the monthly charts do not show a half-finished month next to complete ones.Physiotherapy & Rehabilitation Dashboard in Google Sheets
- Keep one copy per year. With a 1,000-row ceiling, an annual file is tidier than one sheet that slowly outgrows its ranges.Physiotherapy & Rehabilitation Dashboard in Google Sheets
- Recolour once, at the start. Step 4 of the Instructions page walks through the rail, the KPI cards and the chart palette; doing it before you share the link saves re-sending it.
Explore Relevant Templates
- Physiotherapy & Rehabilitation Dashboard in Google Sheets – the template this article describes.
- Physiotherapy and Rehabilitation Dashboard in Excel – the same subject on the desktop.
- Physiotherapy and Rehabilitation Dashboard in Power BI – for teams already on Power BI.
- Physiotherapy Session Calendar in Google Sheets – schedule the sessions this dashboard reports on.
- Rehabilitation Center KPI Scorecard in Excel – target-versus-actual reporting.
- All Google Sheets dashboards.Physiotherapy & Rehabilitation Dashboard in Google Sheets
Related Templates
More related walkthroughs on this blog: Physiotherapy Clinic Management System Web App, Physiotherapy Session Calendar in Google Sheets and Dental Practice Dashboard in HTML. Each is a separate template with its own layout and sample data.Physiotherapy & Rehabilitation Dashboard in Google Sheets
To learn how the pivot tables and charts in a dashboard like this are built, the Excel Pivot Tables & Dashboards course on NextGenTemplates Academy works through them with practice files.
Get the Physiotherapy & Rehabilitation Dashboard in Google Sheets
Frequently Asked Questions
Is this an EHR or a patient management system?
No. It is a Google Sheets reporting template. It cannot book, bill or document care, and it stores no clinical notes, diagnosis codes, medication, imaging or contact details.
Does it connect to my booking or practice-management software?
No. There is no connector, no API and no scheduled refresh. You paste or import rows into the Data tab. Nothing in the file requires access to a clinical system.Physiotherapy & Rehabilitation Dashboard in Google Sheets
Does it hold patient data?
Only what you choose to type. The sample rows use invented names as labels. Because the Patient column is a label and nothing more, most practices replace it with a case reference and lose no functionality.Physiotherapy & Rehabilitation Dashboard in Google Sheets
What does the Avg Recovery Rate card calculate?
The average of the Recovery Rate (%) column you fill in. There is no clinical scoring, no benchmark and no prediction involved.
How many sessions can it hold?
The pivots and lookups are set to A1:P1001 – 1,000 sessions. The sample file uses 500. Beyond that you extend the ranges yourself.Physiotherapy & Rehabilitation Dashboard in Google Sheets
Do I need Excel or a paid add-on?
No. It runs in free Google Sheets with no add-ons, no Apps Script and no macros.Physiotherapy & Rehabilitation Dashboard in Google Sheets
How is this different from the KPI Dashboard and KPI Scorecard versions?
Three different templates with similar names. This is the analytical dashboard – six pages, slicers, ranking panels, a session lookup. A KPI Dashboard is a month-picker scorecard with traffic lights and dedicated trend pages. A KPI Scorecard is a target-versus-actual sheet. Pick the one that matches the meeting you have to run.Physiotherapy & Rehabilitation Dashboard in Google Sheets
About the Author
Built by PK – Microsoft Certified Professional with 15+ years of Excel, Google Sheets, and Power BI experience. Founder of NextGenTemplates, reaching 300K+ subscribers across YouTube channels. Every template is hand-built and tested before release.Physiotherapy & Rehabilitation Dashboard in Google Sheets
Conclusion
The Physiotherapy & Rehabilitation Dashboard in Google Sheets does one job properly: it takes a flat table of therapy sessions and gives you six ways to read it – clinic-wide, by therapist, by therapy line, by patient caseload, and one session at a time. It does not pretend to be clinical software, it does not connect to anything, and it does not have an opinion about anybody’s recovery. It reports what your clinic recorded, quickly, in a tool your team already knows.Physiotherapy & Rehabilitation Dashboard in Google Sheets
More Google Sheets walkthroughs and template builds are on our YouTube channel.