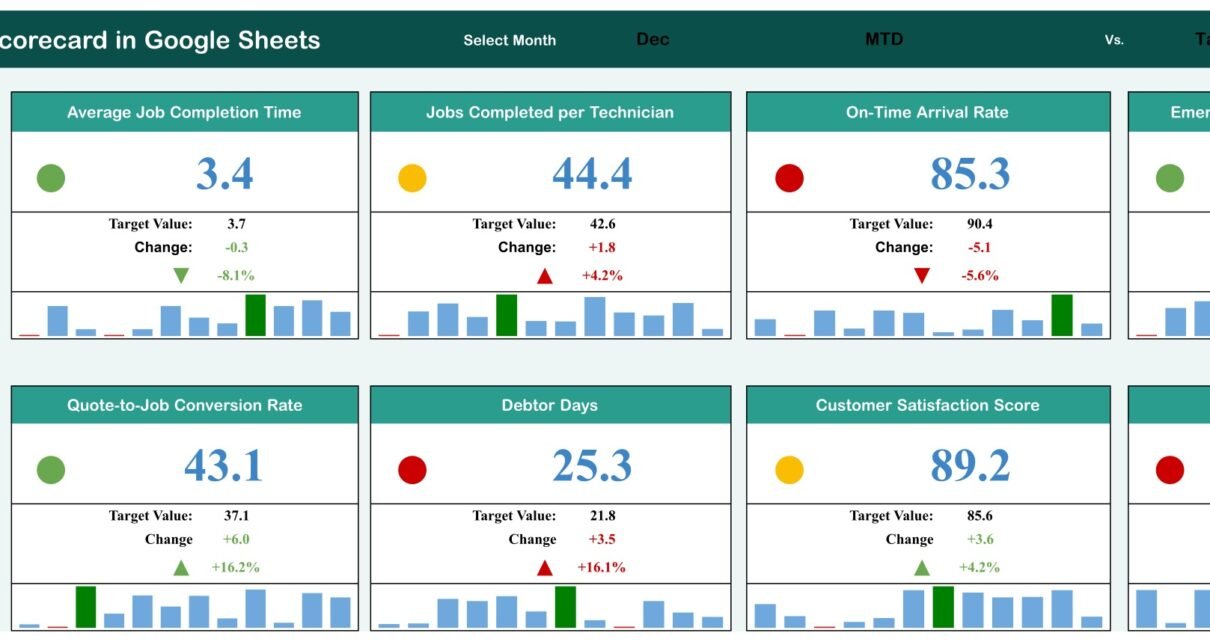
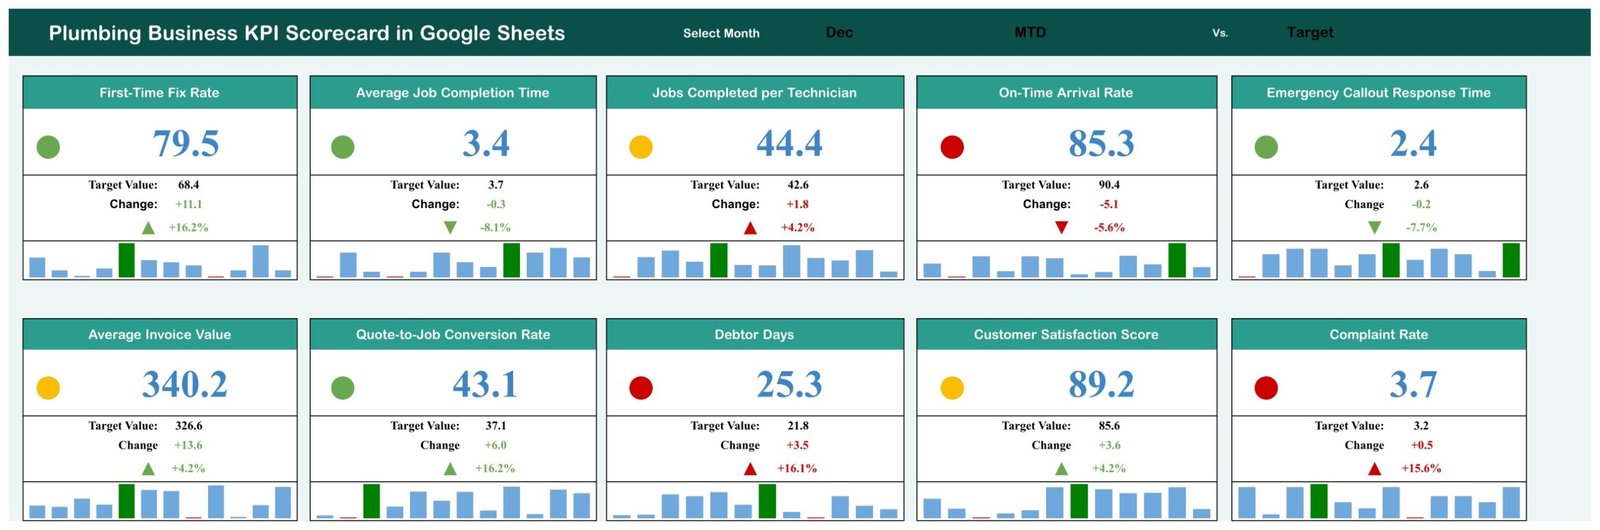
Most plumbing firms measure the same handful of things – how many jobs got fixed first time, how fast the emergency callouts were answered, how long the invoices took to get paid – and almost none of them can see all of it on one screen. The Plumbing Business KPI Scorecard in Google Sheets puts 10 plumbing KPIs in one page, scores each against that month’s target with a green, amber or red light, and switches the whole view from January to December with a single month picker. In the December sample the split is 4 green, 3 amber and 3 red. That is the entire point: three problems, visible in two seconds, without opening a single report.
Before going further, one thing worth being precise about, because NextGenTemplates publishes near-identically named templates. This is the scorecard: month picker, target-versus-actual, traffic lights, a KPI Trend page and a KPI Analysis page. It is not the analytical Plumbing Contractor Dashboard in Google Sheets, which slices job-level data by technician, area and job type. Different jobs, and plenty of firms run both.
Get the Plumbing Business KPI Scorecard in Google Sheets
Key Features of the Plumbing Business KPI Scorecard in Google Sheets
- 10 KPIs across 4 groups – Job Execution, Scheduling, Revenue and Customer. Field performance and cash sit on the same page, which is where the interesting arguments happen.
- Month picker in the header – one control re-scores every card, both trend charts and every arrow.
- Traffic-light scoring against target – green, amber or red on each card, computed against that month’s own target rather than a fixed threshold.
- Target, absolute change and percentage move – all three on every card, with a direction arrow. December’s First-Time Fix Rate reads 79.5 against a 68.4 target: +11.1, or +16.2%.
- A 12-month mini bar chart inside every card – the shape of the year, with the selected month highlighted, so a good month inside a bad year does not fool anyone.
- UTB / LTB direction handling – lower-is-better KPIs such as Average Job Completion Time, Emergency Callout Response Time, Debtor Days and Complaint Rate are scored correctly rather than penalised for going down.
- A KPI Trend page – pick any KPI, get Actual vs Target vs prior year on both an MTD and a YTD basis.
- A KPI Definition sheet – group, unit, formula, plain-English definition and direction for all 10, so the Monday meeting does not turn into a debate about what a number means.
- Editable throughout – the KPI Analysis sheet holds the monthly figures; type over the samples and the scorecard recalculates.
- Plain Google Sheets – no add-on, no script to authorise, no subscription. It opens in any browser and shares by link.
Scorecard Pages Explained
1. KPI Scorecard
The landing page. A dark banner carries the template name, the Select Month picker (Dec in the sample) and the MTD Vs. Target labels. Below it, 10 cards in two rows of five: First-Time Fix Rate, Average Job Completion Time, Jobs Completed per Technician, On-Time Arrival Rate, Emergency Callout Response Time, Average Invoice Value, Quote-to-Job Conversion Rate, Debtor Days, Customer Satisfaction Score and Complaint Rate.
Each card carries five things: the traffic-light dot, the actual value in large type, the target value, the change with a direction arrow and percentage, and the 12-bar mini chart. December’s reds are On-Time Arrival Rate (85.3 against a 90.4 target), Debtor Days (25.3 against 21.8) and Complaint Rate (3.7 against 3.2). The ambers are Jobs Completed per Technician, Average Invoice Value and Customer Satisfaction Score.
2. KPI Trend
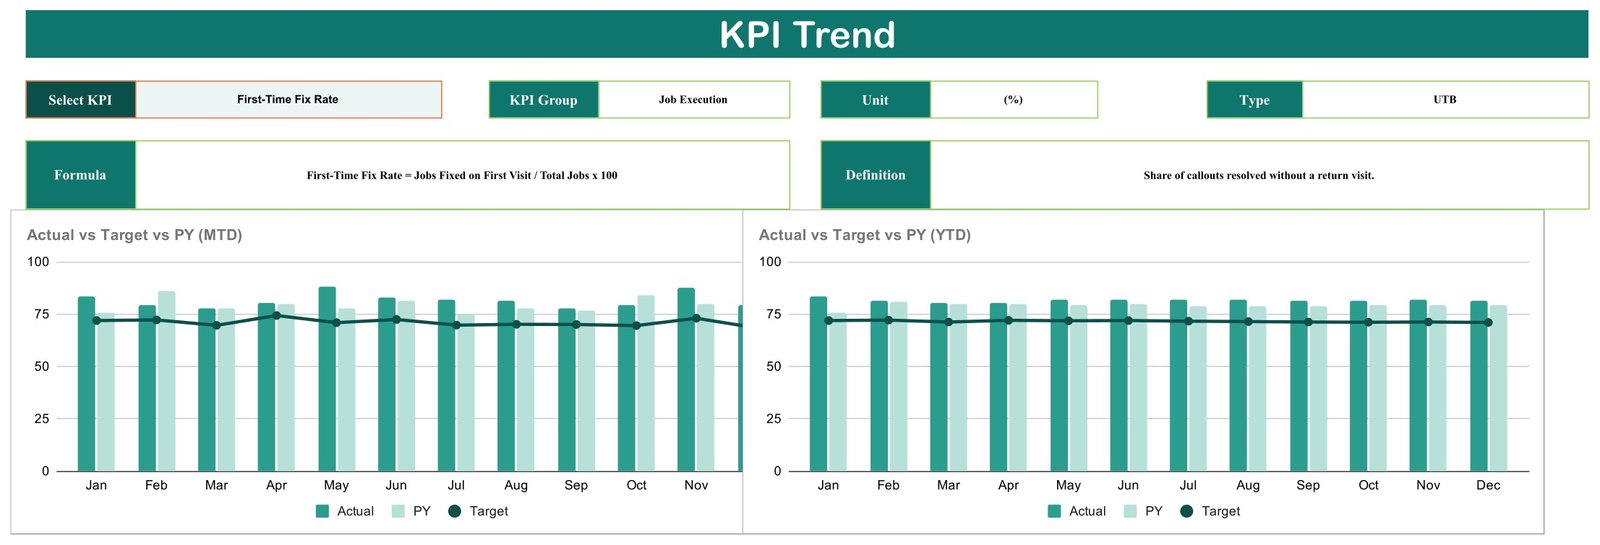
Pick a KPI from the Select KPI control and the page fills in its KPI Group, Unit, Type, Formula and Definition, then draws two charts side by side: Actual vs Target vs PY (MTD) and Actual vs Target vs PY (YTD), January through December. Actual and prior year are columns; target is a line across the top. The YTD chart is the one that settles arguments, because a single strong month cannot move it much.
3. KPI Definition

One reference table with seven columns – number, KPI Group, KPI Name, Unit, Formula, Definition and Type. First-Time Fix Rate is Jobs Fixed on First Visit / Total Jobs x 100, defined as the share of callouts resolved without a return visit, type UTB. Debtor Days is Accounts Receivable / Revenue x Days in Period, type LTB. Units run across percentages, hours, jobs, currency, days and a score out of 100.
4. KPI Analysis
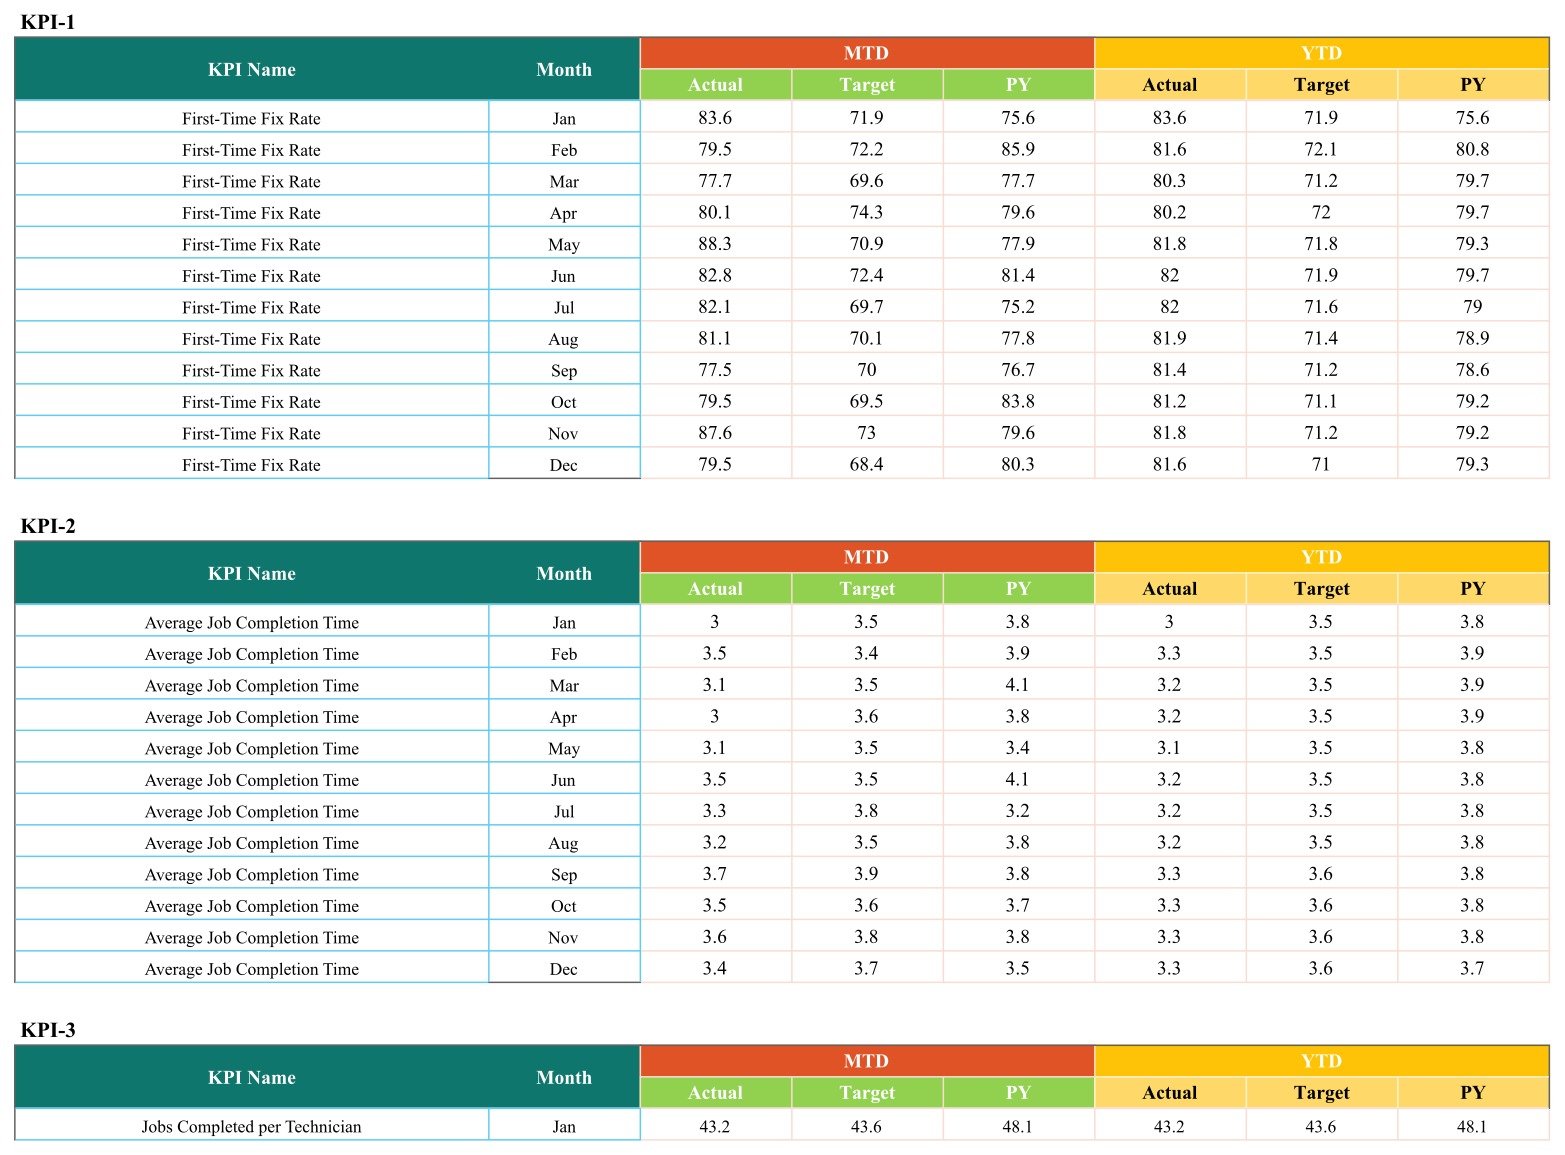
The numbers themselves, laid out one block per KPI from KPI-1 to KPI-10. Each block is a 12-row month table with MTD Actual, Target and PY beside YTD Actual, Target and PY. This is the sheet you actually maintain – everything else reads from it.
Plumbing Business KPI Scorecard in Google Sheets vs. Excel vs. Paid Field-Service Software – Feature Comparison
| This Google Sheets scorecard | Excel KPI scorecard | Paid field-service software | |
|---|---|---|---|
| Cost | One-off, under $15 | One-off, under $20 | $40-$120 per user per month |
| Platform | Google Sheets, any browser | Microsoft Excel, desktop | Vendor web app plus mobile app |
| Setup time | Minutes | Minutes | Weeks of onboarding and migration |
| Real-time team collaboration | Yes, native | Only via OneDrive co-authoring | Yes |
| Mobile access | Sheets app or browser | Excel mobile, limited | Yes, purpose-built |
| Customisable KPIs | Yes – all 10 renameable and re-targetable | Yes | Usually vendor-defined |
| Share with a link | Yes | File or cloud link | Seat required per viewer |
| Year-1 cost at 5 users | Under $15 total | Under $20 total | $2,400-$7,200 |
| Prior-year comparison | Built in, MTD and YTD | Built in | Depends on plan tier |
| Job dispatch and invoicing | No – reporting only | No | Yes |
Who Should Use This Template
It fits a plumbing firm of roughly 2 to 40 engineers that already produces the raw numbers somewhere – a job book, a field-service tool, an accounts package – and wants a monthly management view without adding a per-seat subscription. It also fits a plumbing or drainage division inside a bigger facilities or property-maintenance group that has to report upward in a consistent format every month.
It is the wrong tool if you need live dispatch, engineer location tracking, automatic invoice sync or alerts. Nothing in the sheet does any of that. It is also the wrong shape if your question is “which technician and which job type are dragging the average down” – that is analysis, and the Plumbing Contractor Dashboard in Google Sheets answers it. Excel-first teams should take the Plumbing Business KPI Scorecard in Excel, which has the same 10 KPIs in a native workbook.
Real-World Use Cases
The owner-operator with nine engineers. December looks decent – First-Time Fix Rate 79.5 green, Emergency Callout Response Time 2.4 hours green – but On-Time Arrival Rate is red at 85.3 against a 90.4 target. The trend page shows arrival rate has sat under target for most of the year, so the fix is the promised time window, not a December staffing problem.
The office manager at a commercial contractor. Debtor Days is red at 25.3 against 21.8, up 16.1% the wrong way, while Average Invoice Value has climbed to 340.2. Bigger jobs, slower payers. Those two cards together are the business case for staged invoicing above a certain contract value.
The operations lead across several trades. One copy of the scorecard per division, reviewed side by side each month. Because every copy states the KPIs identically – same formula, same unit, same direction – the comparison is honest. Complaint Rate at 3.7 against a 3.2 target is what goes into the divisional pack.
Advantages of the Plumbing Business KPI Scorecard in Google Sheets
- One screen, one decision. Ten cards and three colours beats a twelve-tab workbook nobody opens.
- Targets are per month, not fixed. Seasonal trades need a different bar in January than in July, and the sheet supports that.
- Prior year is built in. Beating target while sliding against last year is a common and easily missed pattern; the trend page shows both.
- Direction is handled properly. Four of the 10 KPIs are lower-is-better, and the scoring respects that.
- Definitions ship with it. The formula is on the sheet, so the number means the same thing to everyone.
- It costs once. No per-seat licence for the person who only ever looks at it.
Opportunities for Improvement
Being straight about the limits: there is no import and no integration. Monthly figures are typed or pasted in, which takes a few minutes and is a step you have to remember. There is no alerting – the traffic lights are visual, and nothing emails you when a KPI turns red. The horizon is a rolling 12 months plus a prior-year column, so multi-year trend work means keeping older copies. And the KPI count is fixed at 10; you can rename and re-purpose them freely, but adding an eleventh means extending the sheet yourself. For most firms 10 is already more than they review.
Best Practices
- Set targets that can fail. An all-green scorecard is decoration. The sample month shows three reds on purpose.
- Load last year first. The prior-year columns are what make the trend page worth opening; without them you have a scorecard and no context.
- Review on a fixed day. First working day of the month, same fifteen minutes, same order: reds first, then ambers, then the trend page for anything that has moved twice in a row.
- Rename rather than ignore. If Debtor Days is meaningless because you take card payment on completion, swap it for Callback Rate on the KPI Definition sheet.
- Share view-only. Give engineers and the office a view link and keep edit rights with whoever owns the numbers. Google’s own guidance on sharing files and setting permissions covers the options.
- Keep one copy per year. Duplicate the file each January rather than overwriting, so last year survives intact.
Explore Relevant Templates
- Plumbing Business KPI Scorecard in Google Sheets – the template this article walks through.
- Plumbing Business KPI Scorecard in Excel – same 10 KPIs, native Excel workbook.
- Plumbing Contractor Dashboard in Google Sheets – the analytical companion for job-level slicing.
- Plumbing Contractor Dashboard in Power BI – the same plumbing analysis for a Power BI stack.
- Equipment Maintenance Log Tracker in Google Sheets – keep vans, pumps and test gear serviced.
- Plumbing Maintenance Checklist in Google Sheets – a job-level checklist for routine visits.
Get the Plumbing Business KPI Scorecard in Google Sheets
Want to build KPI views like this from scratch? The Excel Pivot Tables & Dashboards course on NextGenTemplates Academy teaches it step by step, with practice files.
Frequently Asked Questions
Is this a dashboard or a scorecard?
A scorecard. It compares actual against target for 10 fixed KPIs, month by month, with traffic lights. A dashboard slices a dataset by category and answers “why”. If you want the second thing for plumbing, the Plumbing Contractor Dashboard in Google Sheets is the one.
Do I need a paid Google Workspace account?
No. A free Google account is enough. The PDF in your download carries a Make a copy link; clicking it puts an editable copy in your own Drive.
Can I change the 10 KPIs?
Yes. Name, group, unit, formula text and UTB/LTB direction all live on the KPI Definition sheet, and the monthly figures on the KPI Analysis sheet.
Does it pull data from my job management or accounting software?
No. There is no import or sync of any kind. You enter the monthly figures yourself, which is what keeps it usable regardless of which systems you run.
Will it notify me when something turns red?
No. The colours are visual only – there is no email, alert or notification built into the sheet.
How far back does it go?
Twelve months, each with a prior-year comparison, on both MTD and YTD bases.
Can several people use it at once?
Yes, that is a Google Sheets strength – share the link and edit or view together in real time.
About the Author
Built by PK – Microsoft Certified Professional with 15+ years of Excel, Google Sheets, and Power BI experience. Founder of NextGenTemplates, reaching 300K+ subscribers across YouTube channels. Every template is hand-built and tested before release.
Conclusion
A plumbing business does not fail because nobody measured anything. It drifts because the measurements live in four places and nobody lines them up on the same page once a month. The Plumbing Business KPI Scorecard in Google Sheets does exactly that one job: 10 KPIs, one month picker, three colours, a trend page for the ones that need a second look and a definition sheet so the numbers mean the same thing to everybody. No subscription, no integration project, no seat count.
Get the Plumbing Business KPI Scorecard in Google Sheets, open the PDF, click Make a copy, and put your own year in it.