In today’s competitive business environment, procurement plays a vital role in cost optimization, supplier management, and operational performance. The Procurement KPI Scorecard in Google Sheets provides a smart and easy-to-use template to track, measure, and analyze key procurement metrics.
This ready-to-use scorecard helps procurement teams visualize monthly and yearly data with interactive visuals, performance indicators, and color-coded alerts for quick interpretation.
In this article, we’ll explore how this scorecard works, its features, benefits, and best practices for using it effectively.
What Is a Procurement KPI Scorecard?
A Procurement KPI Scorecard is a structured dashboard designed to evaluate the performance of procurement activities. It consolidates critical metrics such as cost savings, supplier performance, purchase order efficiency, and compliance rate in a single interactive sheet.
Built in Google Sheets, this scorecard gives procurement managers full visibility into their KPIs and helps them make data-driven decisions to enhance performance, reduce costs, and improve supplier relationships.
Key Features of the Procurement KPI Scorecard in Google Sheets
Click to Buy Procurement KPI Scorecard in Google Sheets
The scorecard consists of multiple worksheet tabs, each serving a distinct analytical purpose.
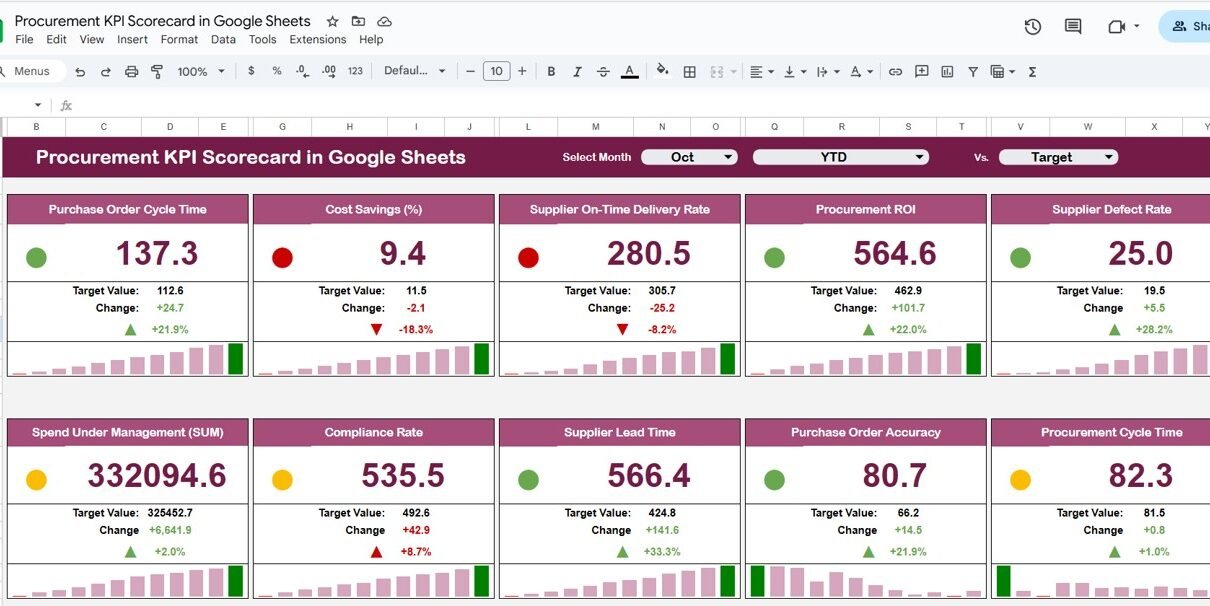
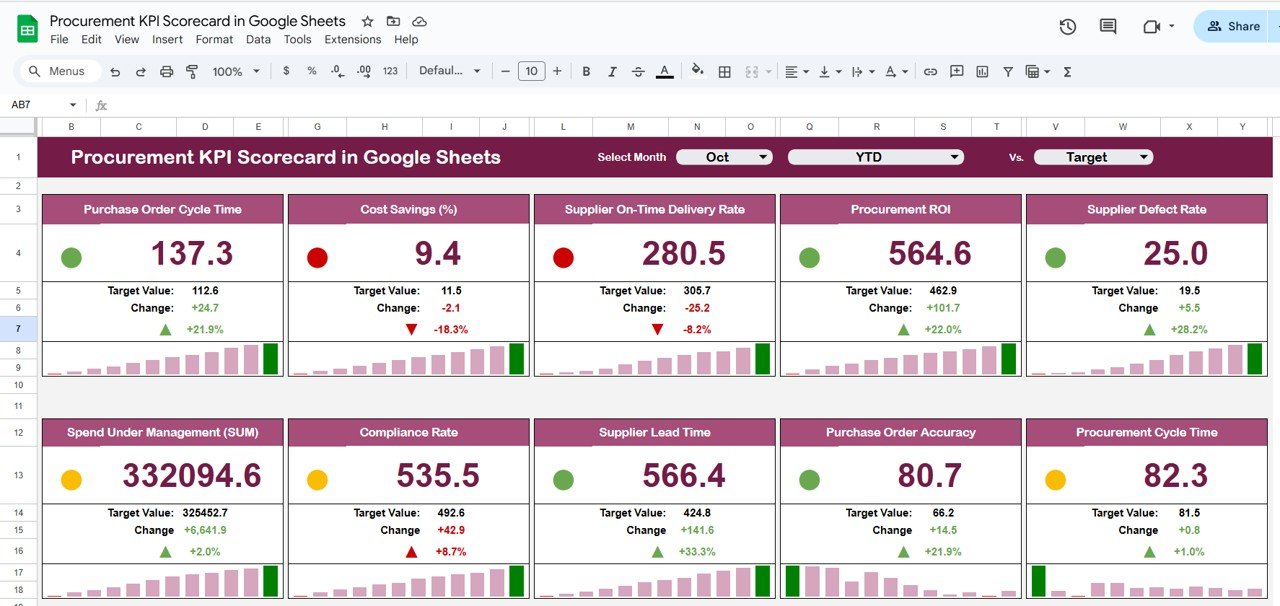
1. Dashboard Sheet Tab
This is the main page of the scorecard where all KPIs are displayed visually.
Key Features:
-
Month Dropdown (Cell D3): Select a month from the dropdown menu to view month-specific (MTD) performance.
-
Auto-Update: Once a month is selected, all KPI numbers, charts, and icons automatically update.
Visual Indicators:
- 🔺 Green Arrow – KPI performing above target
- 🔻 Red Arrow – KPI performing below target
Traffic-Light Colors: Quickly indicate performance with red (needs improvement), yellow (moderate), and green (good) indicators.
YTD Toggle: Switch between MTD (Month-to-Date) and YTD (Year-to-Date) for an annual perspective.
This page offers a one-glance overview of procurement efficiency and supplier performance.
Click to Buy Procurement KPI Scorecard in Google Sheets
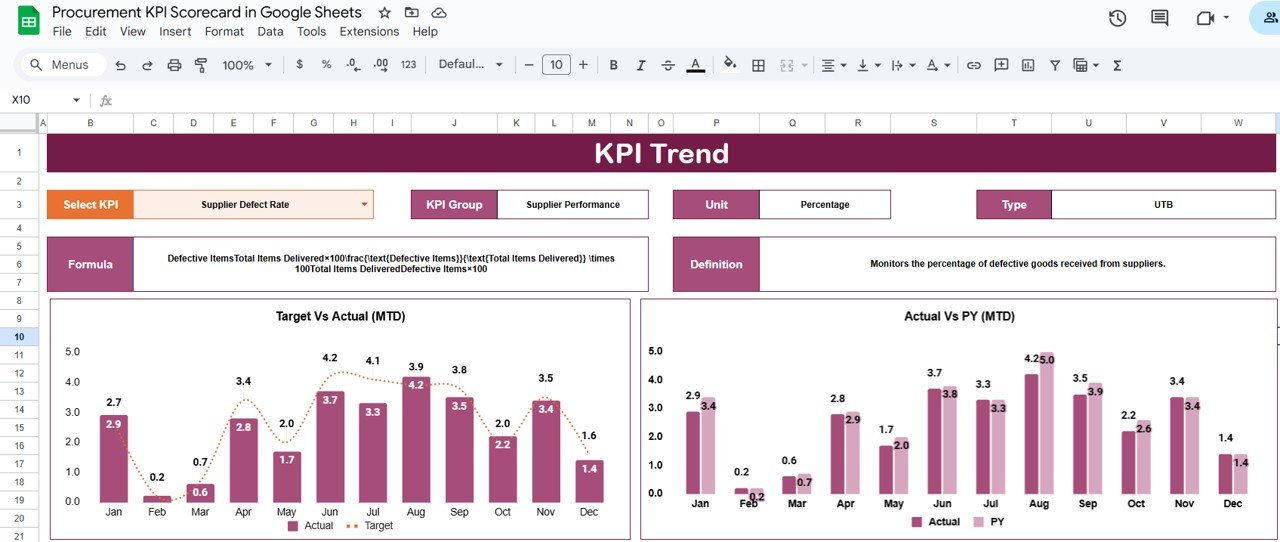
2. KPI Trend Sheet Tab
The KPI Trend Sheet enables users to analyze changes in performance over time.
Features:
-
KPI selection dropdown (Cell C3)
-
Displays KPI Group, Unit, Formula, and Type — whether it is Lower-the-Better (LTB) or Upper-the-Better (UTB)
-
Line or combo charts show how each KPI evolves monthly or quarterly
This tab is especially helpful for identifying performance trends and improvement opportunities.
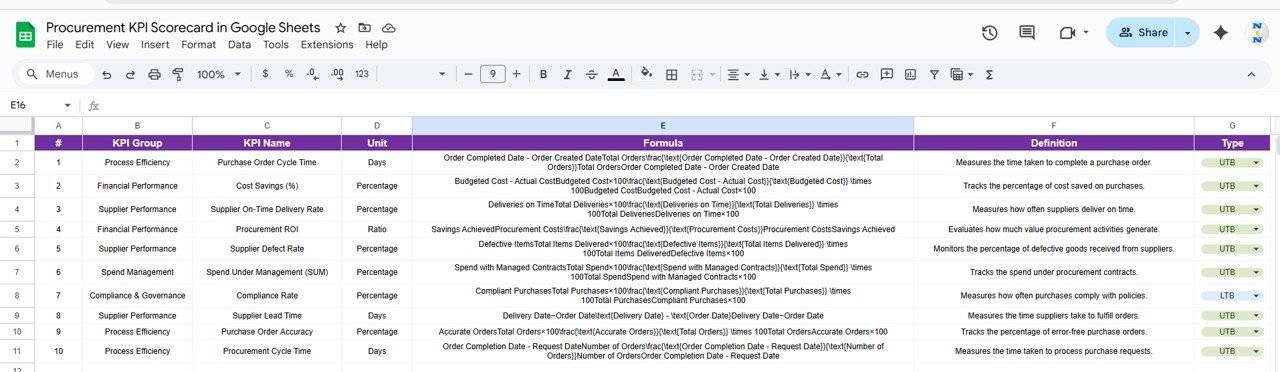
3. KPI Definition Sheet Tab
The KPI Definition Sheet defines each KPI for clear understanding and consistency.
Columns Include:
-
KPI Name
-
KPI Group
-
Unit of Measurement
-
Formula
-
KPI Definition
-
Type (Lower-the-Better / Upper-the-Better)
This ensures all stakeholders share the same interpretation of each metric.
Click to Buy Procurement KPI Scorecard in Google Sheets
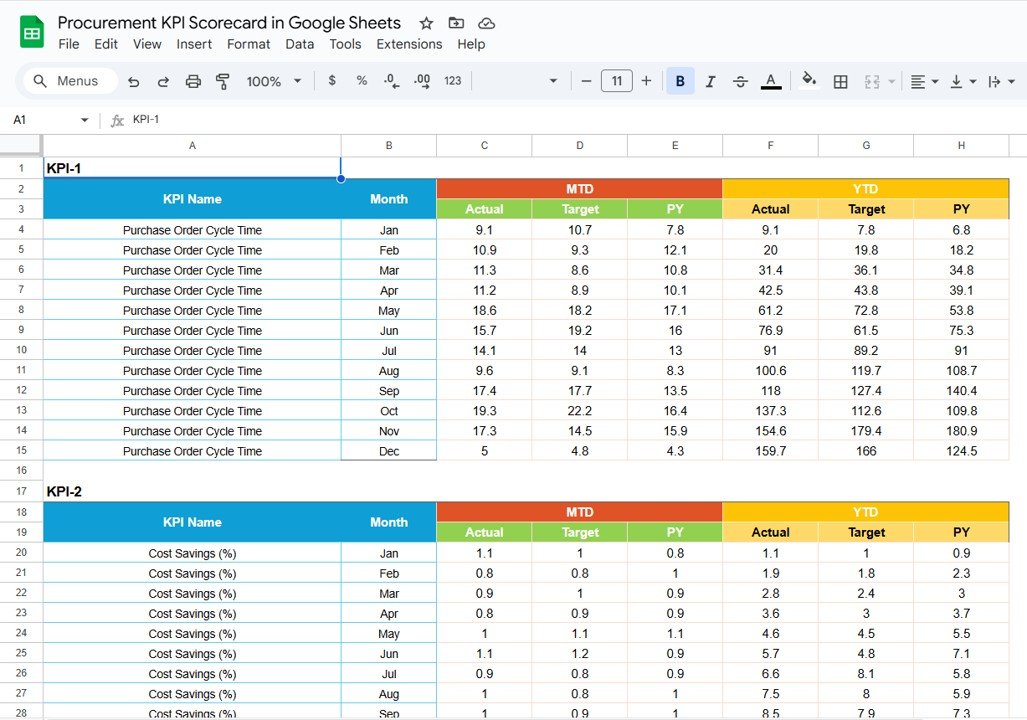
4. Data Input Sheet Tab
The Data Input Sheet is where all actual data is entered.
-
Enter MTD and YTD values for each KPI
-
Include monthly target and previous year figures for performance comparison
-
Automatic calculations update all dashboards in real-time
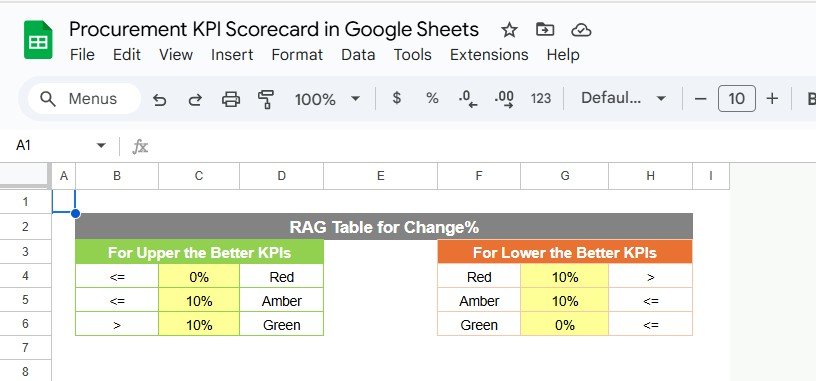
5. Color Settings Sheet Tab
This tab allows users to customize conditional formatting thresholds for traffic lights and arrow icons.
-
Define ranges for Green, Yellow, and Red colors
-
Adjust thresholds as per company goals
-
Update performance color logic without changing any formulas
This flexibility ensures the scorecard matches your organization’s performance evaluation standards.
Click to Buy Procurement KPI Scorecard in Google Sheets
Advantages of Using a Procurement KPI Scorecard
Real-Time Monitoring: View live updates as data changes in Google Sheets.
Data-Driven Insights: Identify cost savings, efficiency gaps, and supplier issues instantly.
Improved Supplier Relationships: Use data to evaluate supplier reliability and quality.
Performance Transparency: Share reports with stakeholders in real-time.
Customizable Metrics: Add, remove, or adjust KPIs according to business objectives.
Interactive Visualization: Visual arrows, color coding, and graphs simplify analysis.
Best Practices for Using the Procurement Scorecard
-
Update Data Consistently: Enter actual and target values monthly to keep dashboards accurate.
-
Review MTD and YTD Trends: Compare short-term and long-term performance regularly.
-
Set Clear Thresholds: Use the color settings sheet to define success and alert zones.
-
Analyze by Category: Evaluate KPIs by supplier, product category, or department.
-
Communicate Insights: Share key findings with procurement and finance teams.
How the Dashboard Supports Decision-Making
Click to Buy Procurement KPI Scorecard in Google Sheets
-
Identifies Inefficiencies: Detect delays or high lead times to improve procurement speed.
-
Measures Cost Impact: Monitor cost variance and savings against planned budgets.
-
Tracks Supplier Reliability: Evaluate on-time delivery and quality to improve supplier base.
-
Supports Strategic Planning: Provides insights for supplier negotiation and risk management.
-
Improves Compliance: Ensures adherence to internal procurement policies and contract terms.
Frequently Asked Questions (FAQs)
Q1: Can I customize KPIs in this dashboard?
Yes, you can add or remove KPIs by updating the KPI Definition and Data Input sheets.
Q2: How do I switch between MTD and YTD data?
Use the MTD/YTD toggle buttons on the Dashboard to view monthly or yearly performance.
Q3: Can I adjust performance colors?
Yes, use the Color Settings tab to change threshold ranges for traffic-light indicators.
Q4: Does the dashboard auto-update when new data is added?
Yes, all visual charts and KPIs update automatically once new data is entered.
Q5: Is this dashboard suitable for multi-department procurement?
Absolutely. You can extend the dataset to include department-wise or supplier-wise KPIs.
Conclusion
Click to Buy Procurement KPI Scorecard in Google Sheets
The Procurement KPI Scorecard in Google Sheets is a practical and interactive tool for tracking procurement performance. With automatic updates, conditional formatting, trend charts, and a well-defined KPI structure, it empowers procurement professionals to make informed decisions, manage suppliers effectively, and optimize costs.
Visit our YouTube channel to learn step-by-step video tutorials
Youtube.com/@NeotechNavigators
Watch the step-by-step video Demo: