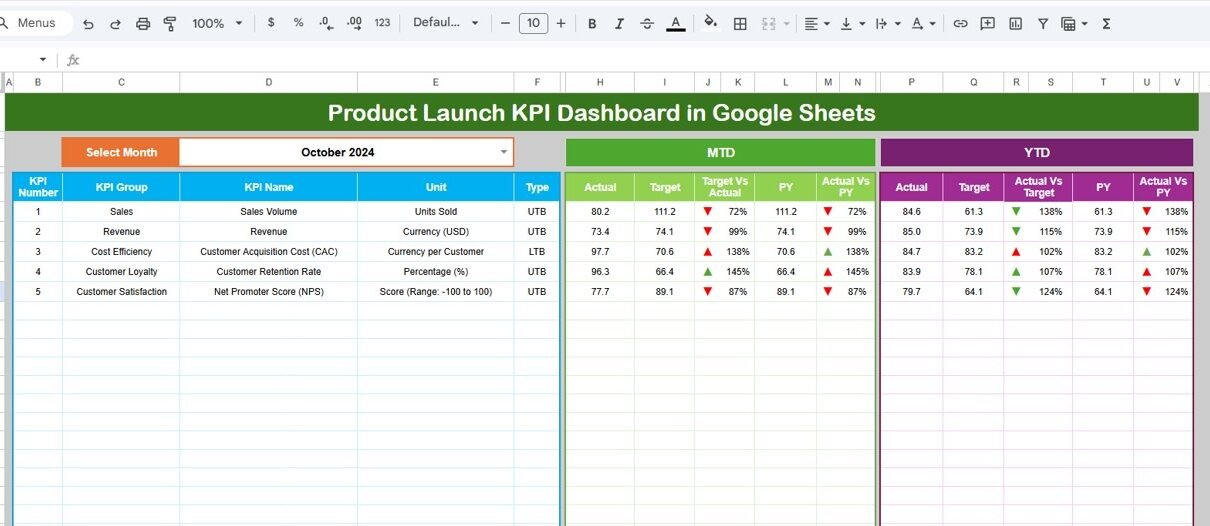
Launching a product is exciting. However, without proper tracking, even the best ideas can fail. Many businesses collect launch data, yet they struggle to convert it into actionable insights. As a result, teams miss opportunities, delay decisions, and lose competitive advantage.Product Launch KPI Dashboard in Google Sheets
Therefore, companies need a structured, interactive, and real-time performance tracking system. More importantly, they need a dashboard that monitors launch KPIs clearly and dynamically.Product Launch KPI Dashboard in Google Sheets
That is exactly where the Product Launch KPI Dashboard in Google Sheets becomes a powerful solution.
In this complete guide, you will learn:Product Launch KPI Dashboard in Google Sheets
What Is a Product Launch KPI Dashboard in Google Sheets?
Click to Buy Product Launch KPI Dashboard in Google Sheets
A Product Launch KPI Dashboard in Google Sheets is an interactive performance tracking system designed to measure the success of a new product introduction.
Instead of reviewing scattered spreadsheets, you can monitor all important metrics in one centralized dashboard. Consequently, you make faster, smarter, and data-driven decisions.
Because the dashboard runs in Google Sheets, your team can collaborate in real time from anywhere.
Why Do You Need a Product Launch KPI Dashboard?
Product launches involve multiple teams — marketing, sales, operations, finance, and product development. Therefore, tracking performance manually becomes complex.
However, with a KPI dashboard, you can:
- Monitor sales performance
- Track marketing effectiveness
- Compare actual vs target results
- Evaluate customer response
- Identify gaps early
As a result, you improve launch performance significantly.
Structure of the Product Launch KPI Dashboard (6 Worksheets Explained)
Click to Buy Product Launch KPI Dashboard in Google Sheets
Now let us understand how the dashboard works.
Dashboard Sheet Tab (Main Sheet)
This is the central dashboard page.
Key Features:
- Month dropdown in Range D3
- Dynamic dashboard updates for selected month
- MTD (Month-To-Date) metrics
- YTD (Year-To-Date) metrics
- Previous Year comparison
- Target vs Actual comparison
- PY vs Actual comparison
- Conditional formatting with up/down arrows
Because the dashboard responds instantly, users analyze performance quickly.

Click to Buy Product Launch KPI Dashboard in Google Sheets
KPI Trend Sheet Tab
This sheet provides detailed KPI analysis.
Features:
-
KPI dropdown in Range C3
-
Displays:
- KPI Group
- Unit
- KPI Type (LTB/UTB)
- Formula
- KPI Definition
Moreover, it shows monthly trend charts for deeper performance analysis.

Click to Buy Product Launch KPI Dashboard in Google Sheets
Actual Number Sheet Tab
In this sheet, users input actual values.
Key Inputs:
-
Enter MTD and YTD numbers
-
Change month from Range E1
-
Enter first month of the year in E1
Because the dashboard links dynamically, data updates automatically.

Target Sheet Tab
This sheet contains target values for each KPI.
You must enter:
-
Monthly MTD Target
-
Monthly YTD Target
As a result, the dashboard calculates performance gaps.

Click to Buy Product Launch KPI Dashboard in Google Sheets
Previous Year Number Sheet Tab
Here, you enter last year’s KPI numbers.
Therefore, the dashboard compares:
-
Current Year vs Previous Year
-
Growth Percentage

Click to Buy Product Launch KPI Dashboard in Google Sheets
KPI Definition Sheet Tab
This sheet defines all KPIs.
You enter:
- KPI Name
- KPI Group
- Unit
- Formula
- KPI Definition
Because this sheet maintains clarity, stakeholders understand each metric properly.

Advantages of Product Launch KPI Dashboard in Google Sheets
Click to Buy Product Launch KPI Dashboard in Google Sheets
Implementing this dashboard offers powerful benefits.
1. Real-Time Performance Monitoring
Because Google Sheets updates instantly, teams track performance live.
2. Centralized KPI Management
All launch metrics remain in one structured dashboard.
3. Easy Collaboration
Since it runs on Google Sheets, teams collaborate seamlessly.
4. Target Tracking Made Simple
Users quickly identify gaps between actual and target numbers.
5. Historical Comparison
The dashboard compares previous year performance effortlessly.
6. Smart Visual Indicators
Conditional formatting helps users detect performance status instantly.
Best Practices for the Product Launch KPI Dashboard
Click to Buy Product Launch KPI Dashboard in Google Sheets
To maximize effectiveness, follow these best practices.
Define Clear Launch Goals
Before entering data, define clear targets. Otherwise, measurement loses meaning.
Update Data Regularly
Enter MTD and YTD data consistently. Because consistency drives accuracy, insights become reliable.
Focus on Actionable KPIs
Avoid too many KPIs. Instead, focus on metrics that drive decisions.
Validate Data Accuracy
Check data before entry. Errors can distort the dashboard.
Review Performance Weekly
Although monthly tracking helps, weekly reviews improve agility.
Conclusion
Click to Buy Product Launch KPI Dashboard in Google Sheets
The Product Launch KPI Dashboard in Google Sheets delivers a structured, interactive, and dynamic solution to track launch performance effectively.
Instead of relying on scattered reports, organizations gain complete visibility into:
- Revenue
- Sales
- Marketing ROI
- Customer Experience
- Operational Efficiency
Moreover, with clearly defined KPIs, trend analysis, and conditional indicators, teams make smarter decisions.
If you want to ensure product launch success, this dashboard provides the clarity and control you need.
Frequently Asked Questions (FAQs)
Click to Buy Product Launch KPI Dashboard in Google Sheets
What is the main purpose of this KPI dashboard?
It helps track product launch performance using structured KPIs in Google Sheets.
Can I customize KPIs?
Yes. You can add, modify, or remove KPIs easily in the KPI Definition sheet.
Does the dashboard support MTD and YTD analysis?
Yes. It supports both MTD and YTD tracking with dynamic comparisons.
Is it suitable for small businesses?
Yes. Because it runs in Google Sheets, businesses of all sizes can use it.
Do I need advanced technical skills?
No. Basic Google Sheets knowledge is enough to operate this dashboard.
Visit our YouTube channel to learn step-by-step video tutorials
Youtube.com/@NeotechNavigators
Watch the step-by-step video tutorial: