Power BI

Custom Tooltip in Power BI

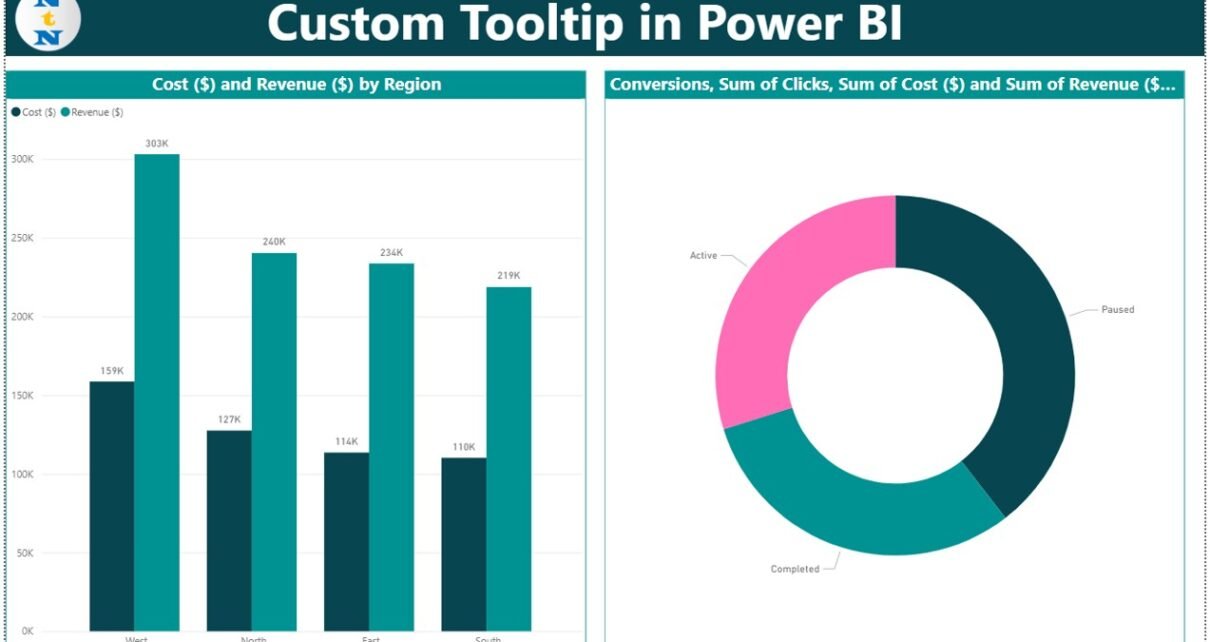
Tooltips in Power BI are more than just floating numbers. With custom tooltips, you can add meaningful visualizations that appear when a user hovers over any chart or graphic. This feature enables powerful storytelling without overwhelming your main report canvas.Custom Tooltip in Power BI In this blog post, we will explain what custom tooltips are, […]

Dashboard

Real Estate Dashboard in Google Sheets

In today’s fast-paced property market, real estate professionals need quick insights, organized data, and visually appealing tools to manage listings, costs, and client engagement. A Real Estate Dashboard in Google Sheets offers just that—a dynamic, cloud-based solution that streamlines real estate analytics and simplifies decision-making. This article will walk you through everything you need to […]

Google Sheets

Digital Learning KPI Dashboardin Google Sheets

In today’s rapidly evolving world of digital education, tracking key performance indicators (KPIs) is vital for ensuring that educational goals are met and that progress is measurable. The Digital Learning KPI Dashboard in Google Sheets is an efficient, user-friendly tool designed to help educators and administrators track and visualize essential metrics to improve the effectiveness […]

Google Sheets

Customer Engagement KPI Dashboard in Google Sheets

In today’s fast-paced business environment, tracking customer engagement is crucial for any organization aiming to improve its customer relationships and drive growth. One of the most effective ways to monitor customer engagement is through a Customer Engagement KPI Dashboard. This powerful tool allows businesses to visualize key performance indicators (KPIs) in an easily digestible format, […]

Google Sheets

Sports KPI Dashboard in Google Sheets

In the world of sports, performance is everything. Whether you are managing a professional team, organizing a fitness program, or overseeing a sports-related business, tracking Key Performance Indicators (KPIs) is crucial to ensuring continuous improvement. A Sports KPI Dashboard in Google Sheets is a versatile and effective tool for managing and monitoring the performance of […]

Google Sheets

Publishing KPI Dashboard in Google Sheets

In today’s digital world, tracking Key Performance Indicators (KPIs) is crucial for any business, including the publishing industry. By utilizing a Publishing KPI Dashboard in Google Sheets, organizations can seamlessly track their progress, assess their strategies, and make data-driven decisions. This guide will walk you through the key features, advantages, opportunities for improvement, best practices, […]

Google Sheets

Legal KPI Dashboard in Google Sheets

In the fast-paced legal environment, staying on top of key performance indicators (KPIs) is essential for tracking progress, improving efficiency, and ensuring smooth operations. A Legal KPI Dashboard in Google Sheets provides law firms and legal departments with an intuitive, easily accessible way to track critical data points related to their legal operations. This article […]