A practical guide to the Project Plan (Gantt Chart) template in Google Sheets: enter tasks, start dates and durations, and the sheet calculates end dates and draws red, amber and green bars by status. Includes the formulas to rebuild it yourself.
Online Tutorial for Data Analysis and Automation
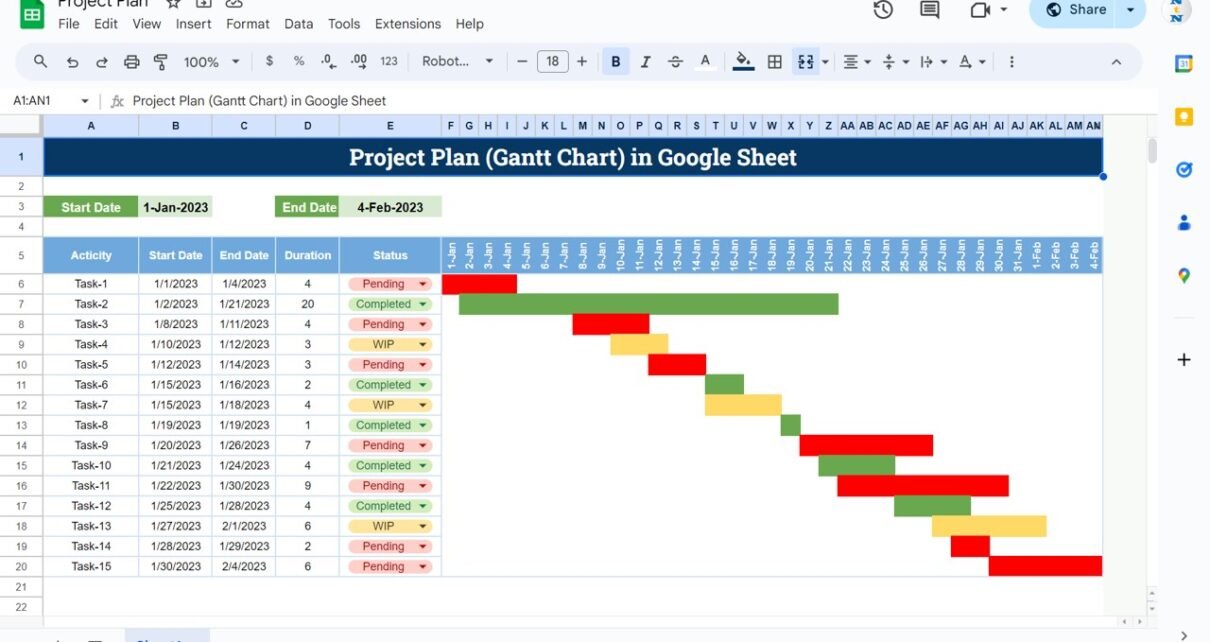
A practical guide to the Project Plan (Gantt Chart) template in Google Sheets: enter tasks, start dates and durations, and the sheet calculates end dates and draws red, amber and green bars by status. Includes the formulas to rebuild it yourself.