Efficient team management requires tracking multiple metrics, understanding performance trends, and making data-driven decisions. The Team Management KPI Dashboard in Google Sheets provides a ready-to-use solution for managers to monitor key team performance indicators (KPIs), compare them against targets, and analyze trends over time.Team Management KPI Dashboard in Google Sheets
In this article, we will explain the features, advantages, best practices, and frequently asked questions about this dashboard.Team Management KPI Dashboard in Google Sheets
What Is a Team Management KPI Dashboard?
A Team Management KPI Dashboard is a visual and interactive tool that consolidates key performance metrics of your team into a single Google Sheet. It allows managers to monitor performance, identify areas for improvement, and ensure alignment with organizational goals.
With this dashboard, you can:
-
Track MTD (Month-to-Date) and YTD (Year-to-Date) metrics
-
Compare actual numbers with targets and previous year data
-
Analyze KPIs by team, department, or role
-
Make informed decisions to enhance productivity and efficiency
Key Features of the Team Management KPI Dashboard4
Team Management KPI Dashboard in Google Sheets
This dashboard consists of 6 worksheets, each designed for a specific purpose:
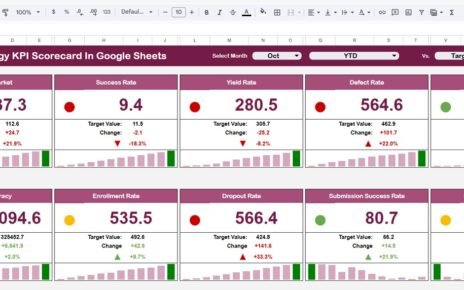
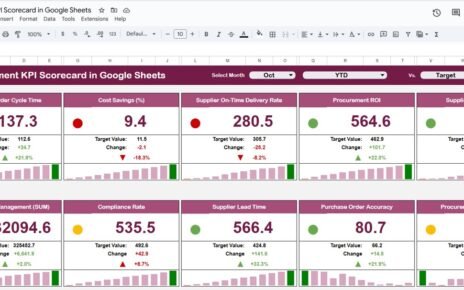
1. Dashboard Sheet Tab
The Dashboard Sheet is the main overview of all KPIs.
Key Features:
-
Month Selection (Range D3): Changes all numbers dynamically for the selected month
-
MTD Metrics: Actual, Target, Previous Year, with Target vs Actual and PY vs Actual comparisons using conditional formatting arrows
-
YTD Metrics: Year-to-date performance with the same comparisons and visual indicators
This sheet provides a comprehensive snapshot of team performance at a glance.

Team Management KPI Dashboard in Google Sheets
2. KPI Trend Sheet Tab
The KPI Trend Sheet provides detailed information for each KPI.
Key Features:
-
Select KPI from dropdown (Range C3)
-
Displays KPI Group, Unit, and Type (Upper-the-Better or Lower-the-Better)
-
Shows KPI formula and definition
-
Visualizes trends over time to analyze performance changes
This sheet allows managers to monitor specific KPIs and identify trends.

Team Management KPI Dashboard in Google Sheets
3. Actual Numbers Sheet Tab
-
Enter actual performance data for MTD and YTD for each KPI
-
Update the month in Range E1 to reflect correct data
-
Ensures the dashboard reflects real performance accurately

4. Target Sheet Tab
-
Enter monthly and YTD targets for each KPI
-
Facilitates comparison between planned performance and actual results
-
Helps identify gaps and take corrective action

Team Management KPI Dashboard in Google Sheets
5. Previous Year Numbers Sheet Tab
-
Enter previous year data for each KPI
-
Enables year-over-year comparison to track improvement or decline
-
Helps identify seasonal trends or recurring performance patterns

6. KPI Definition Sheet Tab
-
Enter KPI Name, Group, Unit, Formula, and Definition
-
Specify whether each KPI is Upper-the-Better (UTB) or Lower-the-Better (LTB)
-
Provides clarity on how each KPI is calculated and interpreted

Examples of KPIs in Team Management
Team Management KPI Dashboard in Google Sheets
Some key KPIs you can track using this dashboard include:
-
Task Completion Rate (%) – Percentage of tasks completed on time
-
Average Response Time (hrs) – Average time taken to respond to team requests
-
Employee Productivity Score – Measured based on deliverables and output quality
-
Team Attendance Rate (%) – Employee presence during working hours
-
Project Success Rate (%) – Completed projects meeting quality and deadline standards
-
Training Completion (%) – Percentage of team members completing mandatory training
Each KPI should include:
-
Unit of Measure (%, hours, count, etc.)
-
Formula (e.g., Tasks Completed ÷ Total Tasks × 100)
-
Performance Type (Upper-the-Better / Lower-the-Better)
Advantages of Using the Team Management KPI Dashboard
Team Management KPI Dashboard in Google Sheets
-
Centralized Data: All team metrics in a single Google Sheet
-
Real-Time Insights: Immediate reflection of updates in dashboards
-
Trend Analysis: Monitor MTD and YTD performance with visual cues
-
Identify Performance Gaps: Spot underperforming areas or employees
-
Data-Driven Decisions: Improve productivity by taking action based on KPIs
-
Customizable: Add or modify KPIs to match organizational objectives
Best Practices for Using the Dashboard
-
Update Data Regularly: Keep MTD and YTD metrics current
-
Use Conditional Formatting: Highlight KPIs that are under target or declining
-
Segment Data: Track performance by department, team, or role
-
Monitor Trends: Compare monthly and yearly performance for insights
-
Set Realistic Targets: Ensure KPI targets are achievable and aligned with goals
-
Review KPI Definitions: Ensure the team understands each metric and its calculation
How This Dashboard Helps Managers
Team Management KPI Dashboard in Google Sheets
-
Track Team Performance: Monitor efficiency and productivity
-
Improve Decision Making: Allocate resources based on KPI insights
-
Enhance Accountability: Assign responsibility and track completion rates
-
Optimize Processes: Identify bottlenecks or underperforming areas
-
Support Strategic Planning: Plan training, projects, and team development initiatives
Frequently Asked Questions (FAQs)
Q1: Can I add more KPIs to the dashboard?
Yes, the dashboard is fully customizable. You can add or remove KPIs as needed.
Q2: Can multiple managers update the dashboard simultaneously?
Yes, Google Sheets supports real-time collaboration for multiple users.
Q3: How often should I update the data?
Update MTD and YTD metrics at least monthly to track trends accurately.
Q4: Can this dashboard track performance by department or team?
Absolutely. You can filter data by department, role, or team for detailed insights.
Q5: What is the difference between Upper-the-Better and Lower-the-Better KPIs?
Upper-the-Better (UTB) improves as values increase (e.g., task completion %), while Lower-the-Better (LTB) improves as values decrease (e.g., average response time).
Conclusion
Team Management KPI Dashboard in Google Sheets
The Team Management KPI Dashboard in Google Sheets is a powerful tool for monitoring, analyzing, and optimizing team performance. By consolidating KPIs in one interactive sheet and providing MTD, YTD, and trend analysis, managers can make informed decisions, improve productivity, and enhance overall team efficiency.
Visit our YouTube channel to learn step-by-step video tutorials
Youtube.com/@NeotechNavigators
Watch the step-by-step video Demo: