Telecommunications infrastructure forms the backbone of modern connectivity. Network availability, uptime, capacity, and service reliability directly impact customer satisfaction and business growth. However, when infrastructure KPIs remain scattered across multiple spreadsheets or reports, teams struggle to track performance accurately. As a result, network issues stay hidden, and corrective actions get delayed.
That is exactly where a Telecommunications Infrastructure KPI Dashboard in Google Sheets becomes extremely valuable.
A Telecommunications Infrastructure KPI Dashboard in Google Sheets provides a centralized, interactive, and ready-to-use system to monitor infrastructure-related KPIs. Moreover, it helps telecom teams analyze monthly and yearly performance using automated calculations, visual indicators, and trend analysis.
In this detailed article, you will learn what a Telecommunications Infrastructure KPI Dashboard in Google Sheets is, how it works, its key features, advantages, best practices, and how telecom organizations can use it effectively to improve infrastructure performance.
What Is a Telecommunications Infrastructure KPI Dashboard in Google Sheets?
A Telecommunications Infrastructure KPI Dashboard in Google Sheets is a structured performance tracking template designed to monitor critical telecom infrastructure KPIs in one place.
Instead of manually compiling reports, this dashboard consolidates actual values, targets, and previous year data into dynamic visuals. Because it runs on Google Sheets, teams can collaborate in real time, update data easily, and access the dashboard from anywhere.
Most importantly, this dashboard clearly defines every KPI with its unit, formula, definition, and type (Lower the Better or Upper the Better), which ensures consistent KPI interpretation across teams.
Why Do Telecommunications Infrastructure Teams Need a KPI Dashboard?
Click to Buy Telecommunications Infrastructure KPI Dashboard in Google Sheets
Telecom infrastructure teams manage complex systems such as towers, fiber networks, switches, and data centers. Therefore, even small performance drops can lead to service disruptions and revenue loss.
Without a KPI dashboard:
- Infrastructure KPIs remain fragmented
- Performance reviews take too much time
- Trends remain unclear
- Decisions rely on assumptions
However, with a Telecommunications Infrastructure KPI Dashboard in Google Sheets:
- KPIs become measurable and visible
- Monthly and yearly performance becomes clear
- Trends highlight improvement areas
- Decisions become data-driven
As a result, infrastructure teams stay proactive instead of reactive.
How Does the Telecommunications Infrastructure KPI Dashboard in Google Sheets Work?
The dashboard works by combining structured input sheets with automated calculations and dynamic visuals.
Here is how it works step by step:
- Users enter actual KPI values in the data input sheet
- Target and previous year values support comparison
- The dashboard calculates MTD and YTD metrics automatically
- Conditional formatting highlights performance
- Trend charts show KPI movement over time
Because everything updates automatically, users avoid manual errors and save valuable time.
What KPIs Are Tracked in This Telecommunications Infrastructure Dashboard?
Click to Buy Telecommunications Infrastructure KPI Dashboard in Google Sheets
This dashboard tracks infrastructure-focused KPIs such as:
- Network uptime percentage
- Downtime duration
- Mean time to repair (MTTR)
- Capacity utilization
- Equipment availability
- Fault resolution rate
- Maintenance compliance
Each KPI includes:
- KPI Group
- Unit of measurement
- Formula
- KPI definition
- KPI type (Lower the Better or Upper the Better)
This structure ensures complete clarity and consistency.
What Are the Key Worksheets in the Telecommunications Infrastructure KPI Dashboard in Google Sheets?
This dashboard consists of 6 structured worksheets, each designed for a specific purpose.
Let’s explore them one by one.
How Does the Dashboard Sheet Tab Display Infrastructure Performance?
Click to Buy Telecommunications Infrastructure KPI Dashboard in Google Sheets
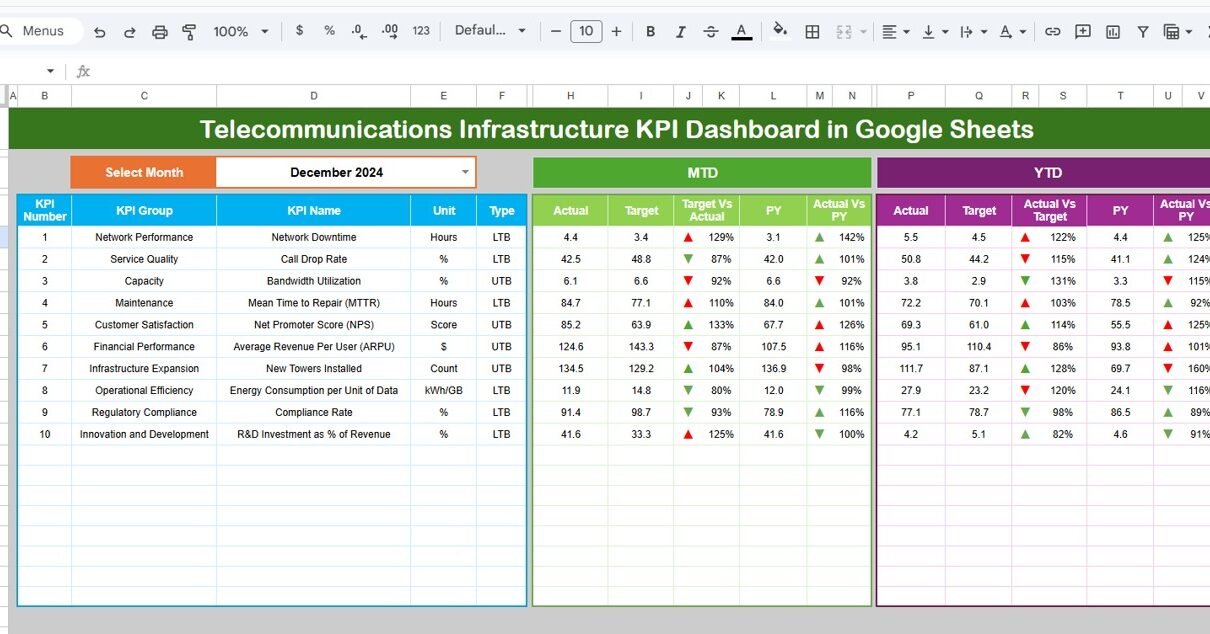
The Dashboard Sheet Tab serves as the main performance view.
Key Features of the Dashboard Sheet:
-
Month selection drop-down in cell D3
-
Automatic update of all KPIs based on the selected month
-
Clear display of MTD and YTD performance
KPIs Shown on the Dashboard:
MTD Section
- Actual
- Target
- Previous Year
- Target vs Actual
- Previous Year vs Actual
YTD Section
- Actual
- Target
- Previous Year
- Target vs Actual
- Previous Year vs Actual
Conditional formatting with up and down arrows makes performance interpretation quick and simple.

Click to Buy Telecommunications Infrastructure KPI Dashboard in Google Sheets
How Does the KPI Trend Sheet Help Analyze Performance Over Time?
The KPI Trend Sheet Tab focuses on individual KPI analysis.
Key Features of the KPI Trend Sheet:
-
KPI selection drop-down in cell C3
Displays:
- KPI Group
- Unit of KPI
- KPI Type (Lower the Better / Upper the Better)
- KPI Formula
- KPI Definition
This sheet helps users understand how each KPI behaves over time and identify improvement or decline patterns.

Click to Buy Telecommunications Infrastructure KPI Dashboard in Google Sheets
How Do You Enter Actual KPI Data in the Dashboard?
The Actual Number Sheet Tab acts as the main data entry sheet.
What Users Do in This Sheet:
-
Enter MTD and YTD actual values
-
Select the starting month of the year in cell E1
-
Update monthly values easily
Because formulas remain protected, users only focus on entering correct data.

Click to Buy Telecommunications Infrastructure KPI Dashboard in Google Sheets
How Are KPI Targets Managed in This Dashboard?
The Target Sheet Tab allows organizations to define infrastructure performance goals.
Target Sheet Capabilities:
-
Enter MTD target values
-
Enter YTD target values
-
Align infrastructure KPIs with operational benchmarks
This approach ensures that infrastructure performance stays aligned with business objectives.

Why Is the Previous Year Number Sheet Important?
The Previous Year Number Sheet Tab stores historical KPI data.
Benefits of This Sheet:
-
Enables year-over-year performance comparison
-
Helps identify long-term improvement or decline
-
Supports audits and performance reviews
Because historical data stays structured, trend analysis becomes more reliable.

Click to Buy Telecommunications Infrastructure KPI Dashboard in Google Sheets
How Does the KPI Definition Sheet Improve KPI Clarity?
The KPI Definition Sheet Tab acts as a reference guide.
Information Captured in This Sheet:
- KPI Name
- KPI Group
- Unit
- Formula
- KPI Definition
As a result, every stakeholder interprets KPIs the same way, which reduces confusion and reporting errors.

Click to Buy Telecommunications Infrastructure KPI Dashboard in Google Sheets
Advantages of Telecommunications Infrastructure KPI Dashboard in Google Sheets
Using a Telecommunications Infrastructure KPI Dashboard in Google Sheets offers several advantages.
Key Advantages:
- Centralized infrastructure KPI tracking
- Automated MTD and YTD calculations
- Clear trend analysis
- Visual performance indicators
- Real-time team collaboration
- No additional software required
- Cloud-based access
Most importantly, it improves infrastructure visibility and accountability.
How Does This Dashboard Improve Infrastructure Decision-Making?
Infrastructure decisions require accurate and timely data.
This dashboard helps by:
- Highlighting underperforming KPIs instantly
- Comparing actual performance with targets
- Showing trends instead of static numbers
- Supporting faster corrective actions
As a result, infrastructure teams make smarter and faster decisions.
Best Practices for the Telecommunications Infrastructure KPI Dashboard in Google Sheets
Click to Buy Telecommunications Infrastructure KPI Dashboard in Google Sheets
To maximize value, organizations should follow proven best practices.
Recommended Best Practices:
- Define infrastructure KPIs clearly before use
- Maintain consistent units and formulas
- Update data on a fixed monthly schedule
- Review both MTD and YTD trends
- Align targets with operational benchmarks
- Keep KPI definitions updated
- Train users on correct data entry
Following these practices ensures long-term dashboard accuracy and reliability.
Who Should Use a Telecommunications Infrastructure KPI Dashboard in Google Sheets?
This dashboard works well for:
- Telecom infrastructure teams
- Network operations managers
- Engineering and maintenance teams
- Performance and analytics teams
- Senior management
Because it uses Google Sheets, both technical and non-technical users can use it comfortably.
Can the Telecommunications Infrastructure KPI Dashboard Be Customized?
Click to Buy Telecommunications Infrastructure KPI Dashboard in Google Sheets
Yes, customization remains one of its biggest strengths.
Organizations can:
- Add or remove KPIs
- Modify formulas and targets
- Adjust conditional formatting
- Expand trend analysis
Therefore, the dashboard grows with changing infrastructure needs.
Conclusion: Why Choose a Telecommunications Infrastructure KPI Dashboard in Google Sheets?
A Telecommunications Infrastructure KPI Dashboard in Google Sheets provides a practical and powerful way to monitor infrastructure performance. It replaces fragmented reports with a structured, visual, and interactive system.
By using this dashboard, telecom organizations gain clarity, improve accountability, and ensure reliable infrastructure performance without complex tools.
In short, it turns infrastructure KPI tracking into a strategic advantage.
Frequently Asked Questions (FAQs)
Click to Buy Telecommunications Infrastructure KPI Dashboard in Google Sheets
What is a Telecommunications Infrastructure KPI Dashboard in Google Sheets?
It is a Google Sheets-based dashboard used to track infrastructure KPIs using MTD, YTD, targets, and trend analysis.
Can I customize the KPIs in this dashboard?
Yes, users can easily add, modify, or remove KPIs based on business needs.
Does this dashboard support monthly and yearly analysis?
Yes, it provides both MTD and YTD performance views.
Is this dashboard suitable for large telecom networks?
Yes, it works well for both small and large telecom infrastructure teams.
Does the dashboard include KPI definitions and formulas?
Yes, every KPI includes unit, formula, definition, and KPI type.
Visit our YouTube channel to learn step-by-step video tutorials
Youtube.com/@NeotechNavigators
Watch the step-by-step video tutorial:
Click to Buy Telecommunications Infrastructure KPI Dashboard in Google Sheets