Transportation businesses operate in a fast-paced environment. Deliveries must reach on time. Fuel costs fluctuate. Driver performance impacts service quality. Therefore, transportation companies must monitor KPIs continuously.
However, many companies still track performance manually. As a result, they struggle to compare monthly performance. They fail to identify weak areas quickly. Moreover, they cannot analyze year-to-date progress effectively.
So, how can you track transportation performance in a structured and dynamic way?
Transportation KPI Scorecard in Google Sheets
You need a Transportation KPI Scorecard in Google Sheets.
This ready-to-use template allows you to monitor 10 important KPIs. You can select any month from the dropdown. Then, the entire scorecard updates automatically. In addition, traffic lights change color instantly. Up and down arrows show performance change percentage clearly.
In this detailed guide, you will learn:
- What a Transportation KPI Scorecard in Google Sheets is
- All 10 KPIs with unit, formula, and KPI type
- Detailed explanation of all sheets
- Advantages of Transportation KPI Scorecard
- Best Practices for the Transportation KPI Scorecard
- Frequently Asked Questions with Answers
Let us explore everything step by step.
What Is a Transportation KPI Scorecard in Google Sheets?
Click to Buy Transportation KPI Scorecard in Google Sheets
A Transportation KPI Scorecard in Google Sheets is a structured performance tracking tool designed for:
- Logistics companies
- Freight operators
- Courier services
- Fleet transport companies
- Distribution networks
It helps you:
- Monitor Monthly (MTD) performance
- Track Year-to-Date (YTD) performance
- Compare Target vs Actual
- View percentage change
- Visualize performance with traffic lights
Moreover, Google Sheets allows real-time collaboration. Therefore, managers and operations teams can update and monitor performance together.
Explanation of All Sheets in the Scorecard
This Transportation KPI Scorecard in Google Sheets includes structured sheets for complete KPI management.
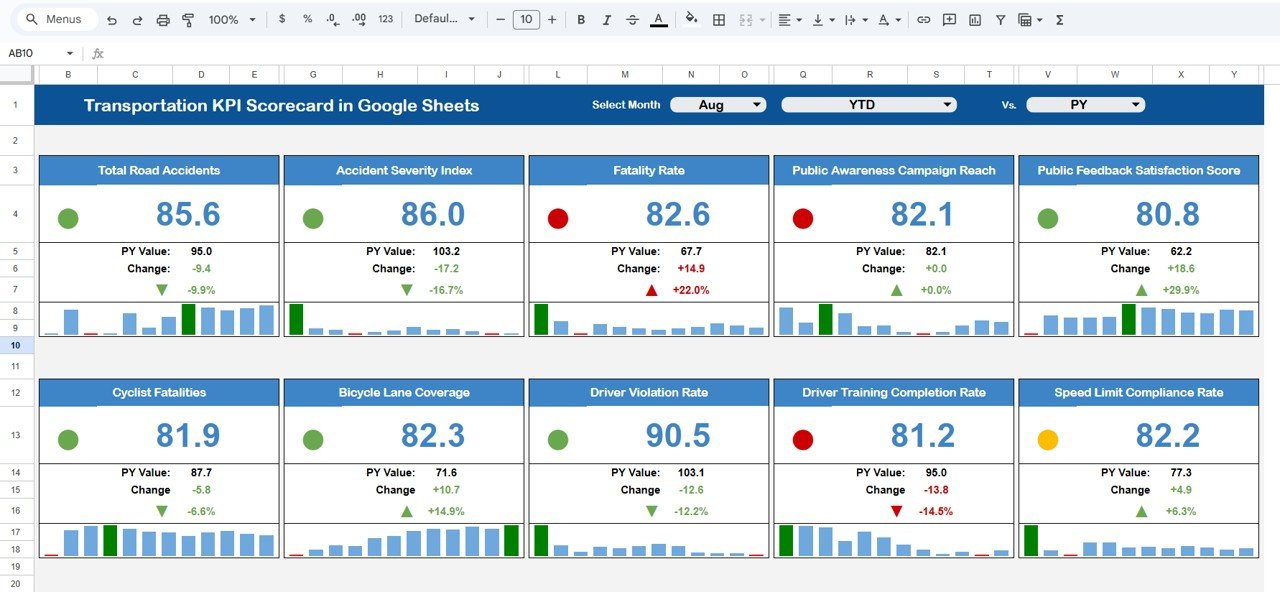
Main Dashboard Sheet – Monthly & Yearly Scorecard
Click to Buy Transportation KPI Scorecard in Google Sheets
This is the central performance page.
Key Features:
- Month dropdown at the top
- Automatic number update when month changes
- Traffic light indicators (Red, Yellow, Green)
- Up and Down arrows showing percentage change
- MTD and YTD toggle buttons
When you select a month, the dashboard becomes a monthly scorecard. When you switch to another month, all KPI numbers update automatically.
Moreover, you can click:
-
MTD to view monthly performance
-
YTD to view yearly cumulative performance
Thus, decision-makers can review performance quickly.
Click to Buy Transportation KPI Scorecard in Google Sheets
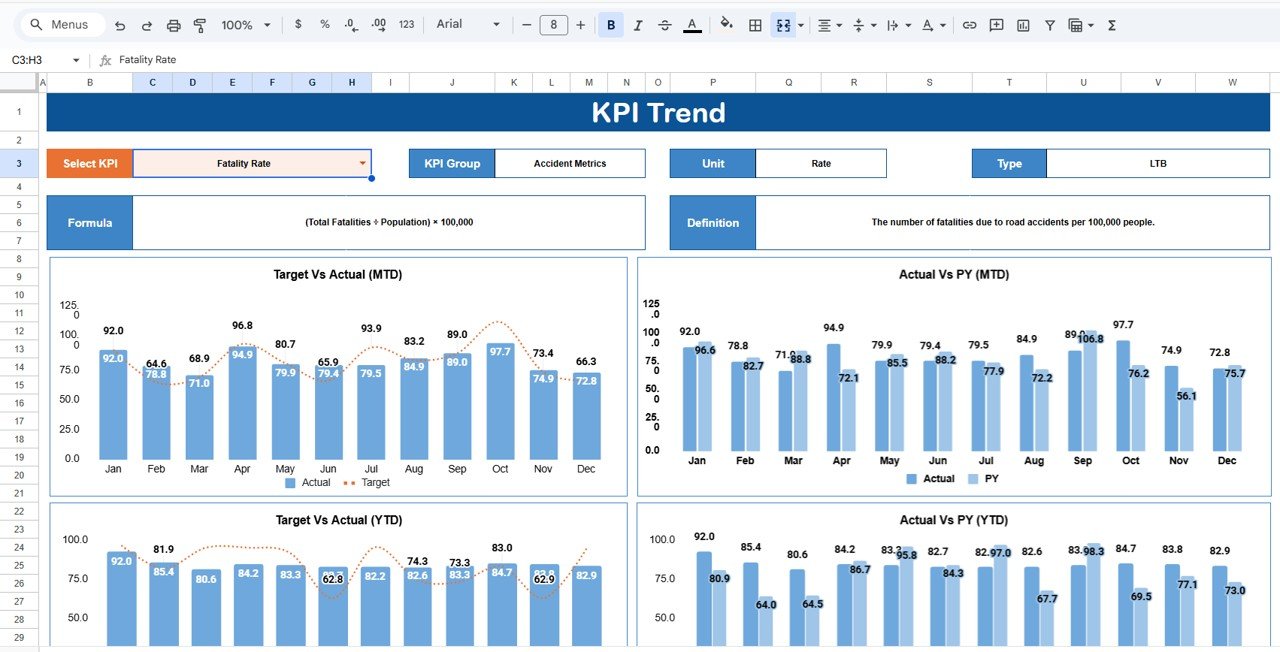
2️⃣ Trend Sheet Tab
In this sheet, you can select the KPI name from dropdown available in Range C3.
The sheet displays:
- KPI Group
- KPI Unit
- KPI Type (Lower the Better / Upper the Better)
- KPI Formula
- KPI Definition
- Monthly Trend Chart
Therefore, you can analyze how a KPI behaves over time.
Click to Buy Transportation KPI Scorecard in Google Sheets
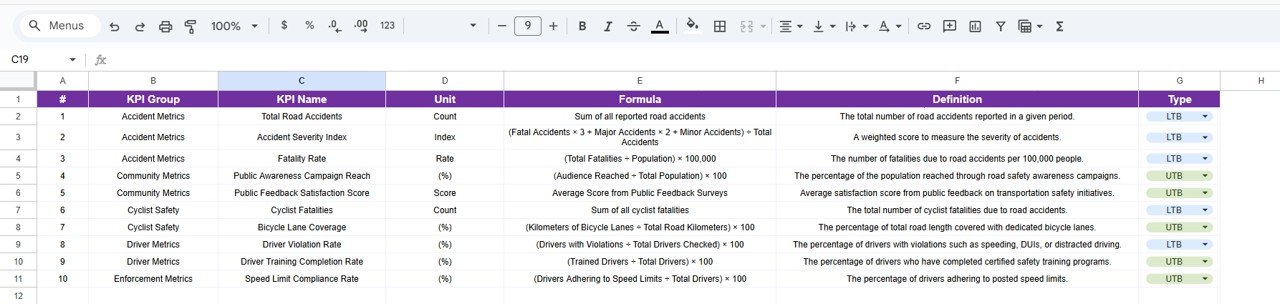
3️⃣ KPI Definition Sheet Tab
This sheet acts as the KPI master file.
You must enter:
- KPI Name
- KPI Group
- Unit
- Formula
- KPI Definition
This structure ensures clarity and transparency. Moreover, it helps teams understand KPI logic clearly.
Click to Buy Transportation KPI Scorecard in Google Sheets
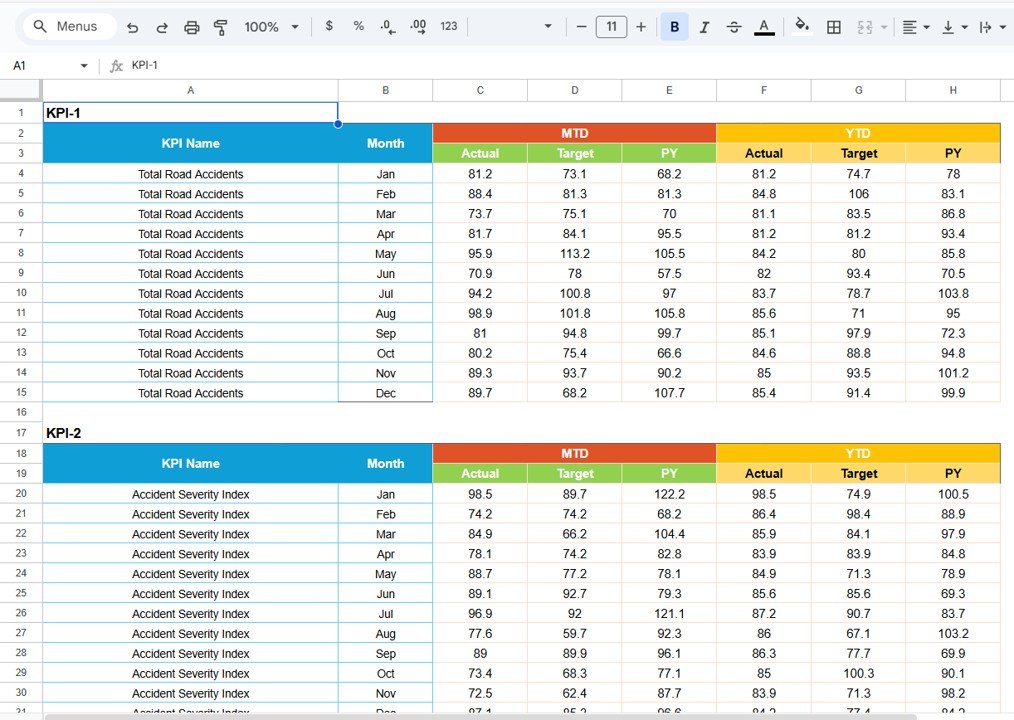
4️⃣ Data Input Sheet Tab
In this sheet, you input raw monthly data.
For example:
- Total Deliveries
- On-Time Deliveries
- Fuel Consumed
- Distance Covered
- Operating Cost
- Revenue
- Accidents
- Maintenance Cost
The dashboard automatically calculates KPI values using formulas.
Click to Buy Transportation KPI Scorecard in Google Sheets
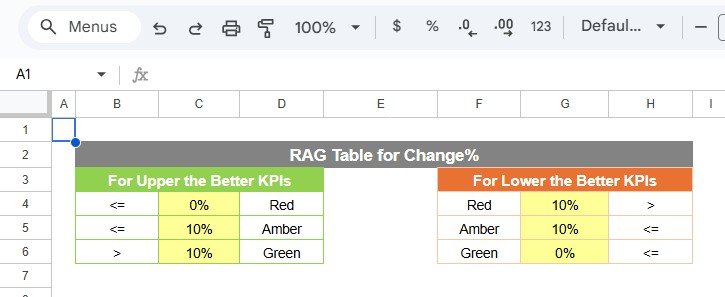
Colour Settings Sheet
This sheet controls traffic light logic.
For example:
- Green if KPI meets or exceeds target
- Yellow if KPI slightly misses target
- Red if KPI significantly misses target
Moreover, the sheet controls arrow logic for:
- Positive performance
- Negative performance
Thus, visual indicators remain consistent and accurate.
Click to Buy Transportation KPI Scorecard in Google Sheets
Advantages of Transportation KPI Scorecard in Google Sheets
Using this scorecard offers powerful advantages.
1. Instant Performance Monitoring
Managers can detect issues immediately.
2. Visual Performance Indicators
Traffic lights make performance easy to understand.
3. Monthly & Yearly Comparison
You can track short-term and long-term progress.
4. Improved Cost Control
You can monitor fuel, maintenance, and operating cost.
Best Practices for the Transportation KPI Scorecard
To maximize effectiveness, follow these best practices.
1. Update Data Regularly
Enter monthly data consistently.
2. Define KPIs Clearly
Always document formula and KPI type.
3. Monitor Lower-the-Better KPIs Closely
Accident rate and cost per KM require strict monitoring.
4. Use Trend Analysis
Review KPI trends quarterly.
5. Align KPIs with Business Goals
Ensure KPIs match operational strategy.
6. Maintain Data Accuracy
Incorrect data leads to incorrect insights.
Conclusion
Click to Buy Transportation KPI Scorecard in Google Sheets
Transportation businesses demand precision and control. Companies must manage cost, efficiency, safety, and service quality simultaneously.
However, without a structured KPI scorecard, tracking performance becomes complicated.
The Transportation KPI Scorecard in Google Sheets provides a smart solution.
It delivers:
- Automatic monthly updates
- MTD and YTD views
- Traffic light indicators
- Percentage change arrows
- Clear KPI definitions
- Real-time collaboration
Therefore, transportation managers can optimize operations, reduce costs, and improve service quality confidently.
Frequently Asked Questions with Answers
Click to Buy Transportation KPI Scorecard in Google Sheets
1. Can I customize KPIs?
Yes. You can add or modify KPIs in the KPI Definition sheet.
2. Does the month dropdown update everything automatically?
Yes. Once you select a month, all KPI numbers and indicators change automatically.
3. Can I track yearly performance?
Yes. You can switch to YTD view to see cumulative yearly performance.
4. Is this scorecard suitable for small transport companies?
Yes. It works for both small and large transportation businesses.
5. Can multiple users access the scorecard?
Yes. Google Sheets supports real-time collaboration.
Visit our YouTube channel to learn step-by-step video tutorials
Youtube.com/@NeotechNavigators
Watch the step-by-step video tutorial: