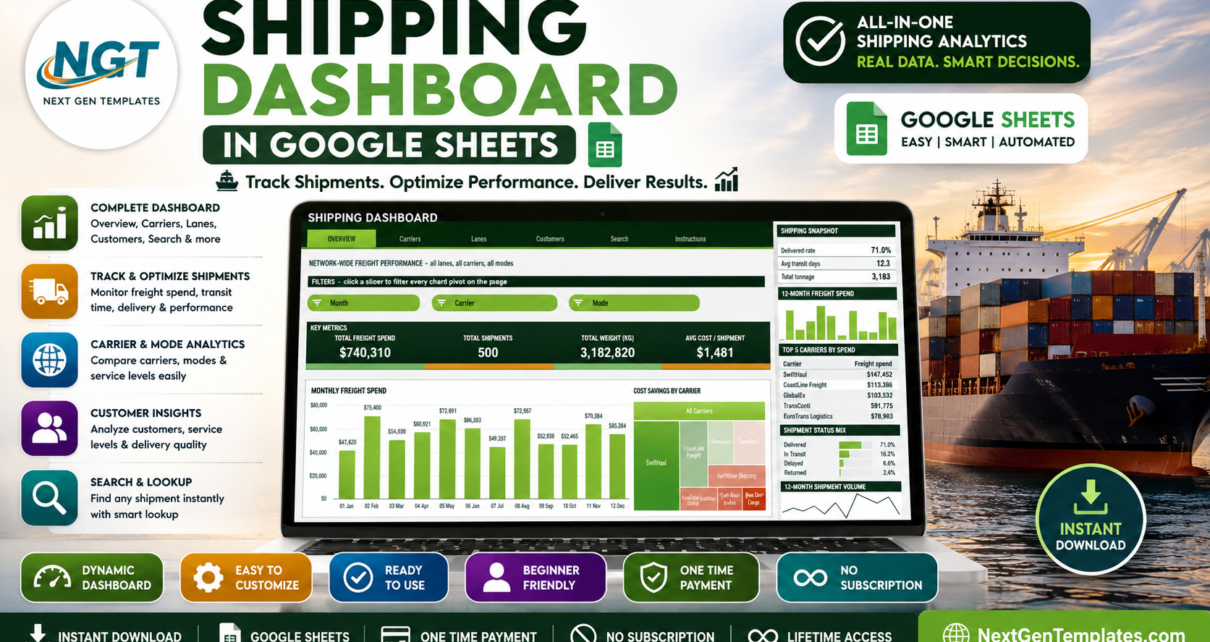
A five-page Shipping Dashboard in Google Sheets built on native pivot tables and slicers – freight spend, carrier mix, trade lanes, customer delivery quality and a shipment-ID lookup, with 500 sample shipments loaded and room for 1,000 rows.
Online Tutorial for Data Analysis and Automation
A five-page Shipping Dashboard in Google Sheets built on native pivot tables and slicers – freight spend, carrier mix, trade lanes, customer delivery quality and a shipment-ID lookup, with 500 sample shipments loaded and room for 1,000 rows.
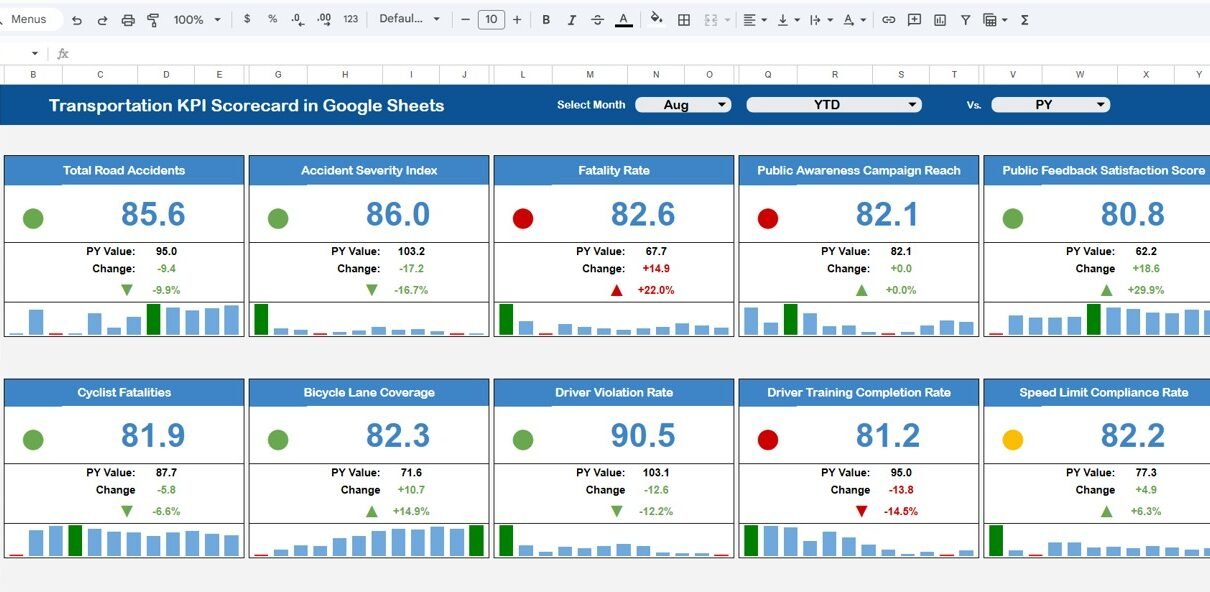
Transportation businesses operate in a fast-paced environment. Deliveries must reach on time. Fuel costs fluctuate. Driver performance impacts service quality. Therefore, transportation companies must monitor KPIs continuously. However, many companies still track performance manually. As a result, they struggle to compare monthly performance. They fail to identify weak areas quickly. Moreover, they cannot analyze year-to-date […]