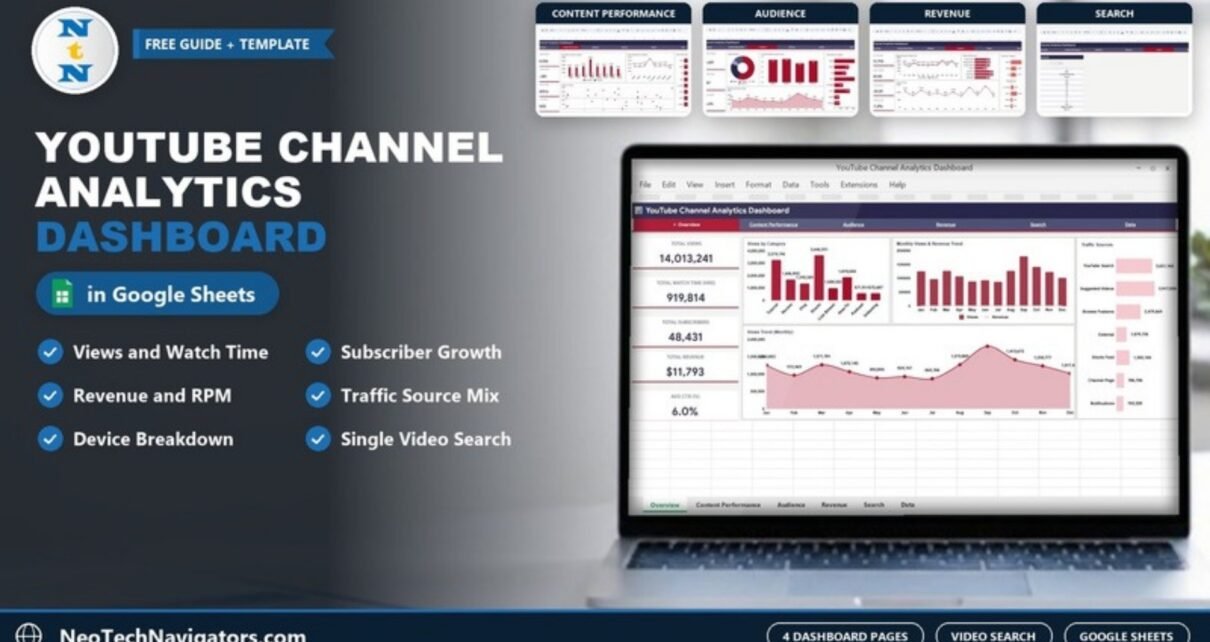
The YouTube Channel Analytics Dashboard in Google Sheets puts your channel’s views, watch time, subscribers, revenue, click-through rate and RPM on four linked dashboard pages, with a video search sheet and a single data sheet behind them.
It is made for YouTube creators, small media teams and marketers who manage a channel for a brand and want to analyse performance by category, traffic source, device and month in a spreadsheet they control. The file contains six sheets: Overview, Content Performance, Audience, Revenue, Search and Data, with a navigation bar at the top of each dashboard page.
This guide walks through each page with the real figures from the sample file, shows how the main metrics are calculated, and explains how to load your own exported data.
🎥 Watch the Video Tutorial
Get the YouTube Channel Analytics Dashboard
Why Track YouTube Analytics in Google Sheets?
YouTube Studio is excellent for day-to-day checks, but it is harder to combine your own categories, compare content types side by side, or share a simple summary with a client or manager. A spreadsheet dashboard lets you tag every video with your own category (Tutorial, Review, Vlog and so on), keep the history you choose, and build one view that answers questions such as “which content type earns the most per thousand views?” or “do Shorts actually bring subscribers?”
The sample file covers 500 videos with 14,013,241 total views, 919,814 hours of watch time and $11,793 in revenue.
Overview Page
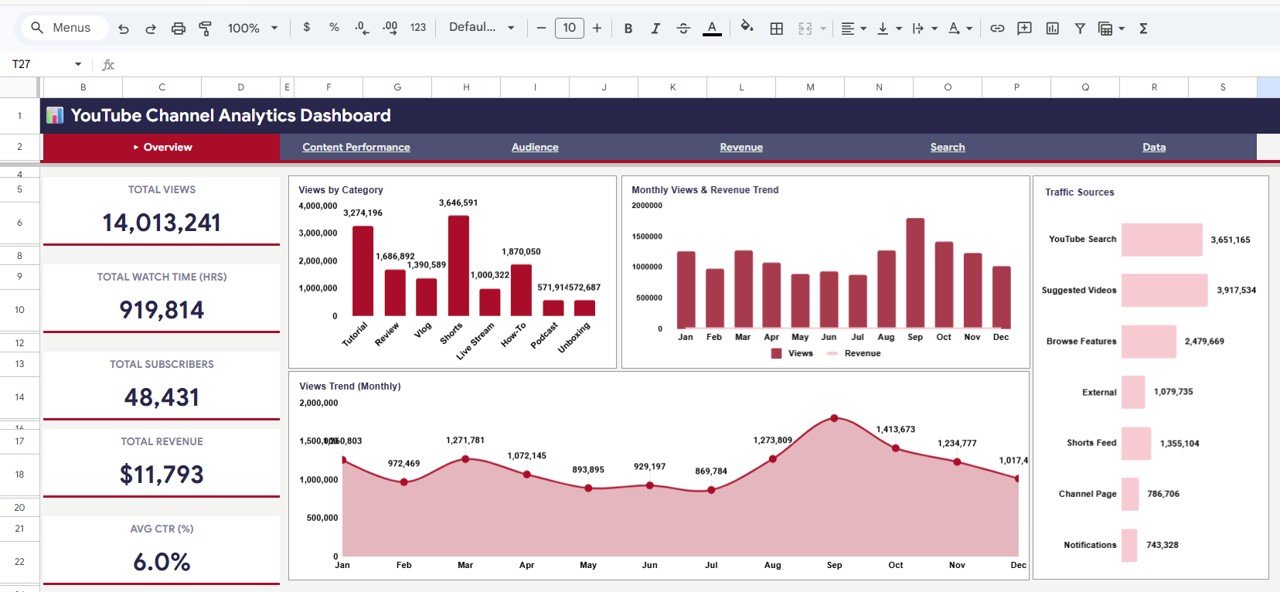
The Overview is the channel health check. Five KPI cards run down the left side:
- Total Views: 14,013,241
- Total Watch Time (Hrs): 919,814
- Total Subscribers: 48,431
- Total Revenue: $11,793
- Avg CTR (%): 6.0%
Four charts sit beside them:
- Views by Category: Shorts (3,646,591) and Tutorial (3,274,196) bring the most views.
- Monthly Views & Revenue Trend: monthly views as columns with revenue on the same axis. Because revenue is in the hundreds of dollars and views are in the hundreds of thousands, the revenue line sits close to zero; read revenue on the Revenue page instead.
- Views Trend (Monthly): September is the peak month in the sample.
- Traffic Sources: Suggested Videos (3,917,534) narrowly beats YouTube Search (3,651,165), followed by Browse Features, Shorts Feed, External, Channel Page and Notifications.
Content Performance Page
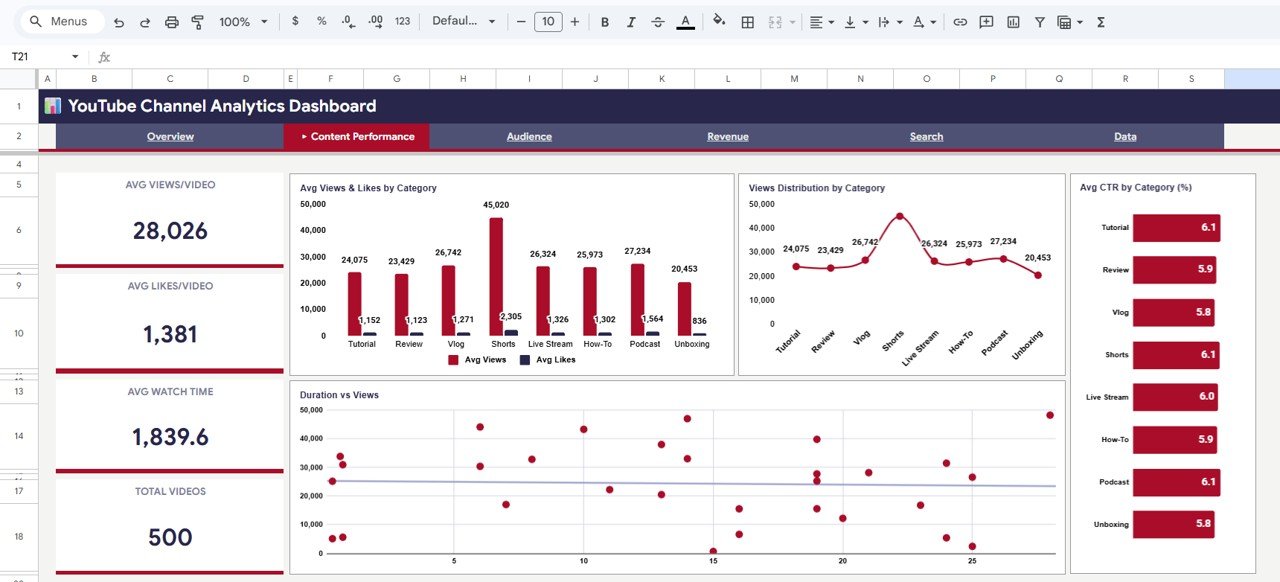
This page compares content types. KPI cards: Avg Views/Video (28,026), Avg Likes/Video (1,381), Avg Watch Time (1,839.6 hours per video) and Total Videos (500). Charts:
- Avg Views & Likes by Category: Shorts average 45,020 views per video, well ahead of every other category.
- Views Distribution by Category: the same averages as a line, which makes the Shorts spike obvious.
- Avg CTR by Category (%): Tutorial, Shorts and Podcast all sit at 6.1%.
- Duration vs Views: a scatter chart of video length (minutes) against views with a trend line, useful for checking whether longer videos earn more views on your channel.
Audience Page
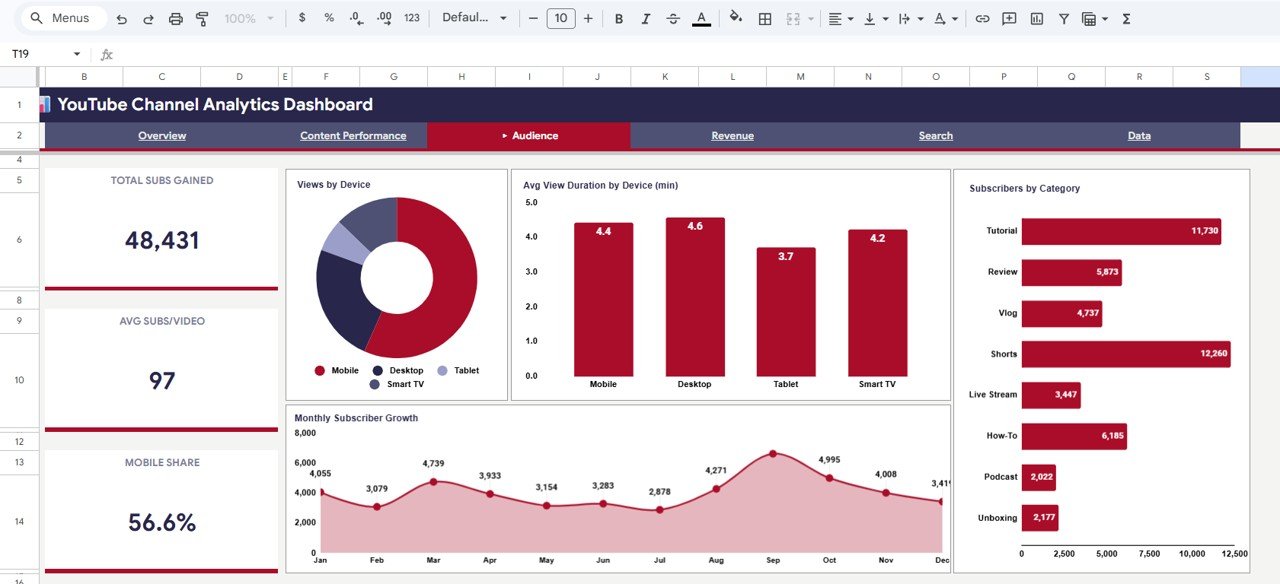
The Audience page shows how people watch. KPI cards: Total Subs Gained (48,431), Avg Subs/Video (97) and Mobile Share (56.6%). Charts:
- Views by Device: Mobile, Desktop, Tablet and Smart TV.
- Avg View Duration by Device (min): Desktop is highest at 4.6 minutes, Tablet lowest at 3.7.
- Monthly Subscriber Growth: subscribers gained per month, peaking in September.
- Subscribers by Category: Shorts (12,260) and Tutorial (11,730) bring in the most subscribers.
Revenue Page
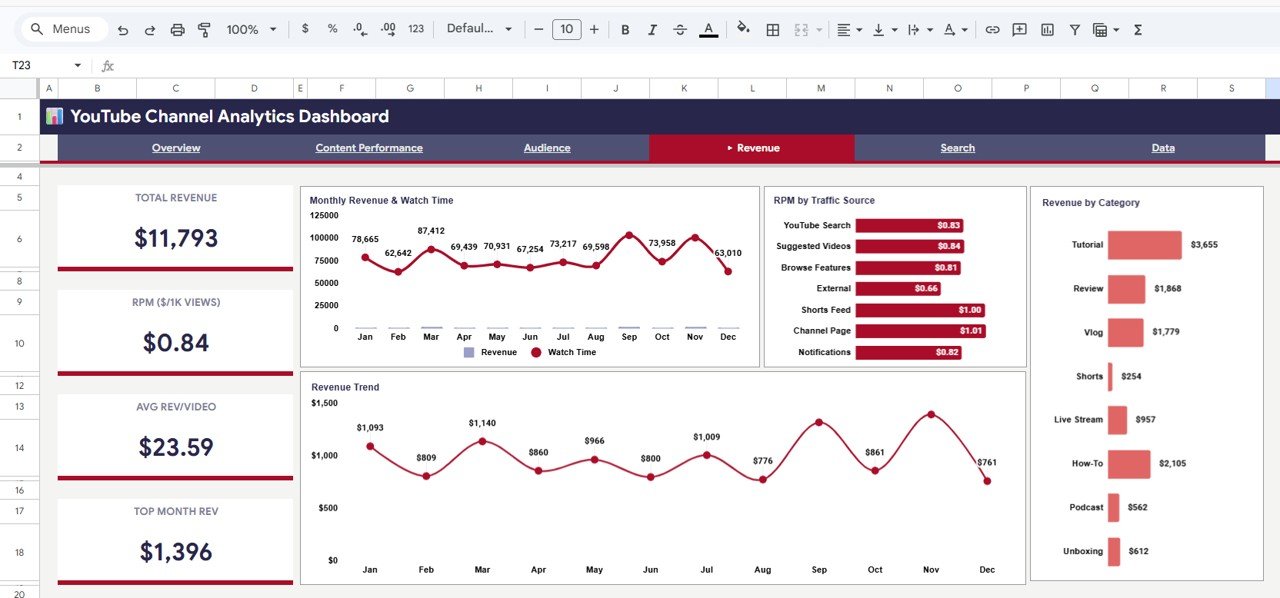
KPI cards: Total Revenue ($11,793), RPM ($/1K Views) ($0.84), Avg Rev/Video ($23.59) and Top Month Rev ($1,396). Charts:
- Monthly Revenue & Watch Time
- RPM by Traffic Source: Channel Page ($1.01) and Shorts Feed ($1.00) have the highest RPM in the sample; External is lowest ($0.66).
- Revenue by Category: Tutorial earns the most ($3,655), while Shorts earn only $254 despite their high views.
- Revenue Trend: monthly revenue across the year.
How the Main Metrics Are Calculated
You can reproduce the sample cards from the totals, which is a good way to check your own data after loading it:
| Metric | What it measures | Calculation | Sample result | Better when |
|---|---|---|---|---|
| Avg Views/Video | Typical reach per upload | Total Views ÷ Total Videos | 14,013,241 ÷ 500 = 28,026 | Higher |
| Avg Subs/Video | Subscribers each video brings in | Total Subs Gained ÷ Total Videos | 48,431 ÷ 500 ≈ 97 | Higher |
| RPM ($/1K Views) | Revenue per 1,000 views | Total Revenue ÷ Total Views × 1,000 | 11,793 ÷ 14,013,241 × 1,000 ≈ $0.84 | Higher |
| Avg Rev/Video | Earnings per upload | Total Revenue ÷ Total Videos | 11,793 ÷ 500 ≈ $23.59 | Higher |
| Avg Watch Time | Watch hours per video | Total Watch Time (Hrs) ÷ Total Videos | 919,814 ÷ 500 ≈ 1,839.6 | Higher |
The worked example shows an important insight from the sample: Shorts bring the most views and subscribers but very little revenue, while Tutorials balance strong views with the highest earnings. A creator planning next quarter’s content would see that more Tutorials grow income, while Shorts mainly grow the audience.
Search Sheet
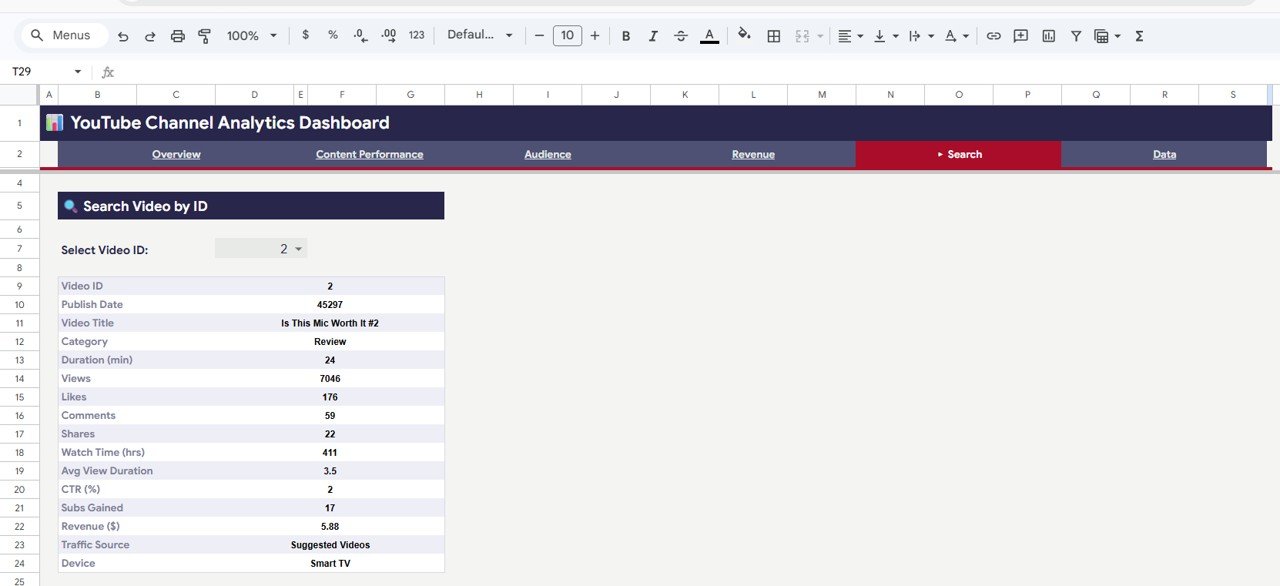
The Search sheet has a Select Video ID drop-down. Pick an ID and it returns that video’s Publish Date, Video Title, Category, Duration (min), Views, Likes, Comments, Shares, Watch Time (hrs), Avg View Duration, CTR (%), Subs Gained, Revenue ($), Traffic Source and Device. In the screenshot, Video ID 2 (“Is This Mic Worth It #2”, a Review) has 7,046 views and $5.88 revenue.
Tip: if the Publish Date shows a number such as 45297 instead of a date, select the cell and apply Format > Number > Date.
Data Sheet
Every page reads from the Data sheet. Its columns are: Video ID, Publish Date, Video Title, Category, Duration (min), Views, Likes, Comments, Shares, Watch Time (hrs), Avg View Duration (min), CTR (%), Subscribers Gained, Revenue ($), Traffic Source, Device Type, Month and Total (a helper count column).
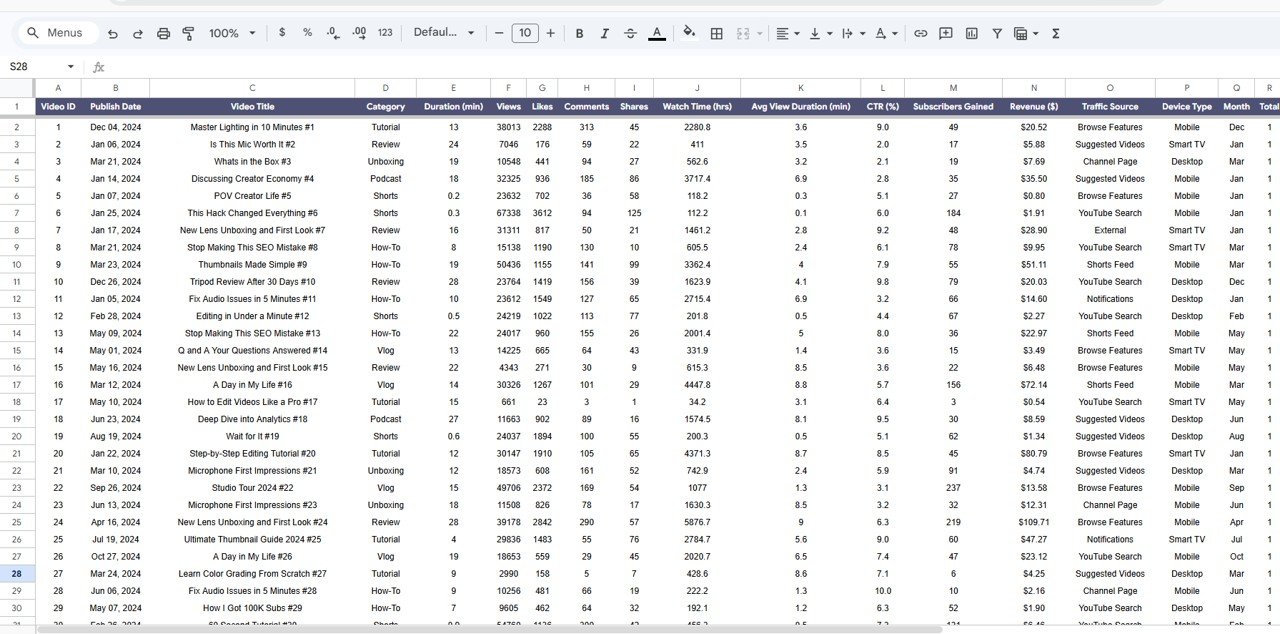
How to Load Your Channel Data into the YouTube Channel Analytics Dashboard in Google Sheets
- Make your own copy of the Google Sheets file.
- In YouTube Studio, open Analytics > Advanced mode, choose the content and date range you want, and export the table.
- Arrange your export into the Data sheet’s column order. Add your own Category label to each video.
- YouTube’s standard export does not give one traffic source or device per video, so fill those columns with the main source and device for each video, or use one consistent value if you do not track them.
- Paste your rows over the sample data, keeping the header row.
- Check that Total Videos on the Content Performance page matches your row count, and that Total Views matches YouTube Studio for the same period.
- Repeat the export monthly and append new videos.
If you want to learn how the summaries behind these charts work, the Pivot Tables & Dashboards course on NextGenTemplates Academy explains them in plain steps.
Real-World Use Cases
Content planning for a solo creator
Compare Revenue by Category with Subscribers by Category to decide the mix of growth content and income content for the next month.
Monthly client report for an agency
An agency managing a brand channel can share the Overview and Revenue pages as a view-only link instead of building slides every month.
Thumbnail and title testing
Use Avg CTR by Category to spot content types where packaging is weak, then check individual videos on the Search sheet.
Best Practices
- Keep category names consistent; “How-To” and “How To” will show as two categories.
- Update on a fixed schedule, such as the first week of every month.
- Compare like with like: Shorts and long videos behave differently, so read their numbers separately.
- Remember that “Total Subscribers” in this file is the sum of Subscribers Gained in your data, not your channel’s lifetime subscriber count.
Limitations: Who Should Not Use It
- It does not connect to the YouTube API; data is exported and pasted manually.
- Per-video traffic source and device are single values, which simplifies YouTube’s more detailed breakdowns.
- Channels that need real-time numbers or audience demographics should keep using YouTube Studio alongside it.
Other formats and related trackers: the YouTube Channel Analytics Dashboard in HTML, the YouTube Channel Performance Tracker in Google Sheets, the YouTube Video Ideas & Upload Tracker in Google Sheets and the Social Media Performance Dashboard in Google Sheets. For Power BI users there is also a YouTube Channel Analytics Dashboard in Power BI.
Frequently Asked Questions
What metrics does the YouTube Channel Analytics Dashboard track?
Total Views, Total Watch Time (Hrs), Total Subscribers, Total Revenue, Avg CTR (%), Avg Views/Video, Avg Likes/Video, Avg Watch Time, Total Videos, Total Subs Gained, Avg Subs/Video, Mobile Share, RPM ($/1K Views), Avg Rev/Video and Top Month Rev.
How is RPM calculated?
Total Revenue divided by Total Views, multiplied by 1,000. In the sample: $11,793 ÷ 14,013,241 × 1,000 ≈ $0.84.
Can I use my own video categories?
Yes. The charts read whatever categories are in the Category column of the Data sheet.
Does it pull data from YouTube automatically?
No. You export data from YouTube Studio and paste it into the Data sheet. That keeps the file simple and free of scripts.
Can I look up a single video?
Yes. The Search sheet shows every field for the Video ID you select.
Can I share it with my team?
Yes. It is a normal Google Sheets file, so you can share it with view or edit access.
Wrapping Up
The YouTube Channel Analytics Dashboard in Google Sheets gives you four focused pages, a video search and one data table to understand which content grows your audience and which content pays. Export your data, paste it in, check the totals against YouTube Studio, and review the Overview and Revenue pages each month.
Get the YouTube Channel Analytics Dashboard
📅 Last updated: October 2026