Managing corporate audits effectively requires visibility into compliance scores, risks, costs, and audit outcomes. However, many organizations still rely on static reports and disconnected spreadsheets, which makes audit tracking slow and inefficient.
That is exactly why the Corporate Audit Dashboard in Google Sheets is a powerful and practical solution.
This ready-to-use dashboard transforms raw audit data into meaningful insights through KPI cards, interactive charts, and search functionality—helping audit teams, compliance officers, and leadership make informed decisions from one centralized Google Sheets file.
What Is a Corporate Audit Dashboard in Google Sheets?
A Corporate Audit Dashboard in Google Sheets is an analytical and performance-tracking tool designed to monitor audit activities, compliance levels, risk exposure, findings, and costs.
Instead of reviewing lengthy audit reports manually, this dashboard provides a clear visual overview of audit performance across departments, locations, risk levels, and time periods. As a result, organizations gain better control over governance, risk, and compliance (GRC) activities.
Most importantly, Google Sheets makes the dashboard collaborative, flexible, and easy to maintain without expensive audit software.
Why Do Organizations Need a Corporate Audit Dashboard?
Click to Buy Corporate Audit Dashboard in Google Sheets
Audit teams handle multiple audits across business units, locations, and risk categories. Therefore, without a centralized dashboard, it becomes difficult to answer questions such as:
-
What is our overall compliance score?
-
How many high-risk findings do we have?
-
Where are audit costs increasing?
-
Which departments require corrective actions?
-
How many audits need re-auditing?
The Corporate Audit Dashboard solves these challenges by consolidating audit intelligence into a single, decision-ready view.
Key Features of Corporate Audit Dashboard in Google Sheets
This dashboard is ready to use and structured into multiple analytical sections, each focused on a specific audit performance area.
Overview Sheet Tab – High-Level Audit Performance Snapshot
Click to Buy Corporate Audit Dashboard in Google Sheets
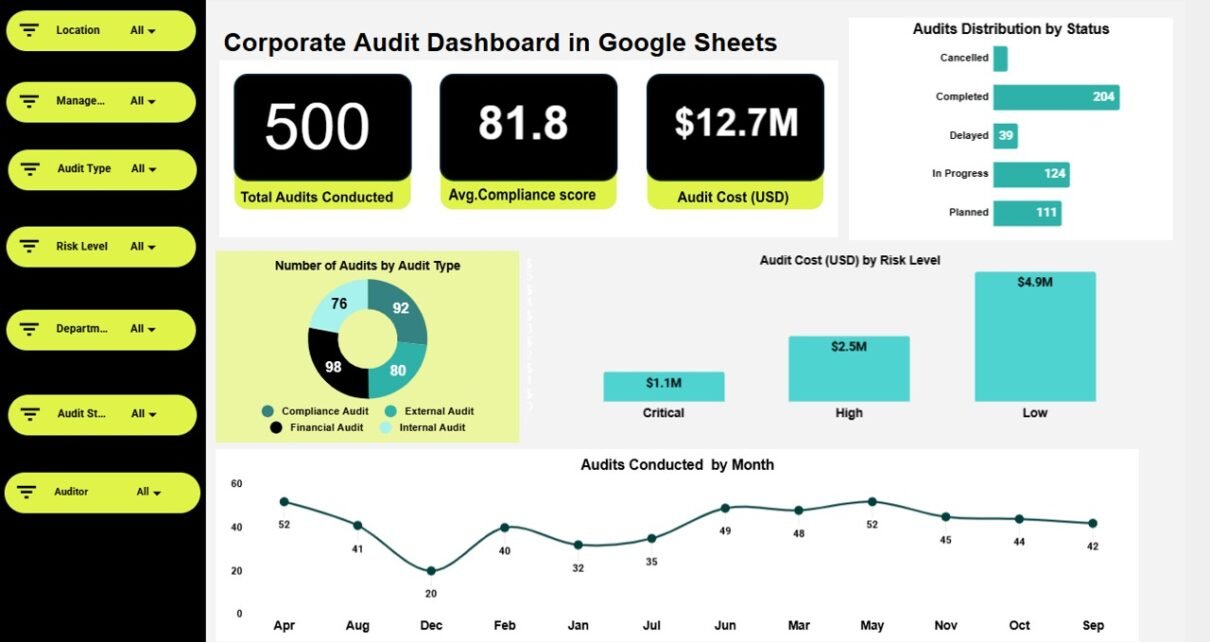
The Overview sheet provides a quick executive summary of overall audit performance.
KPI Cards on the Overview Sheet
-
Average Compliance Score
Shows the overall compliance performance across audits. -
Audit Cost (USD)
Displays the total audit cost incurred.
These KPI cards give leadership an instant view of compliance health and financial impact.
Charts on the Overview Sheet
-
Number of Audits by Audit Type
Shows distribution of audits across types such as Internal, External, Compliance, or Operational. -
Audits Distribution by Status
Displays audits by status (Planned, In Progress, Completed, Re-Audit Required). -
Audit Cost (USD) by Risk Level
Highlights spending across Low, Medium, High, and Critical risk audits. -
Audits Conducted by Month
Shows audit activity trends over time.
These visuals help management track audit workload and cost behavior.

Risk & Compliance Analysis – Focus on Risk Exposure
Click to Buy Corporate Audit Dashboard in Google Sheets
The Risk & Compliance Analysis section highlights high-risk and compliance-critical insights.
KPI Cards
-
Critical Risk Audits
Total number of audits classified as critical risk. -
High-Risk Findings Count
Number of findings marked as high risk.
Charts
-
Re-Audit Requirement Distribution
Shows audits that require re-auditing due to non-compliance. -
Average Compliance Score by Risk Level
Compares compliance performance across risk categories. -
Audit Cost (USD) by Risk Level
Highlights cost allocation across risk severity. -
Audit Count by Risk Level
Shows exposure concentration by risk type.
This analysis helps teams prioritize risk mitigation efforts.

Click to Buy Corporate Audit Dashboard in Google Sheets
Findings & Corrective Action – Audit Issue Visibility
The Findings & Corrective Action section focuses on audit outcomes and problem areas.
KPI Card
-
Total Audit Findings
Displays the total number of findings identified across audits.
Charts
-
High-Risk Findings by Location
Identifies locations with the most critical weaknesses. -
Audit Findings by Category
Shows findings grouped by type (Policy, Process, Financial, IT, etc.). -
High-Risk Findings by Department
Highlights departments needing immediate attention. -
Audit Findings by Auditor
Provides insight into findings distribution by auditor.
This section supports corrective action planning and accountability.

Click to Buy Corporate Audit Dashboard in Google Sheets
Department & Location Performance – Operational Audit Insights
This section evaluates audit performance across organizational dimensions.
Charts Included
-
Compliance Score by Department
Compares compliance levels across departments. -
Number of Audits by Location
Shows geographic audit coverage. -
Number of Audits by Department and Audit Type
Provides a deeper view of departmental audit involvement.
These insights help improve department-specific compliance strategies.

Click to Buy Corporate Audit Dashboard in Google Sheets
Cost & Efficiency Analysis – Audit Spending Intelligence
Audit efficiency directly impacts cost control. This section focuses on financial performance.
KPI Cards
-
Audit Cost (USD)
Total audit spend. -
Average Audit Cost (USD)
Average cost per audit.
Charts
-
Audit Cost (USD) by Location
Shows where audit spending concentrates geographically. -
Audit Cost (USD) by Auditor
Compares cost efficiency by auditor. -
Number of Audits by Audit Type
Displays workload by audit category. -
Audit Cost (USD) by Month
Tracks cost trends over time.
This section supports budgeting and audit efficiency optimization.

Click to Buy Corporate Audit Dashboard in Google Sheets
Search Functionality – Quickly Find Audit Records
The dashboard includes a Search feature that allows users to:
-
Enter a Search Keyword
-
Select a Field Name (Audit ID, Department, Location, Auditor, Risk Level, Status, etc.)
This feature allows instant retrieval of specific audit records without manual filtering.

Data Section – Structured Audit Information
The Data section acts as the backend of the dashboard and may include:
-
Audit ID
-
Audit Type
-
Audit Status
-
Risk Level
-
Compliance Score
-
Department
-
Location
-
Auditor
-
Audit Cost
-
Findings Category
-
Corrective Action Status
-
Audit Date
All dashboard cards, charts, and searches update automatically from this data.

Click to Buy Corporate Audit Dashboard in Google Sheets
Advantages of Corporate Audit Dashboard in Google Sheets
-
Ready-to-use audit tracking structure
-
No expensive audit software required
-
Real-time compliance and risk visibility
-
Supports multi-department and multi-location audits
-
Improves governance, risk, and compliance reporting
Best Practices for Using the Corporate Audit Dashboard
Click to Buy Corporate Audit Dashboard in Google Sheets
-
Update audit data regularly
-
Standardize risk and status classification
-
Review high-risk findings weekly
-
Monitor audit costs monthly
-
Use dashboard insights during audit review meetings
Conclusion
The Corporate Audit Dashboard in Google Sheets provides a powerful, easy-to-use solution for managing audits, compliance, risks, findings, and costs. Instead of relying on static reports, organizations gain a centralized, visual audit intelligence system.
Because the dashboard combines KPI cards, detailed charts, search functionality, and structured data, it supports stronger governance, faster decisions, and improved audit effectiveness.
Visit our YouTube channel to learn step-by-step video tutorials
Youtube.com/@NeotechNavigators
Watch the step-by-step video tutorial: