Energy management has become a top priority for organizations across industries. Rising energy costs, sustainability targets, and regulatory pressure require teams to track energy performance accurately and consistently. However, many organizations still rely on raw spreadsheets or manual reports. As a result, insights remain unclear and actions get delayed.
That is exactly where an Energy KPI Scorecard in Google Sheets adds real value.
In this article, we explain the Energy KPI Scorecard in Google Sheets, its structure, features, worksheets, advantages, best practices, and FAQs. This is a ready-to-use template designed to help teams monitor energy KPIs clearly and efficiently.
What Is an Energy KPI Scorecard in Google Sheets?
Click to Buy Energy KPI Scorecard in Google Sheets
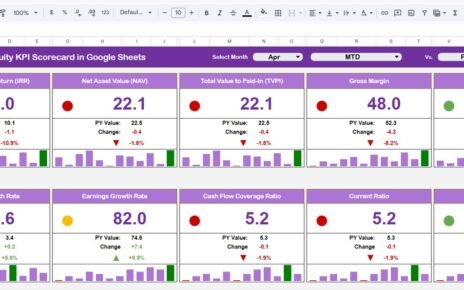
An Energy KPI Scorecard in Google Sheets is a structured and visual performance tracking template used to monitor key energy-related KPIs in one centralized location.
Instead of reviewing raw energy data, this scorecard displays performance using traffic lights, up/down arrows, and percentage changes. Moreover, because it is built in Google Sheets, teams can collaborate and update data in real time.
As a result, energy managers gain instant visibility into both monthly (MTD) and yearly (YTD) performance.
Why Do You Need an Energy KPI Scorecard?
Energy data often comes from multiple sources such as meters, bills, and monitoring systems. Therefore, tracking it manually becomes time-consuming and inconsistent.
Without a scorecard:
-
Energy trends remain hidden
-
Target vs actual performance stays unclear
-
Improvement opportunities go unnoticed
However, an Energy KPI Scorecard in Google Sheets centralizes all KPIs and automates analysis. Consequently, decision-making becomes faster and more data-driven.
How Does the Energy KPI Scorecard in Google Sheets Work?
Click to Buy Energy KPI Scorecard in Google Sheets
The scorecard follows a simple and effective process:
-
Enter energy data in the Data Input sheet
-
Select a month from the drop-down at the top
-
View KPI performance instantly on the scorecard
-
Switch between MTD and YTD views
-
Analyze trends using the Trend Sheet
Because of this structure, users can analyze energy performance without editing formulas.
Key Features of the Energy KPI Scorecard in Google Sheets
This ready-to-use template includes several powerful features designed for energy reporting.
Month Selection Drop-Down
At the top of the scorecard, a month drop-down allows users to select any reporting month. Once selected, all KPI values update automatically.
MTD and YTD Toggle
Users can switch between:
-
MTD (Month-to-Date) to analyze monthly performance
-
YTD (Year-to-Date) to analyze annual performance
Therefore, both short-term and long-term insights become available instantly.
Traffic Lights and Up/Down Arrows
The scorecard uses:
-
Traffic light indicators to show KPI status
-
Up and down arrows to highlight percentage change
As a result, performance gaps become visible at a glance.
How Many KPIs Are Included in This Scorecard?
Click to Buy Energy KPI Scorecard in Google Sheets
This Energy KPI Scorecard tracks 10 different Energy KPIs by default. However, users can easily modify or replace KPIs based on business needs.
Common energy KPIs include:
-
Total Energy Consumption
-
Energy Cost
-
Energy Intensity
-
Renewable Energy Usage
-
Peak Demand
-
Energy Efficiency Ratio
-
Carbon Emissions from Energy
-
Cost per Unit of Energy
-
Energy Savings
-
Power Factor
What Sheets Are Included in the Energy KPI Scorecard?
The scorecard includes multiple structured sheets, each serving a specific purpose.
Scorecard Sheet: What Does It Show?
The Scorecard Sheet is the main dashboard.
Key Highlights:
-
Displays all 10 energy KPIs in one view
-
Shows actual performance vs target
-
Displays traffic light indicators
-
Highlights percentage change with arrows
-
Supports MTD and YTD analysis
Because of this layout, stakeholders can review energy performance in seconds.

Click to Buy Energy KPI Scorecard in Google Sheets
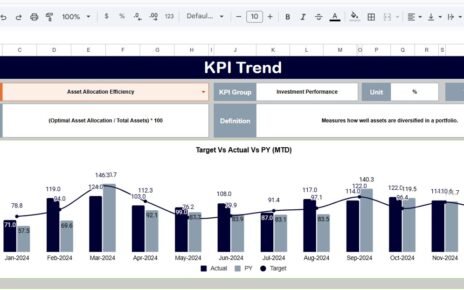
Trend Sheet: How Can You Analyze KPI Trends?
The Trend Sheet focuses on KPI-level trend analysis.
Key Features:
-
KPI selection drop-down at cell C3
Displays:
- KPI Group
- KPI Unit
- KPI Type (Lower the Better / Upper the Better)
This sheet helps users understand KPI behavior over time.

Click to Buy Energy KPI Scorecard in Google Sheets
KPI Definition Sheet: Why Is It Important?
The KPI Definition Sheet acts as the reference layer of the scorecard.
In This Sheet, You Enter:
-
KPI Name
-
KPI Group
-
Unit of Measurement
-
Formula
-
KPI Definition
Because definitions remain centralized, reporting stays consistent across teams.

Data Input Sheet: Where Do You Enter Energy Data?
The Data Input Sheet is used to input raw energy data.
Key Benefits:
-
Simple and structured layout
-
Easy monthly data entry
-
Automatic linkage to scorecard and trends
Once data is updated, all visuals refresh automatically.

Click to Buy Energy KPI Scorecard in Google Sheets
Colour Settings Sheet: Why Does It Matter?
The Colour Settings Sheet controls:
-
Traffic light colors
-
Arrow colors
-
Threshold logic

This sheet allows customization without touching formulas. Therefore, users can align the scorecard with internal reporting standards.
Advantages of Energy KPI Scorecard in Google Sheets
Click to Buy Energy KPI Scorecard in Google Sheets
Centralized Energy Performance Tracking
All energy KPIs remain in one structured location.
Faster Energy Decisions
Visual indicators highlight issues instantly.
Clear Target Monitoring
Traffic lights show whether KPIs meet targets.
Real-Time Collaboration
Google Sheets allows multiple users to work together.
No Complex Tools Required
You get professional energy analytics without expensive software.
Easy Customization
Users can easily change KPIs, thresholds, and colors.
Best Practices for Energy KPI Scorecard in Google Sheets
Keep Data Accurate and Timely
Always update energy data on a regular basis.
Review KPI Definitions Periodically
Ensure units and formulas align with energy goals.
Monitor Trends Monthly
Trend analysis helps identify inefficiencies early.
Avoid Manual Overrides
Let formulas and rules drive indicators.
Protect Formula Sheets
Lock calculation and colour setting sheets to prevent errors.
Who Can Use This Energy KPI Scorecard?
Click to Buy Energy KPI Scorecard in Google Sheets
This scorecard is suitable for:
- Energy managers
- Sustainability teams
- Facility managers
- Manufacturing plants
- Corporate ESG teams
- Consultants and auditors
Because it uses Google Sheets, adoption remains quick and simple.
Conclusion: Is the Energy KPI Scorecard in Google Sheets Worth Using?
An Energy KPI Scorecard in Google Sheets transforms raw energy data into clear, actionable insights. It simplifies monthly and yearly reporting, improves visibility, and supports better energy management decisions.
If you want a ready-to-use, flexible, and easy-to-manage energy performance solution, this scorecard is the right choice.
Frequently Asked Questions (FAQs)
Click to Buy Energy KPI Scorecard in Google Sheets
What is an Energy KPI Scorecard in Google Sheets?
It is a ready-to-use template that tracks energy KPIs with MTD/YTD views, traffic lights, and trends.
How many KPIs does this scorecard track?
The default template tracks 10 energy KPIs, but you can customize it.
Can I customize traffic light thresholds?
Yes, thresholds and colors can be customized in the Colour Settings sheet.
Do I need advanced Google Sheets skills?
No, basic Google Sheets knowledge is sufficient.
Can multiple users update the scorecard?
Yes, Google Sheets supports real-time collaboration.
Visit our YouTube channel to learn step-by-step video tutorials
Youtube.com/@NeotechNavigators
Watch the step-by-step video tutorial: