Solar energy projects demand precision. Contractors must track budgets, panel installations, labor hours, delays, and stage progress daily. However, when teams rely on scattered sheets, they lose clarity. As a result, project managers struggle to control costs and timelines.Solar Project Construction Dashboard in Google Sheets
So, how can you monitor every solar construction project in one centralized system?Solar Project Construction Dashboard in Google Sheets
You need a Solar Project Construction Dashboard in Google Sheets.
This ready-to-use dashboard provides real-time insights into project count, budget allocation, cost incurred, stage performance, contractor efficiency, and delay analysis — all inside Google Sheets.
Let’s explore everything in detail.Solar Project Construction Dashboard in Google Sheets
What Is the Solar Project Construction Dashboard in Google Sheets?
Click to Buy Solar Project Construction Dashboard in Google Sheets
The Solar Project Construction Dashboard in Google Sheets is a dynamic reporting tool designed for solar EPC companies, project managers, contractors, and renewable energy firms.
It helps you:
- Track total projects
- Monitor total budget vs cost incurred
- Analyze project status
- Review stage performance
- Identify delay reasons
- Evaluate contractor performance
- Search projects instantly
Because it runs on Google Sheets, your team can collaborate online in real time.
Key Highlights of the Dashboard
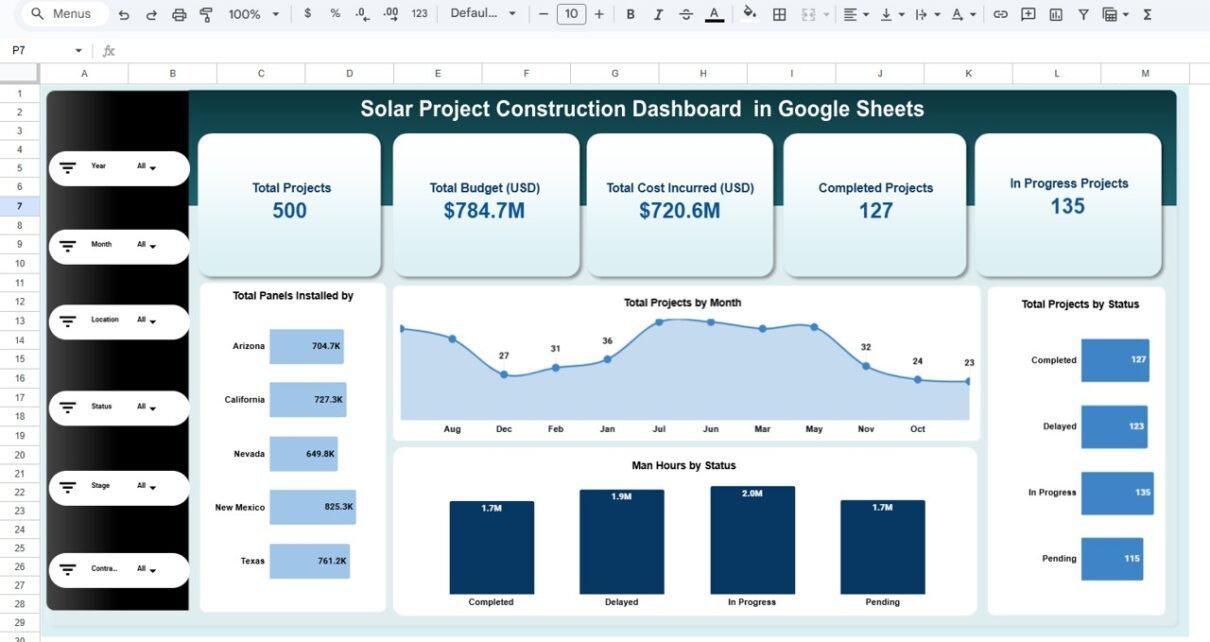
From the overview page, you can instantly see:
- Total Projects: 500
- Total Budget (USD): $784.7M
- Total Cost Incurred (USD): $720.6M
- Completed Projects: 127
- In Progress Projects: 135
Moreover, slicers on the left allow filtering by:
- Year
- Month
- Location
- Status
- Stage
- Contractor
Therefore, you can drill down into specific data instantly.
What Pages Are Included in the Solar Project Construction Dashboard?
Click to Buy Solar Project Construction Dashboard in Google Sheets
This dashboard includes multiple analytical pages:
Overview Dashboard
This is the main page.
It displays:
- Total projects
- Budget vs cost summary
- Completed, delayed, in-progress, and pending projects
- Total panels installed by location
- Projects by month
-
Man-hours by status
Because the dashboard updates dynamically, selecting filters changes all numbers instantly.

Click to Buy Solar Project Construction Dashboard in Google Sheets
Budget & Cost Analysis Page
This page focuses on financial performance.
It shows:
- Total Budget vs Total Cost by Location
- Budget vs Cost by Contractor
- Budget vs Cost by Stage
- Budget vs Cost by Month
Therefore, managers can detect overspending immediately.
For example:
- Some contractors show higher cost incurred than budget.
- Certain stages exceed planned budgets.
As a result, leadership can act quickly.

Click to Buy Solar Project Construction Dashboard in Google Sheets
Stage Analysis Page
This page analyzes construction phases such as:
- Commissioning
- Foundation
- Panel Installation
- Planning
- Site Preparation
- Testing
- Wiring
It displays:
- Total projects by stage
- Total panels installed by stage
- Completed vs In Progress projects by stage
- Actual amount by category
Therefore, project managers understand which stage slows down performance.

Click to Buy Solar Project Construction Dashboard in Google Sheets
Delay Reason Analysis Page
Delays can destroy profitability. Therefore, this page highlights delay reasons such as:
- Labor Shortage
- Permit Issues
- Supply Chain
- Weather
- No Delay
The dashboard displays:
- Total projects by delay reason
- Completed vs In Progress projects by delay
- Total panels installed by delay reason
- Actual cost by delay reason
Because you can identify common delay causes, you can implement preventive measures.

Click to Buy Solar Project Construction Dashboard in Google Sheets
Contractor & Performance Page
Contractor performance directly impacts solar project success.
This page helps you:
- Compare completed vs in-progress projects by contractor
- Review panels installed by contractor
- Monitor cost incurred by contractor
- Analyze contractor delay impact
Therefore, you can evaluate contractor efficiency clearly.
Click to Buy Solar Project Construction Dashboard in Google Sheets
Search Page – Advanced Project Lookup
This powerful search page allows you to:
- Select a specific column (e.g., Status)
- Enter a keyword (e.g., Delayed)
- Instantly filter all matching projects
It displays detailed project information including:
- Project ID
- Project Name
- Location
- Start Date
- Expected Completion Date
- Stage
- Status
- Budget
- Cost Incurred
- Contractor
- Panels Installed
- Man Hours
- Delay Reason
- Month & Year
Because of this feature, managers can find specific project data instantly.

Click to Buy Solar Project Construction Dashboard in Google Sheets
Advantages of Solar Project Construction Dashboard in Google Sheets
Real-Time Financial Monitoring
You control project budgets effectively.
Better Stage Management
You track progress at each construction stage.
Improved Contractor Evaluation
You identify high-performing and underperforming contractors.
Faster Delay Identification
You spot common delay reasons instantly.
Easy Collaboration
Google Sheets allows multi-user access.
Powerful Search Function
You retrieve project data instantly.
Best Practices for the Solar Project Construction Dashboard
Click to Buy Solar Project Construction Dashboard in Google Sheets
To maximize value, follow these best practices:
Update Data Monthly
Enter project data consistently.
Monitor Budget Variance Weekly
Do not wait until project completion.
Review Delay Patterns
Analyze recurring delay causes.
Evaluate Contractor Performance Quarterly
Reward efficiency and address inefficiencies.
Use Filters for Decision-Making
Drill down by location, stage, or contractor before making decisions.
Who Can Use This Dashboard?
- Solar EPC Companies
- Renewable Energy Firms
- Construction Project Managers
- Solar Developers
- Engineering Consultants
- Government Solar Departments
Because it runs on Google Sheets, even small firms can use it easily.
Conclusion
Click to Buy Solar Project Construction Dashboard in Google Sheets
Solar construction projects involve complex coordination, strict budgets, and tight deadlines. Therefore, project managers must monitor performance closely.
The Solar Project Construction Dashboard in Google Sheets provides a powerful, interactive, and ready-to-use solution. It combines financial tracking, stage analysis, delay monitoring, contractor evaluation, and advanced search functionality in one centralized dashboard.
Visit our YouTube channel to learn step-by-step video tutorials
Youtube.com/@NeotechNavigators
Watch the step-by-step video tutorial:
Click to Buy Solar Project Construction Dashboard in Google Sheets