Technology teams handle multiple projects, tight deadlines, budgets, and performance targets. However, when data stays scattered across different sheets, managers struggle to monitor progress clearly. As a result, teams miss deadlines, overspend budgets, and fail to resolve issues on time.
So, how can you track targets, actual hours, budget, and performance in one centralized system?
The answer is simple.
You need a Technology Dashboard in Google Sheets.
This ready-to-use dashboard helps IT departments, software teams, and technology companies monitor hours, budgets, project performance, and issue resolution metrics — all inside Google Sheets.
Let’s explore this dashboard in detail.
What Is the Technology Dashboard in Google Sheets?
Click to Buy Technology Dashboard in Google Sheets
The Technology Dashboard in Google Sheets is a dynamic reporting solution designed for:
- IT Departments
- Software Development Teams
- R&D Units
- Cybersecurity Teams
- Project Managers
It allows users to track:
- Target Hours
- Actual Hours
- Issues Resolved
- Budget Allocated
- Amount Spent
- Department Performance
- Category Performance
- Project-Level Insights
- Monthly Trends
Because it runs in Google Sheets, your team can collaborate online in real time.
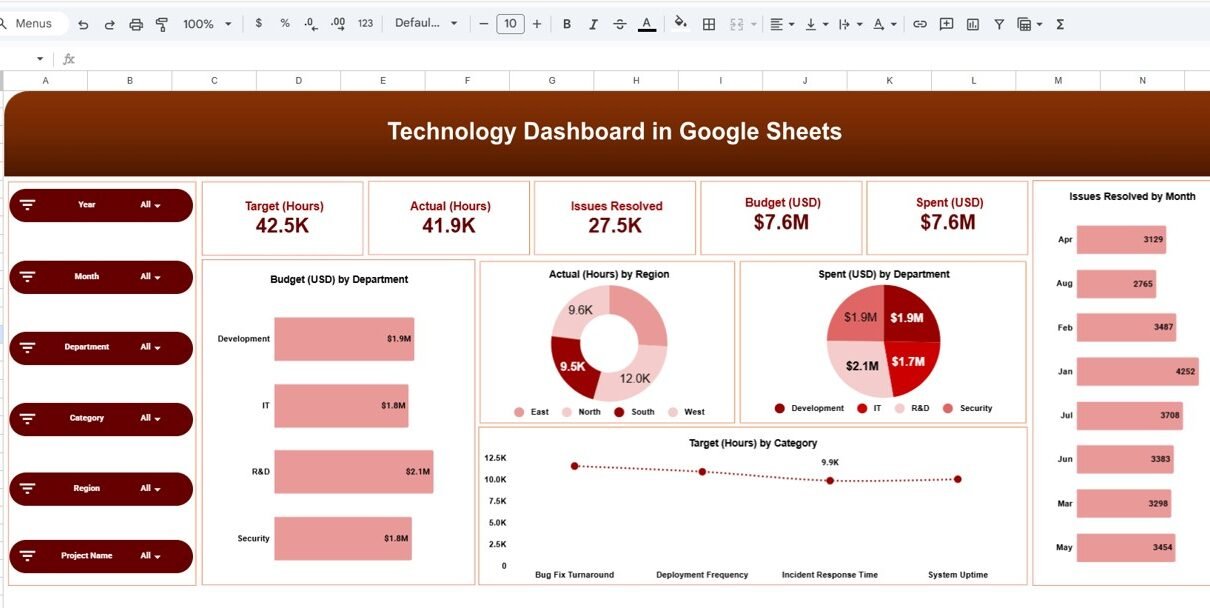
Overview Page – High-Level Performance Snapshot
The main dashboard page provides a quick summary.
Key KPI Cards Display:
- Target Hours: 42.5K
- Actual Hours: 41.9K
- Issues Resolved: 27.5K
- Budget (USD): $7.6M
- Spent (USD): $7.6M
On the left side, interactive slicers allow filtering by:
- Year
- Month
- Department
- Category
- Region
- Project Name
Because filters update all visuals instantly, managers can drill down into specific data quickly.
What Does the Overview Dashboard Show?
Click to Buy Technology Dashboard in Google Sheets
The overview page includes:
Budget by Department
Shows how much each department receives.
Departments include:
- Development
- IT
- R&D
- Security
Actual Hours by Region
Displays workload distribution across:
- East
- North
- South
- West
Spent (USD) by Department
Helps identify budget utilization per department.
Target Hours by Category
Categories include:
-
Bug Fix Turnaround
-
Deployment Frequency
-
Incident Response Time
-
System Uptime
Issues Resolved by Month
Shows how productivity changes monthly.
Therefore, leadership gains a complete performance overview in one page.

Click to Buy Technology Dashboard in Google Sheets
Department Analysis Page
This page focuses on department-level performance.
It displays:
-
Actual Hours by Department
-
Spent (USD) by Department
-
Budget (USD) by Department
-
Target Hours by Department
For example:
-
R&D shows 11.6K target hours
-
Development shows 10.5K target hours
-
IT shows 9.9K target hours
Because managers can compare actual vs target hours, they can evaluate workload efficiency.

Click to Buy Technology Dashboard in Google Sheets
Category Analysis Page
This page analyzes performance by operational category.
Categories include:
-
Bug Fix Turnaround
-
Deployment Frequency
-
Incident Response Time
-
System Uptime
It displays:
-
Actual Hours by Category
-
Budget Allocation by Category
-
Spent Amount by Category
-
Target Hours by Category
Therefore, you can identify which category consumes more resources.

Click to Buy Technology Dashboard in Google Sheets
Project Analysis Page
Project managers need project-specific insights. This page provides:
-
Actual Hours by Project
-
Budget by Project
-
Spent by Project
-
Target Hours by Project
For example:
-
Project Alpha
-
Project Beta
-
Project Delta
-
Project Gamma
Because you can compare project-level budgets and spending, you can detect overspending quickly.

Click to Buy Technology Dashboard in Google Sheets
Monthly Trends Page
This page highlights month-wise performance trends.
It shows:
-
Actual Hours by Month
-
Budget by Month
-
Spent by Month
-
Target Hours by Month
For example:
-
January shows higher budget allocation.
-
August shows lower spending.
Because monthly tracking reveals patterns, managers can forecast workloads better.

Click to Buy Technology Dashboard in Google Sheets
Advantages of Technology Dashboard in Google Sheets
Centralized Performance Monitoring
You track all KPIs in one place.
Better Budget Control
You compare budget vs spent instantly.
Improved Productivity Tracking
You monitor issue resolution and workload.
Real-Time Collaboration
Google Sheets allows multi-user updates.
Visual & Interactive
Charts and slicers make analysis simple.
Best Practices for Technology Dashboard
Click to Buy Technology Dashboard in Google Sheets
To maximize value, follow these best practices:
Update Data Weekly
Frequent updates improve accuracy.
Monitor Budget Variance
Do not wait until the end of the month.
Track High-Impact Categories
Focus on incident response and uptime.
Compare Target vs Actual Regularly
Early detection prevents backlog issues.
Use Filters Before Decision-Making
Analyze data by department, region, or project.
Who Can Use This Dashboard?
- IT Managers
- CTOs
- Project Managers
- Software Development Teams
- Technology Consultants
- Startup Founders
Because it runs on Google Sheets, both small and large organizations can use it easily.
Conclusion
Click to Buy Technology Dashboard in Google Sheets
Technology teams operate in fast-paced environments. Therefore, they need clear performance tracking. The Technology Dashboard in Google Sheets provides a ready-to-use, interactive, and professional solution.
With department analysis, category tracking, project insights, and monthly trends, this dashboard transforms raw data into actionable intelligence.
Visit our YouTube channel to learn step-by-step video tutorials
Youtube.com/@NeotechNavigators
Watch the step-by-step video tutorial: