The agriculture industry depends on data more than ever before. Farmers track yield per acre. Agribusinesses monitor cost and revenue. Moreover, managers analyze soil performance, fertilizer impact, and seasonal trends.
However, many agricultural businesses still use scattered spreadsheets. As a result, decision-making becomes slow. Therefore, performance tracking lacks clarity.
In this article, we will explain the Agriculture Dashboard in Google Sheets — a ready-to-use, fully interactive dashboard designed to monitor farm productivity, cost efficiency, and profitability in one structured system.
This dashboard provides:
- Revenue and profit monitoring
- Crop performance analysis
- Soil and fertilizer comparison
- Region-based insights
- Seasonal productivity tracking
- Monthly trend evaluation
Let us explore every page in detail.
What Is the Agriculture Dashboard in Google Sheets?
Click to Buy Agriculture Dashboard in Google Sheets
The Agriculture Dashboard in Google Sheets is a ready-to-use performance monitoring tool designed for:
- Farm owners
- Agribusiness companies
- Agricultural consultants
- Crop production managers
- Agricultural analysts
It transforms raw agricultural data into clear, interactive visual reports.
Instead of manually calculating totals, you can instantly view:
- Total Revenue (USD)
- Total Cost (USD)
- Profit (USD)
- Total Production (Quintals)
- Average Yield per Acre (Quintals)
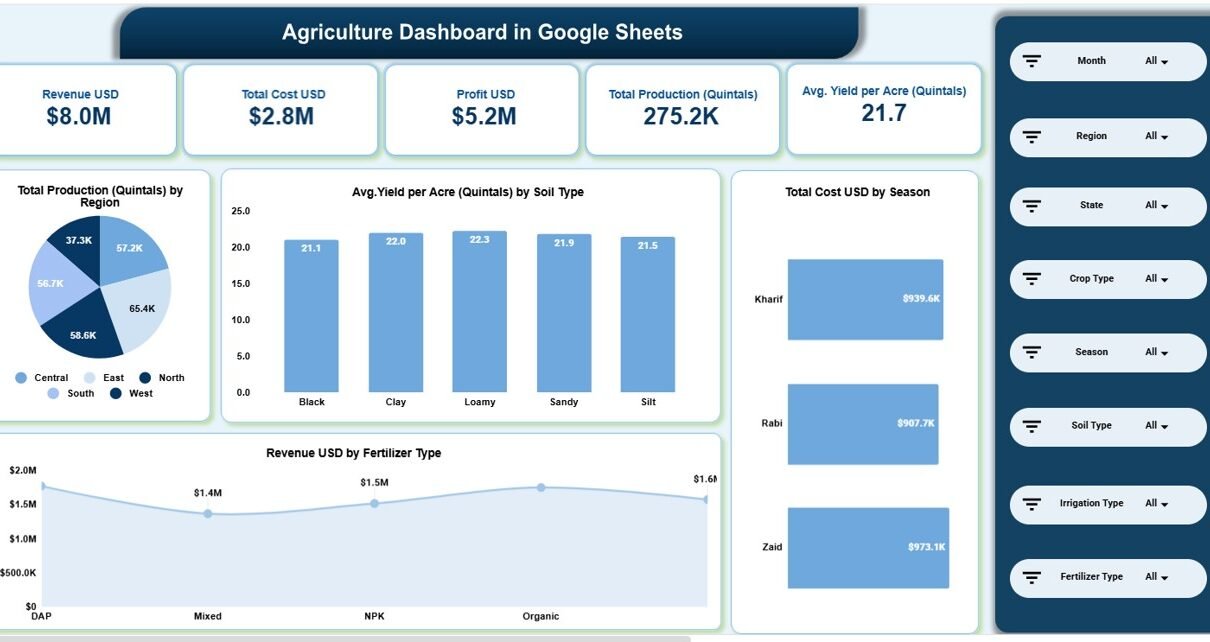
Overview Dashboard –
The Overview Page provides high-level performance insights.
🔹 Key KPI Cards Displayed
- Revenue USD – $8.0M
- Total Cost USD – $2.8M
- Profit USD – $5.2M
- Total Production – 275.2K Quintals
- Avg. Yield per Acre – 21.7 Quintals
These cards give instant clarity about overall farm health.
🔹 Visual Reports on Overview Page
- Total Production by Region
- Average Yield by Soil Type
- Total Cost by Season
- Revenue by Fertilizer Type
Because slicers allow filtering by Month, Region, State, Crop Type, Season, Soil Type, Irrigation Type, and Fertilizer Type, the dashboard becomes fully dynamic.

Click to Buy Agriculture Dashboard in Google Sheets
Region Analysis
This page focuses on regional performance.
🔹 Key Metrics
-
Revenue USD by Region
-
Profit USD by Region
-
Area Cultivated (Acres) by Region
-
Total Production by Region
For example:
-
East region generates $1.9M revenue
-
North region produces 58.6K quintals
-
East cultivates 2.9K acres
Therefore, managers can identify high-performing regions instantly.

Click to Buy Agriculture Dashboard in Google Sheets
Cost vs Revenue Analysis
Profitability matters in agriculture. Therefore, this page compares revenue, yield, and production performance.
🔹 Key Reports
Revenue by Crop Type
Compare crops like:
-
Cotton
-
Maize
-
Pulses
-
Rice
-
Soybean
-
Sugarcane
-
Vegetables
-
Wheat
Average Yield by Fertilizer Type
Identify which fertilizer produces better yield.
Total Production by Season
Understand seasonal productivity patterns.
Because of these insights, decision-makers allocate resources effectively.

Click to Buy Agriculture Dashboard in Google Sheets
Crop vs Soil Analysis
Soil quality directly impacts crop productivity. Therefore, this page helps evaluate soil efficiency.
🔹 Visual Analysis Includes:
-
Revenue by Crop Type
-
Profit by Crop Type
-
Area Cultivated by Soil Type
-
Total Production by Soil Type
For example:
-
Clay soil produces 60K quintals
-
Sandy soil cultivates 2.6K acres
As a result, agribusinesses optimize crop-soil combinations.

Click to Buy Agriculture Dashboard in Google Sheets
Monthly Trends
Agriculture performance changes every month.
Therefore, this page tracks:
-
Revenue by Month
-
Profit by Month
-
Area Cultivated by Month
-
Total Production by Month
For example:
-
August revenue: $813.4K
-
June production: 26.1K quintals
With this page, managers monitor growth patterns across the year.

Click to Buy Agriculture Dashboard in Google Sheets
Key Advantages of Agriculture Dashboard in Google Sheets
1. Real-Time Farm Monitoring
You track revenue, cost, and production instantly.
2. Soil & Fertilizer Optimization
You identify high-performing soil types and fertilizers.
3. Seasonal Analysis
You compare Kharif, Rabi, and Zaid seasons clearly.
4. Region-Wise Profit Tracking
You analyze location-based profitability.
5. Easy Filtering & Customization
You apply filters quickly using dropdown slicers.
6. Ready-to-Use Structure
You do not need coding knowledge.
Best Practices for Using the Agriculture Dashboard in Google Sheets
Click to Buy Agriculture Dashboard in Google Sheets
To maximize impact, follow these best practices:
1. Update Data Monthly
Enter revenue, cost, and production numbers regularly.
2. Track Fertilizer Efficiency
Compare yield per acre before purchasing fertilizers.
3. Monitor Soil Performance
Allocate crops based on soil productivity trends.
4. Analyze Seasonal Cost Trends
Plan budget allocation before each farming season.
5. Compare Regions Quarterly
Focus on improving underperforming regions.
6. Validate Input Data
Always cross-check acreage and production numbers.
Who Can Use This Dashboard?
Click to Buy Agriculture Dashboard in Google Sheets
-
Commercial farming businesses
-
Agricultural startups
-
Government agriculture departments
-
Farm cooperatives
-
Export-focused agribusiness companies
If you manage multiple farms or crop types, this dashboard helps you take data-driven decisions.
Why Choose Google Sheets for Agriculture Analytics?
Click to Buy Agriculture Dashboard in Google Sheets
Google Sheets offers:
-
Cloud-based access
-
Easy sharing with teams
-
Automatic saving
-
Real-time collaboration
-
No expensive software cost
Therefore, small and large farms both benefit from this solution.
Conclusion
Agriculture requires smart planning and accurate tracking. However, manual spreadsheets limit performance visibility.
The Agriculture Dashboard in Google Sheets provides a ready-to-use, interactive, and structured solution. It monitors revenue, cost, production, yield, soil efficiency, fertilizer performance, and regional profitability — all in one system.
Visit our YouTube channel to learn step-by-step video tutorials
Youtube.com/@NeotechNavigators
Watch the step-by-step video tutorial: