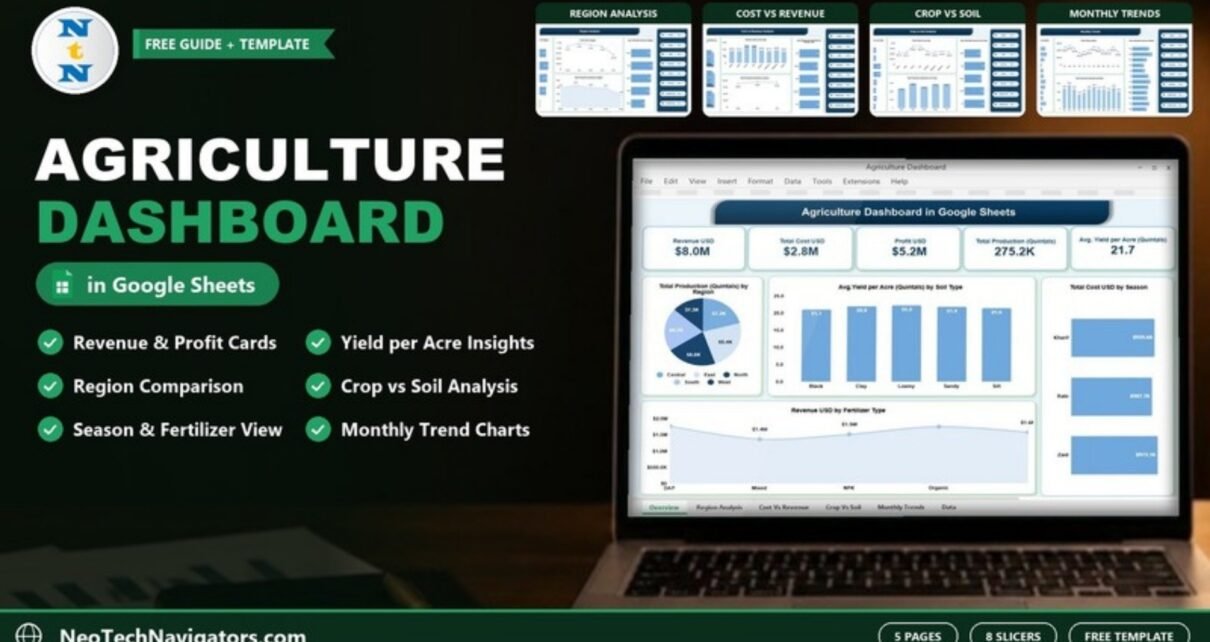
A five-page Agriculture Dashboard in Google Sheets that shows farm revenue, cost, profit, production and yield per acre by region, crop, soil, fertilizer, season and month, with eight slicers and a worked example.
Online Tutorial for Data Analysis and Automation
A five-page Agriculture Dashboard in Google Sheets that shows farm revenue, cost, profit, production and yield per acre by region, crop, soil, fertilizer, season and month, with eight slicers and a worked example.