Organizations today invest heavily in employee training, professional development, and skill enhancement programs. Because businesses operate in competitive environments, they must continuously improve employee knowledge and capabilities. Learning and development (L&D) initiatives help companies build stronger teams, improve productivity, and achieve long-term success.Learning & Development KPI Dashboard in Google Sheets
However, simply running training programs is not enough. Companies must measure the effectiveness of these programs. Without proper tracking, organizations cannot determine whether training investments actually improve employee performance.
Many HR and training teams still rely on scattered spreadsheets and manual reports to monitor training activities. As a result, it becomes difficult to track key metrics, compare targets with actual results, or analyze training performance over time.
Therefore, organizations need a structured and easy-to-use performance monitoring system.Learning & Development KPI Dashboard in Google Sheets
This is where the Learning & Development KPI Dashboard in Google Sheets becomes extremely valuable.
The Learning & Development KPI Dashboard in Google Sheets is a ready-to-use template that helps HR teams and training managers monitor learning performance using key performance indicators (KPIs). The dashboard tracks multiple training metrics, compares actual results with targets, and evaluates year-over-year improvements.
In this article, you will learn what a Learning & Development KPI Dashboard is, why organizations need it, its key features, important L&D KPIs, advantages, best practices, and frequently asked questions.
What is a Learning & Development KPI Dashboard in Google Sheets?
Click to Buy Learning & Development KPI Dashboard in Google Sheets
A Learning & Development KPI Dashboard in Google Sheets is a performance monitoring tool designed to track and analyze employee training and development activities.
The dashboard consolidates training data and presents it in a structured format using tables, visual indicators, and trend analysis. Because of this structure, HR managers can easily evaluate training effectiveness.
This template includes all KPI details such as KPI units, aggregation formulas, definitions, and performance direction (Lower the Better or Upper the Better). These elements help users understand how each KPI works and how to interpret its results.
Additionally, the dashboard compares:
- Actual performance
- Target performance
- Previous year performance
Because of this comparison, organizations can evaluate training improvement over time.
The dashboard also uses conditional formatting with up and down arrows, which makes performance changes easy to identify.
Why Do Organizations Need a Learning & Development Dashboard?
Employee training programs involve multiple activities, including workshops, online courses, certifications, and skill development sessions.
However, without proper performance tracking, organizations face several challenges.
For example:
- Training effectiveness remains unclear
- HR teams cannot measure learning outcomes
- Training investments become difficult to justify
- Managers cannot identify skill gaps
Therefore, companies need a centralized analytics system.
A Learning & Development KPI Dashboard in Google Sheets helps organizations track training performance using structured KPIs. It allows HR managers to analyze training results, compare targets with actual outcomes, and identify improvement opportunities.
As a result, companies can optimize their learning programs and improve workforce development.
Key Features of the Learning & Development KPI Dashboard in Google Sheets
Click to Buy Learning & Development KPI Dashboard in Google Sheets
The dashboard includes six well-organized worksheets, each designed to handle a specific part of KPI monitoring and analysis.
These worksheets help users manage data input, KPI definitions, performance monitoring, and trend analysis.
1. Dashboard Sheet – The Main KPI Monitoring Page
The Dashboard Sheet acts as the central view where users can monitor all Learning & Development KPIs.
This sheet displays the performance of all KPIs in a structured format, allowing managers to analyze results quickly.
Month Selection Feature
At cell D3, users can select a month from the dropdown menu.
Once a month is selected:
-
The entire dashboard automatically updates
-
KPI values refresh for the selected month
-
Visual indicators change accordingly
Because of this feature, the dashboard becomes a dynamic monthly reporting tool.
KPI Performance Comparison
The dashboard shows multiple performance comparisons, including:
MTD Analysis (Month-to-Date)
-
Actual performance
-
Target values
-
Previous year data
The dashboard also displays:
-
Target vs Actual comparison
-
Previous Year vs Actual comparison
These comparisons include conditional formatting arrows, which show whether performance has improved or declined.
YTD Analysis (Year-to-Date)
The dashboard also tracks cumulative yearly performance.
It displays:
-
YTD Actual
-
YTD Target
-
Previous Year YTD
These metrics allow organizations to evaluate long-term training progress.

Click to Buy Learning & Development KPI Dashboard in Google Sheets
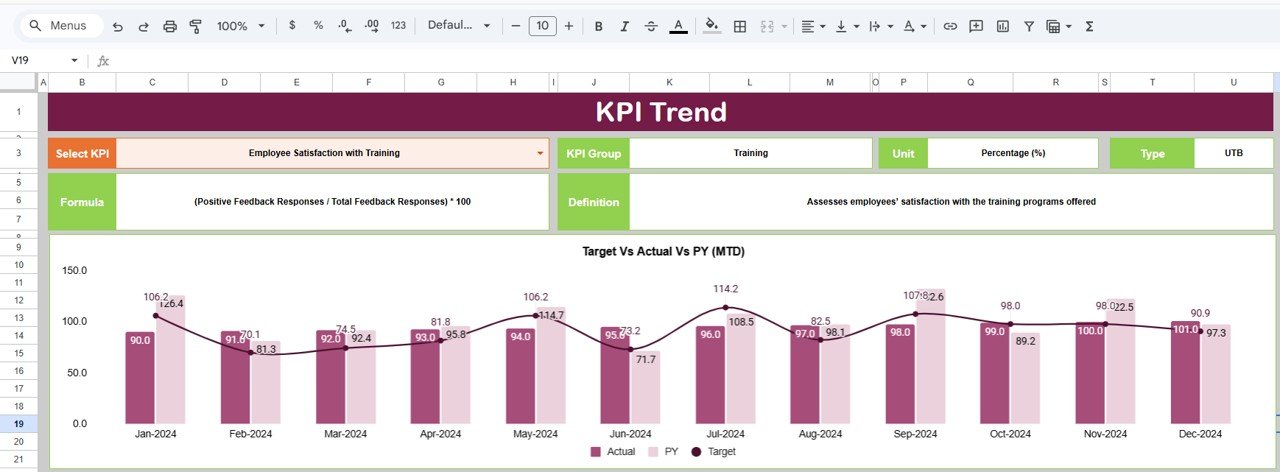
2. KPI Trend Sheet – Analyze KPI Performance Over Time
The KPI Trend Sheet allows users to analyze the historical performance of a selected KPI.
Users can choose a KPI from the dropdown available in cell C3. Once selected, the sheet displays detailed information about that KPI.
KPI Information Displayed
This sheet shows several important details:
-
KPI Group
-
KPI Unit
-
KPI Type
The KPI type indicates performance direction:
-
Upper the Better – Higher values indicate better performance
-
Lower the Better – Lower values indicate better performance
For example:
-
Higher training completion rates indicate success
-
Lower training costs per employee indicate efficiency
Additional KPI Details
The sheet also displays:
-
KPI formula used for calculation
-
KPI definition explaining the metric
These details help users clearly understand each KPI.
Click to Buy Learning & Development KPI Dashboard in Google Sheets
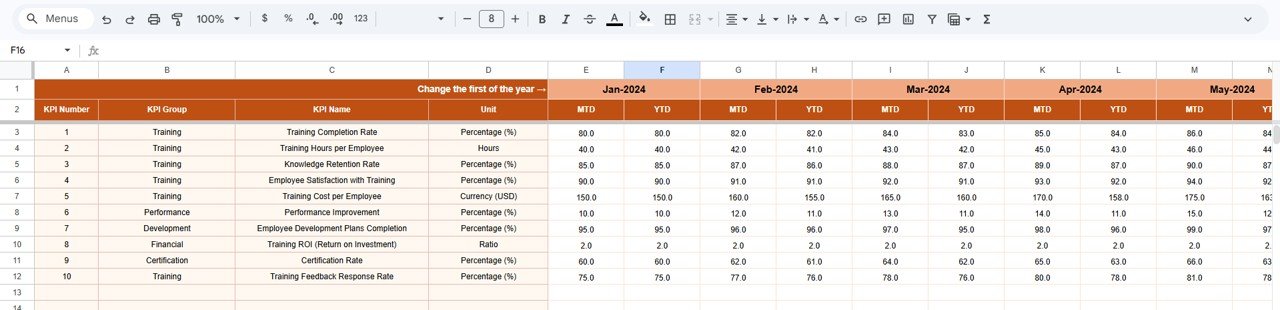
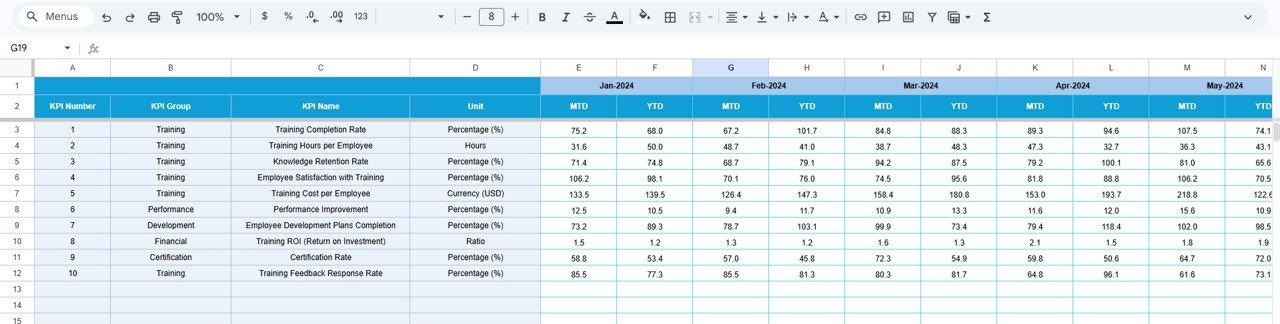
3. Actual Number Sheet – Enter Training Performance Data
The Actual Number Sheet stores the actual training performance data for each KPI.
In this sheet, users enter:
-
Monthly KPI values
-
Year-to-date KPI values
Users can change the month from cell E1.
To begin the process, users simply input the first month of the year in cell E1, and the template will automatically align the data for analysis.
Because of this setup, updating the dashboard becomes simple and efficient.
Click to Buy Learning & Development KPI Dashboard in Google Sheets
4. Target Sheet – Enter KPI Targets
The Target Sheet allows organizations to define their KPI targets.
In this sheet, users enter:
-
Monthly targets (MTD)
-
Yearly targets (YTD)
These targets help organizations measure whether training programs meet performance expectations.
Once targets are entered, the dashboard automatically compares them with actual results.
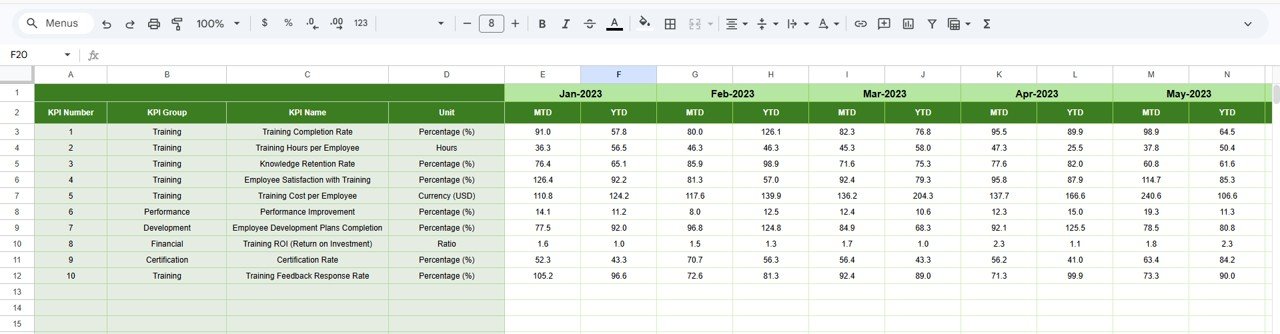
5. Previous Year Number Sheet – Compare Historical Performance
The Previous Year Number Sheet stores the KPI values from the previous year.
Users should enter historical data in the same structure used for the current year.
This sheet enables the dashboard to calculate year-over-year performance comparisons, which helps organizations evaluate training improvements over time.
Click to Buy Learning & Development KPI Dashboard in Google Sheets
6. KPI Definition Sheet – Manage KPI Information
The KPI Definition Sheet acts as the central documentation area for all KPIs.
In this sheet, users define:
- KPI Name
- KPI Group
- KPI Unit
- KPI Formula
- KPI Definition
This structured approach ensures that everyone understands how KPIs are calculated and interpreted.

Advantages of Learning & Development KPI Dashboard in Google Sheets
Using a structured KPI dashboard offers several advantages for HR and training teams.
Centralized Training Performance Monitoring
The dashboard brings all learning performance metrics into one location.
Clear Performance Comparison
Managers can compare actual results with targets and previous year data easily.
Improved Training Decision Making
The dashboard helps HR teams identify which training programs deliver the best results.
Easy Collaboration
Because Google Sheets works in the cloud, multiple users can access and update the dashboard simultaneously.
Simple and Flexible
The template remains easy to customize based on organizational needs.
Best Practices for the Learning & Development KPI Dashboard
Click to Buy Learning & Development KPI Dashboard in Google Sheets
To achieve maximum value from the dashboard, organizations should follow several best practices.
Define Clear KPIs
Choose KPIs that align with business goals and employee development strategies.
Maintain Accurate Data
Ensure that all training data entered in the dashboard remains accurate and updated.
Monitor Trends Regularly
Analyze KPI trends to identify long-term training improvements.
Set Realistic Targets
Define achievable targets based on historical data and organizational capabilities.
Review Training Outcomes
Use dashboard insights to improve training programs and address skill gaps.
Conclusion
Employee training and development remain essential for business growth. However, organizations must measure the effectiveness of their learning initiatives to ensure that training investments deliver real results.
The Learning & Development KPI Dashboard in Google Sheets provides a simple yet powerful solution for monitoring training performance.
With structured worksheets, automated KPI comparisons, and visual performance indicators, the dashboard helps HR teams track learning outcomes effectively.
Moreover, features such as monthly analysis, trend monitoring, KPI definitions, and historical comparisons make this template highly useful for training management.
Organizations that adopt data-driven learning analytics can improve employee performance, strengthen workforce capabilities, and achieve long-term success.
Frequently Asked Questions (FAQs)
Click to Buy Learning & Development KPI Dashboard in Google Sheets
What is a Learning & Development KPI Dashboard?
A Learning & Development KPI Dashboard is a tool used to monitor employee training performance using key metrics such as training completion rates, learning hours, and training effectiveness.
Why should organizations track learning KPIs?
Tracking learning KPIs helps organizations measure the effectiveness of training programs and improve workforce development strategies.
What is the difference between MTD and YTD performance?
MTD (Month-to-Date) measures performance for the current month, while YTD (Year-to-Date) shows cumulative performance for the entire year.
Visit our YouTube channel to learn step-by-step video tutorials
Youtube.com/@NeotechNavigators
Watch the step-by-step video tutorial:
Click to Buy Learning & Development KPI Dashboard in Google Sheets