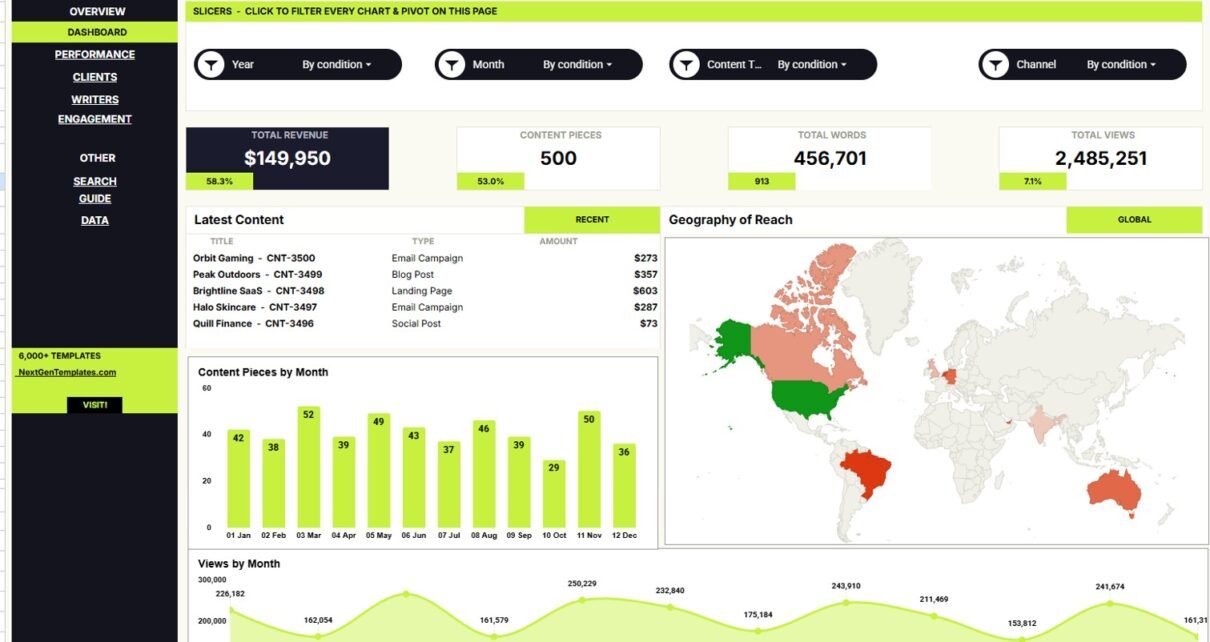
The Copywriting and Content Dashboard in Google Sheets gives content teams 7 working tabs, 4 headline KPI cards, and 16 chart views from one editable data table. It is built for copywriting agencies, content marketers, freelancers, SEO teams, and small businesses that want to monitor revenue, content volume, writing output, views, reach, and engagement without paying for a monthly reporting platform.
The template runs inside Google Sheets, so users can copy it into Google Drive, share it with teammates, and update records from any browser. The workbook includes an Overview Page, Performance Analysis, Clients Analysis, Writers Analysis, Engagement Analysis, Search Sheet, and Data Sheet. Get the Copywriting and Content Dashboard in Google Sheets if you want a ready-made reporting structure for content operations.
Key Features of Copywriting and Content Dashboard in Google Sheets
- Four KPI cards: Track Total Revenue, Content Pieces, Total Words, and Total Views from the top of the Overview Page.
- Seven sheet tabs: Move from executive summary to performance, client, writer, engagement, search, and raw data views.
- Sixteen chart views: Review revenue, content pieces, words, hours, views, reach, engagement, clients, writers, countries, regions, channels, and content type.
- Multiple slicers: Filter the dashboard quickly by meaningful dimensions instead of rebuilding reports.
- Search Sheet: Select a Content ID and view Date, Client, Content Type, Channel, Writer, Region, Status, Words, Hours, Revenue, Views, and Engagements.
- Editable Data Sheet: Replace sample records in the same format and keep the dashboard connected to one source table.
- Google Sheets collaboration: Share the workbook through Google Drive permissions for review, editing, or reporting.
Dashboard Pages Explanation
1. Overview Page
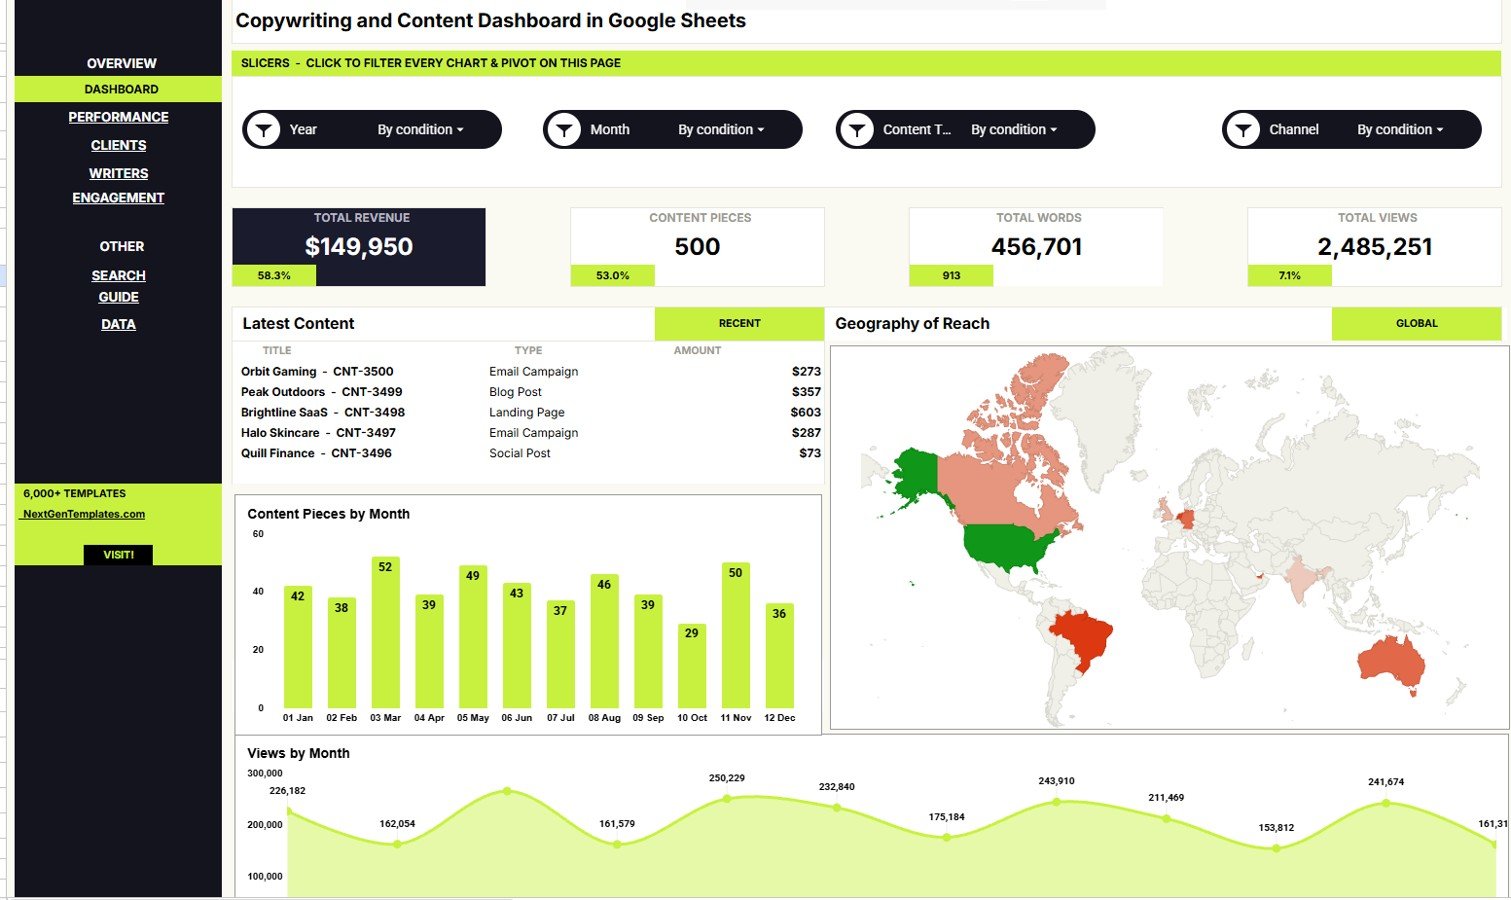
The Overview Page shows the high-level health of the content operation. The top cards summarize Total Revenue, Content Pieces, Total Words, and Total Views so managers can scan the most important metrics before going deeper.
Get the Copywriting and Content Dashboard in Google Sheets
- Recent Content Amount by Title: This chart shows recent content titles by amount. It helps identify the newest pieces or deliverables contributing the most revenue.
- Content Pieces by Month: This chart tracks production volume by month. It helps reveal busy periods, slower months, and changes in team output.
- Reach by Country: This chart compares content reach across countries. It helps teams see where their content is gaining visibility.
- Views by Month: This chart follows monthly view movement. It helps confirm whether audience attention is growing, flat, or declining.
2. Performance Analysis
The Performance Analysis tab focuses on what the team produced and where content is being consumed. It is especially useful for campaign retrospectives, monthly reporting, and format planning.
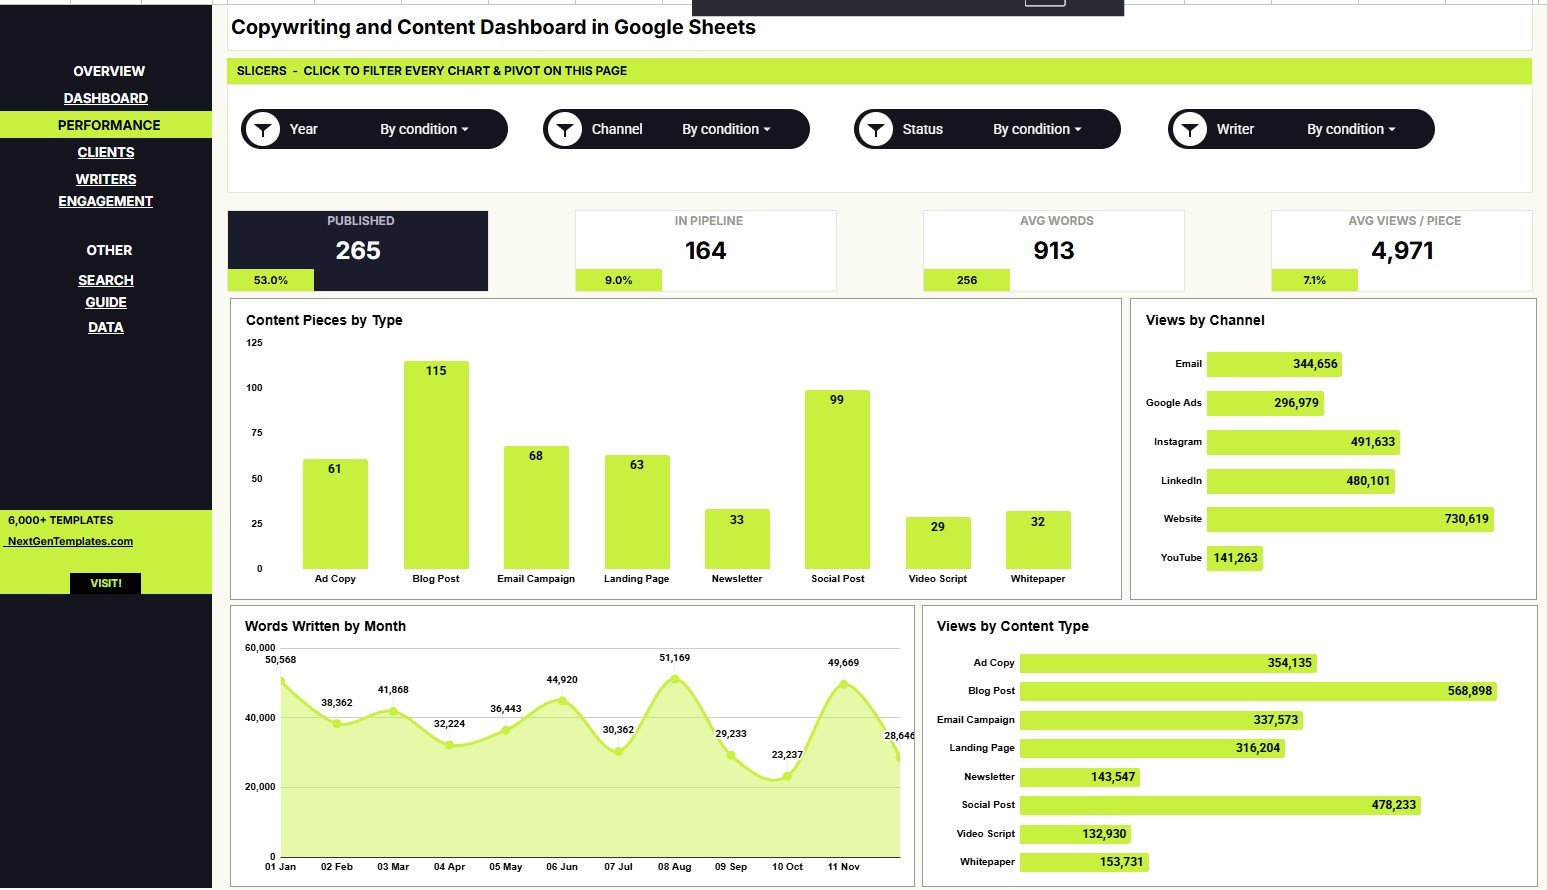
- Content Pieces by Type: This chart counts created items by content type. It helps compare formats such as blog posts, landing pages, email copy, ads, and social content.
- Views by Channel: This chart shows views by distribution channel. It helps identify where the same content effort is generating stronger audience attention.
- Words Written by Month: This chart tracks writing output over time. It helps monitor workload, planning intensity, and production capacity.
- Views by Content Type: This chart compares views across content formats. It helps teams decide which formats deserve more promotion or production time.
3. Clients Analysis
The Clients Analysis tab ties content work to client revenue and monthly value. Agencies and freelancers can use it to review account performance beyond just the number of deliverables completed.
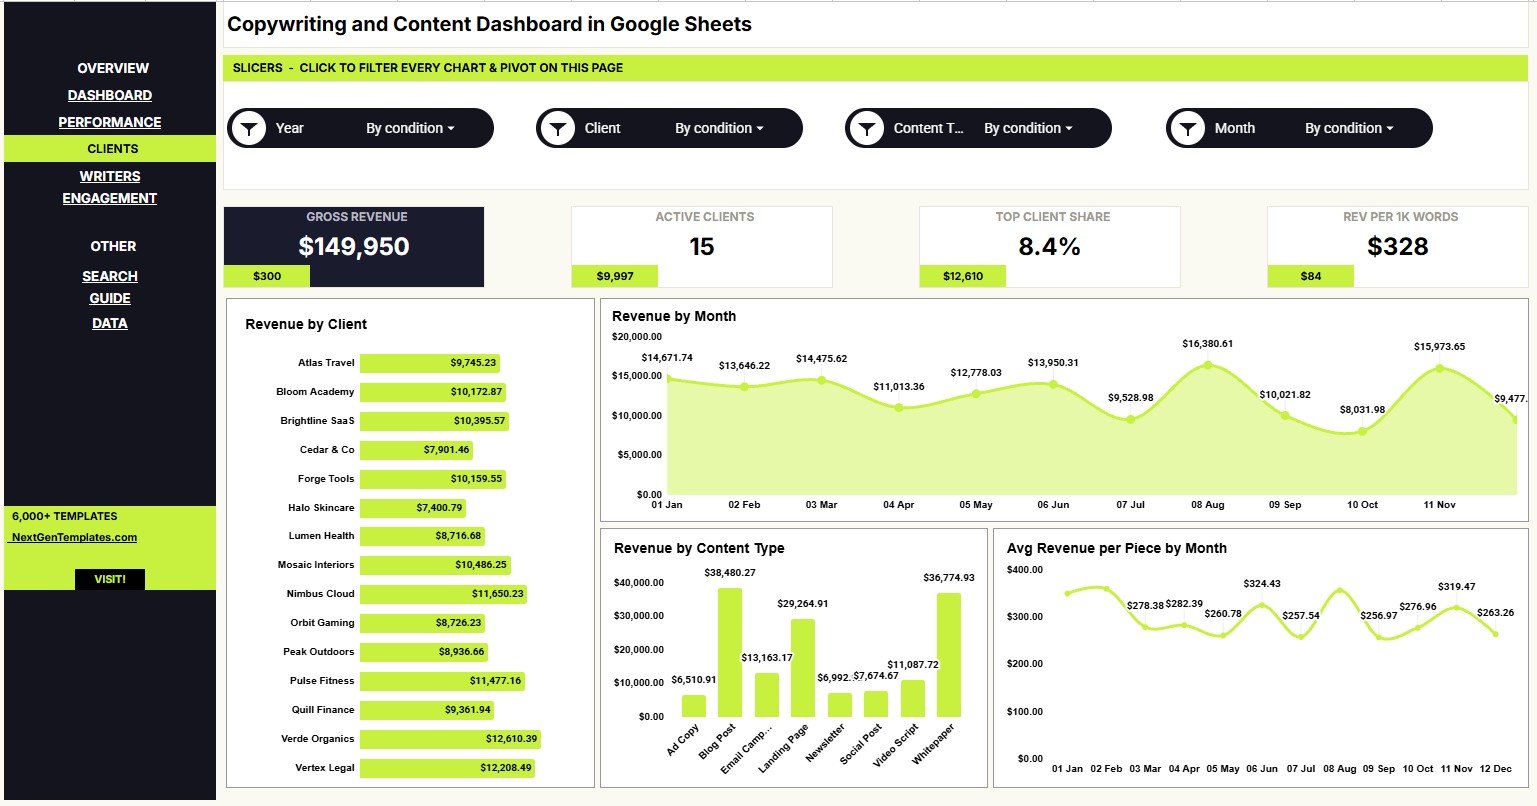
- Revenue by Client: This chart ranks clients by revenue. It helps account managers identify key clients and clients that may need retention attention.
- Revenue by Month: This chart shows revenue movement across months. It helps teams review seasonality, campaign timing, and slow revenue periods.
- Revenue by Content Type: This chart compares revenue by deliverable format. It helps reveal whether certain writing outputs are more commercially valuable.
- Average Revenue per Piece by Month: This chart calculates average value per content item by month. It helps separate high-volume months from high-value months.
4. Writers Analysis
The Writers Analysis tab gives team leads a structured view of writer contribution and workload. It helps review output without losing sight of hours, words, and revenue context.
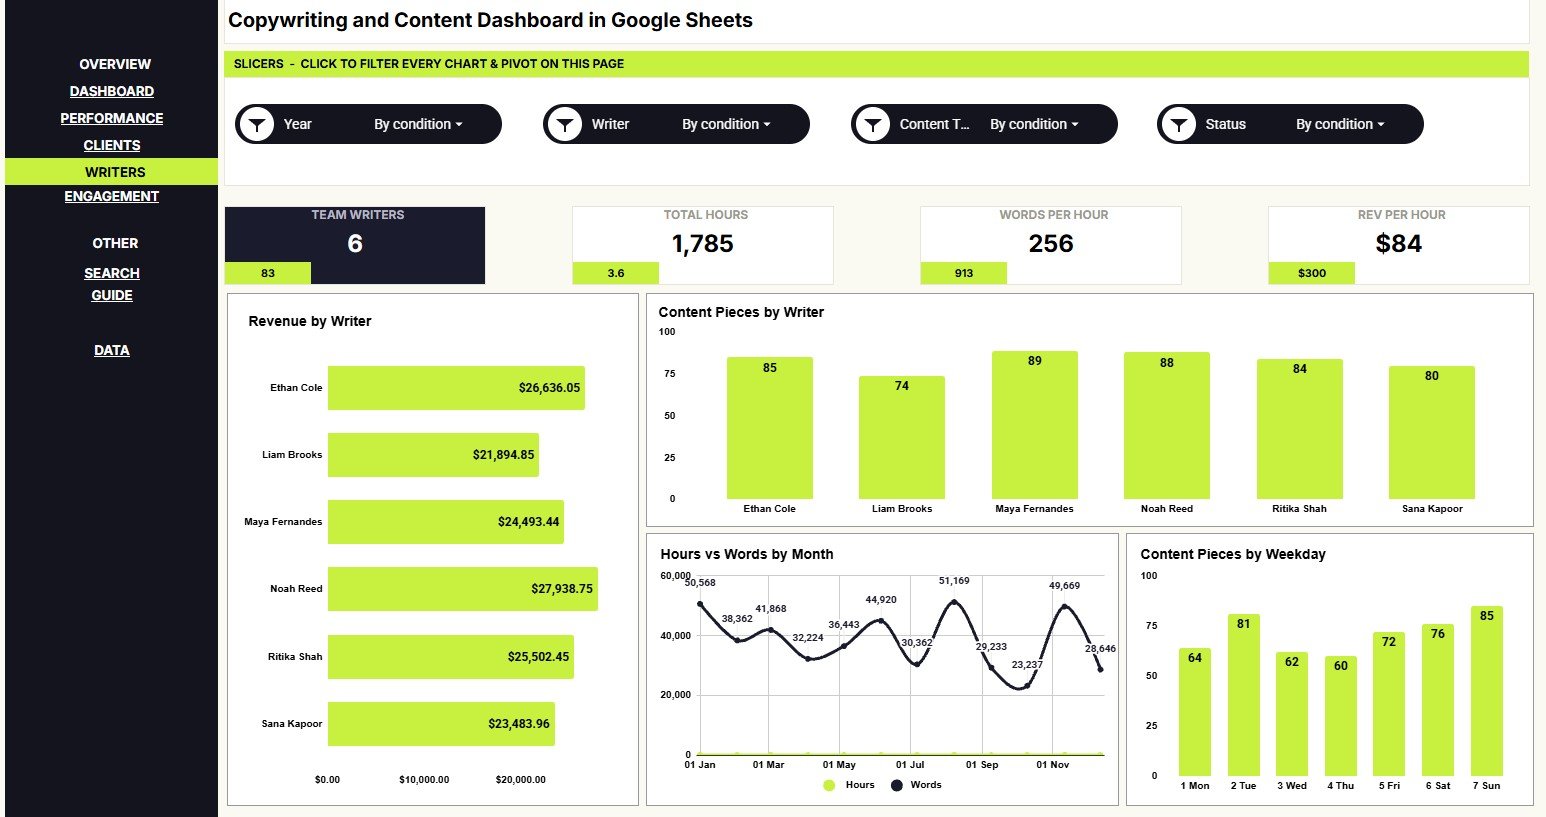
- Revenue by Writer: This chart compares revenue connected to each writer. It helps managers review contribution while considering assignment type and client mix.
- Content Pieces by Writer: This chart counts content pieces by writer. It helps identify uneven workloads and plan future assignments more carefully.
- Hours and Words by Month: This chart compares time spent with words produced. It helps teams understand how effort and output move together.
- Content Pieces by Weekday: This chart shows when content is usually completed. It helps managers spot scheduling patterns and potential bottlenecks.
5. Engagement Analysis
The Engagement Analysis tab connects distribution, reach, views, and interaction. It is useful when the goal is not only publishing more content, but understanding which content creates response.
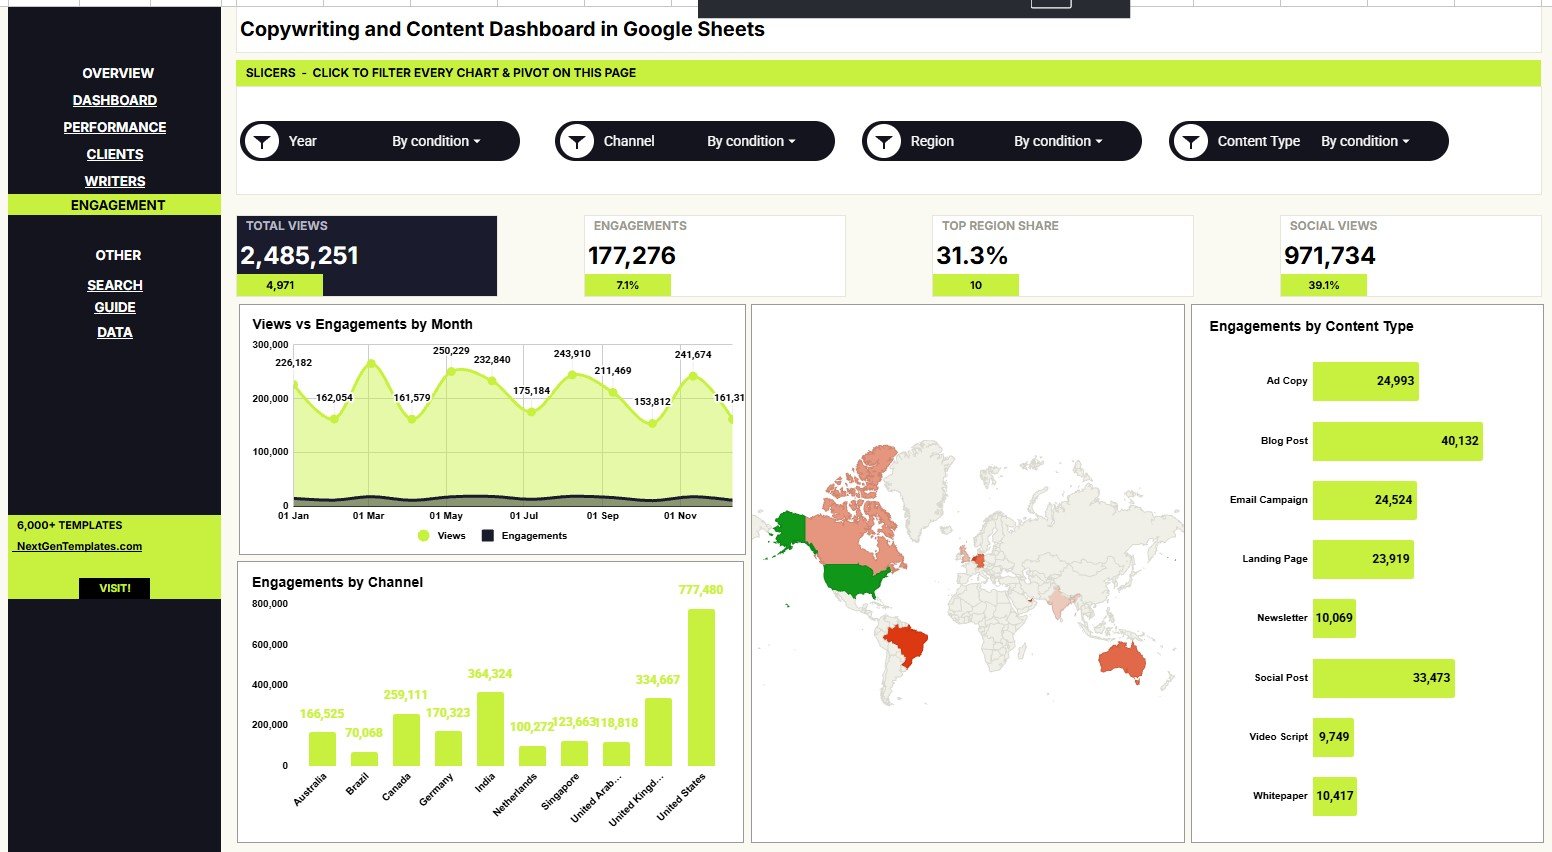
- Views and Engagements by Month: This chart compares attention and interaction over time. It helps show whether content is only being seen or also prompting action.
- Engagements by Channel: This chart breaks engagement down by channel. It helps teams focus distribution effort where interaction is stronger.
- Reach by Region: This chart compares reach across regions. It helps reveal territories where content is spreading more effectively.
- Engagements by Content Type: This chart compares engagement across content formats. It helps identify formats that generate stronger audience response.
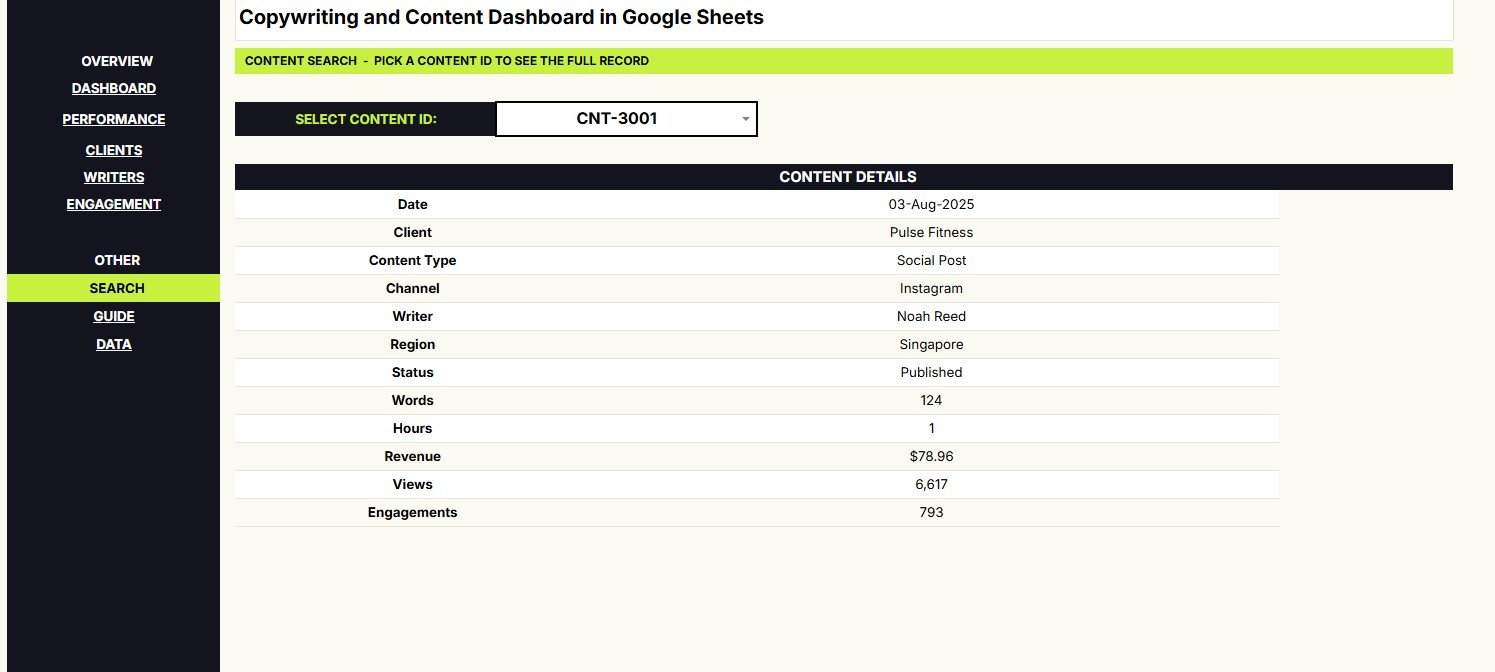
6. Search Sheet Tab
The Search Sheet lets users select a Content ID and instantly view a full record. The visible record includes Date, Client, Content Type, Channel, Writer, Region, Status, Words, Hours, Revenue, Views, and Engagements.
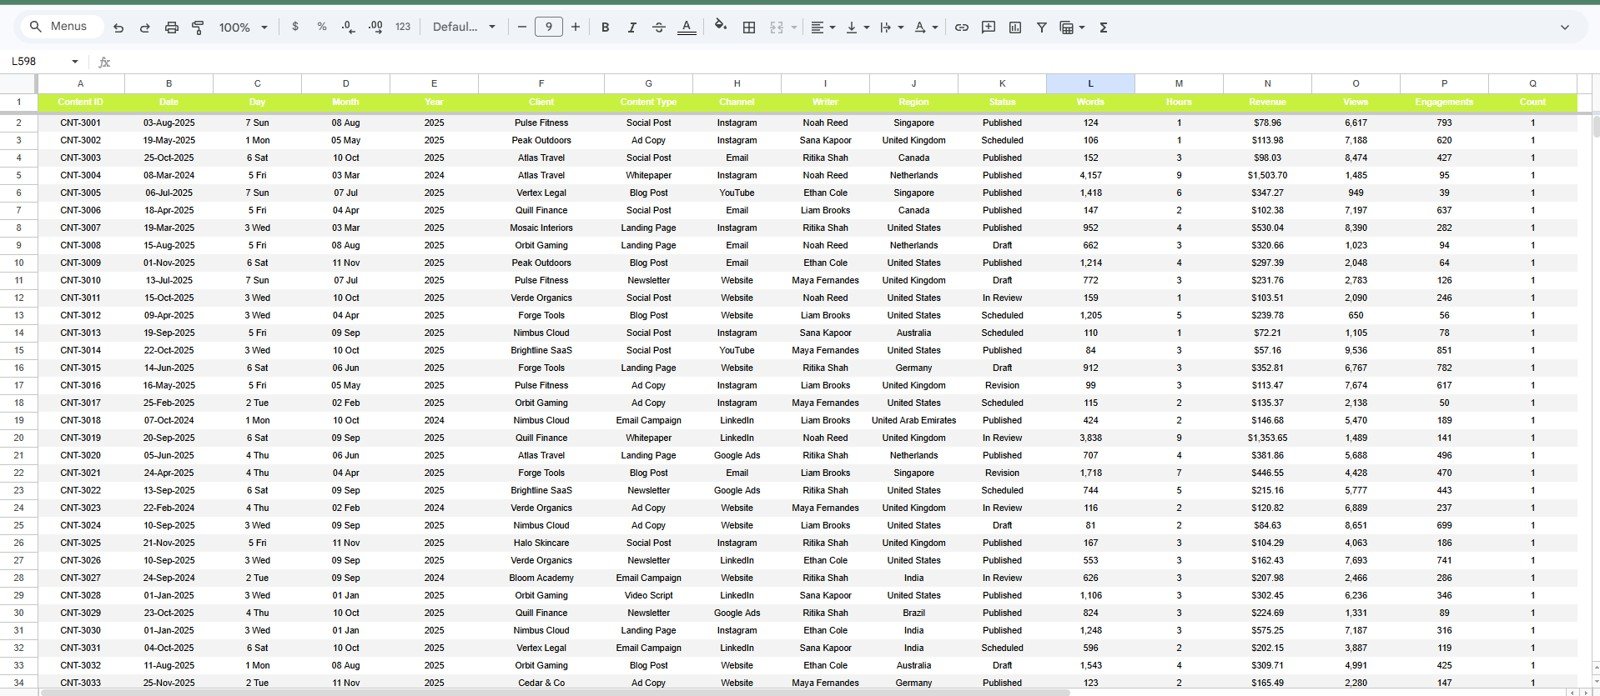
7. Data Sheet Tab
The Data Sheet is where users add content records in the same format. Clean and consistent naming for client, writer, channel, region, country, status, and content type will keep slicers and charts accurate.
Copywriting and Content Dashboard in Google Sheets vs. Microsoft Excel Dashboard vs. Paid CRM/SaaS – Feature Comparison
| Feature | Copywriting and Content Dashboard in Google Sheets | Microsoft Excel dashboard | Paid marketing SaaS or CRM |
|---|---|---|---|
| Cost | $9.99 one-time template price | Template cost plus Excel access where needed | Monthly or annual subscription |
| Platform | Google Sheets in the browser | Excel desktop or web | Vendor-hosted web app |
| Setup time | Copy workbook and replace sample records | Download workbook and adapt data | Account setup, imports, users, and training |
| Real-time team collaboration | Native Google Drive sharing | Available with OneDrive or SharePoint | Usually available by paid seat |
| Mobile access | Google Sheets app or browser | Excel app or browser | Usually app or browser based |
| Customizable fields | Editable sheet structure | Editable workbook structure | Depends on vendor settings |
| Share with link | Yes, controlled by Drive permissions | Yes, with supported cloud storage | Usually invite or login based |
| Year-1 cost at 5 users | $9.99 template price, excluding Google account costs | Depends on Microsoft licensing | Often hundreds or thousands per year |
| Content ID lookup | Included Search Sheet | Possible with formulas | Usually tied to app records |
| Best use case | Manual or export-based content reporting | Desktop workbook reporting | Integrated content workflows and automation |
Who Should Use This Template
- Content agencies that report revenue, workload, views, and engagement by client.
- Freelance copywriters who want to track content value, hours, words, and client output.
- Marketing managers who need an editable monthly content reporting file.
- SEO and content teams that compare formats, channels, countries, regions, and publishing trends.
- Small businesses that want a reporting dashboard before committing to a paid content operations platform.
This is not the best fit if you need live API imports, automated approval workflows, content briefs, AI writing, billing, contracts, or full project management. It is a spreadsheet reporting template for the records you enter.
Real-World Use Cases
Agency Account Review
An account manager can filter the Overview and Clients Analysis pages by client before a reporting call. Revenue by Client and Revenue by Content Type make it easier to explain where content value is coming from.
Writer Workload Planning
A content operations lead can use Content Pieces by Writer, Hours and Words by Month, and Content Pieces by Weekday to balance assignments. This supports a clearer discussion about workload rather than relying only on memory.
Freelancer Retainer Review
Get the Copywriting and Content Dashboard in Google Sheets
A freelance copywriter can compare Average Revenue per Piece by Month, total words, and engagement trends before renegotiating a retainer. The Search Sheet helps retrieve one Content ID quickly during a client discussion.
Advantages of Copywriting and Content Dashboard in Google Sheets
- Fast to adopt: Users can copy the file, replace sample data, and start reviewing dashboard pages.
- Easy to share: Google Sheets supports browser access and team permissions through Google Drive.
- Focused on content operations: The metrics fit copywriting, content creation, client reporting, writer productivity, and engagement analysis.
- Low recurring cost: The dashboard is a one-time template purchase rather than a recurring SaaS subscription.
- Flexible reporting cadence: Teams can use it for weekly production check-ins, monthly client reports, and quarterly content reviews.
Opportunities for Improvement
The dashboard does not connect automatically to every CMS, social platform, or analytics tool. Teams that need live imports can export records from those systems and paste them into the Data Sheet in the same structure.
The template also depends on consistent data entry. If one writer is entered as “A. Kumar” in one row and “Arjun Kumar” in another, charts may split that person into separate entries. A short naming standard will make the dashboard much more useful.
Best Practices
- Keep Content ID values unique: Unique IDs make the Search Sheet reliable.
- Standardize labels: Use consistent client, writer, channel, region, country, status, and content type values.
- Update on a fixed cadence: Weekly or monthly updates keep the dashboard aligned with current performance.
- Use slicers carefully: Google explains how slicers filter tables, charts, and pivot tables in the official Google Docs Editors Help article on slicers.
- Protect formula areas: Give edit access only to users responsible for maintaining the data structure.
- Keep a backup copy: Save a clean version before making major formula, chart, or layout changes.
Explore Relevant Templates
- Copywriting and Content Dashboard in Google Sheets
- Content Marketing KPI Dashboard in Google Sheets
- Content Creator Revenue Dashboard in Google Sheets
- YouTube Channel Analytics Dashboard in Google Sheets
- Social Media Performance Dashboard in Google Sheets
- Browse all Google Sheets dashboard templates on NextGenTemplates.
Frequently Asked Questions
Get the Copywriting and Content Dashboard in Google Sheets
What is the Copywriting and Content Dashboard in Google Sheets?
It is an editable Google Sheets dashboard template for tracking content revenue, pieces, words, views, clients, writers, channels, regions, countries, statuses, hours, and engagements.
Which sheet tabs are included?
The workbook includes Overview, Performance Analysis, Clients Analysis, Writers Analysis, Engagement Analysis, Search Sheet, and Data Sheet tabs.
What does the Search Sheet show?
The Search Sheet lets users select a Content ID and view Date, Client, Content Type, Channel, Writer, Region, Status, Words, Hours, Revenue, Views, and Engagements.
Can I use this dashboard with my team?
Yes. Because it is built in Google Sheets, you can share the copied workbook through Google Drive with viewer or editor permissions.
Does the dashboard import data automatically?
No. It is designed for manual entry or prepared exports. Add records to the Data Sheet using the same column format.
Can I customize content types, clients, and writers?
Yes. The sheet is editable. Keep formulas, chart ranges, slicer ranges, and column headers aligned when making structural changes.
Is this a full content management system?
No. It is a reporting dashboard and lookup tool. It does not include task assignments, approvals, briefs, publishing automation, or invoicing.
About the Author
Built by PK – Microsoft Certified Professional with 15+ years of Excel, Google Sheets, and Power BI experience. Founder of NextGenTemplates, reaching 300K+ subscribers across YouTube channels. Every template is hand-built and tested before release.
Conclusion
The Copywriting and Content Dashboard in Google Sheets gives content teams a practical way to review revenue, production, writing output, views, reach, engagement, clients, writers, channels, regions, and content records in one shareable spreadsheet. It is a good fit when you want a structured dashboard without paying for a full content SaaS platform.
Get the Copywriting and Content Dashboard in Google Sheets and start turning content records into repeatable reporting.
For more Google Sheets dashboard templates and video tutorials, visit Youtube.com/@NeotechNavigators.
Last updated: July 30, 2026.