Cloud Kitchen Management System Tracker in Google Sheets is a seven-tab workbook for cloud kitchens that need order tracking, revenue analysis, menu margins, inventory movement, expense control, monthly P&L, setup lists, and reports in one editable file. It includes 8 overview KPI cards and 55 named analysis views, covering channel performance, brand revenue, food cost %, gross profit, wastage, stock status, supplier value, commission, and net profit. For small virtual kitchen teams, this gives a practical one-time alternative to scattered order sheets or recurring restaurant software.Cloud Kitchen
The template is built for the Google Sheets workflow: copy the file, update your brands, channels, suppliers, riders, menu items, commission percentages, and status lists, then keep daily order and cost data in the same structure. If you are ready to use it, download it from NextGenTemplates.
Get the Cloud Kitchen Management System Tracker in Google Sheets
Key Features of Cloud Kitchen Management System Tracker in Google Sheets
- Seven connected pages: Overview, Order Log, Menu and Pricing, Inventory, Expenses and Monthly P&L, Data Sheet, and Reports.
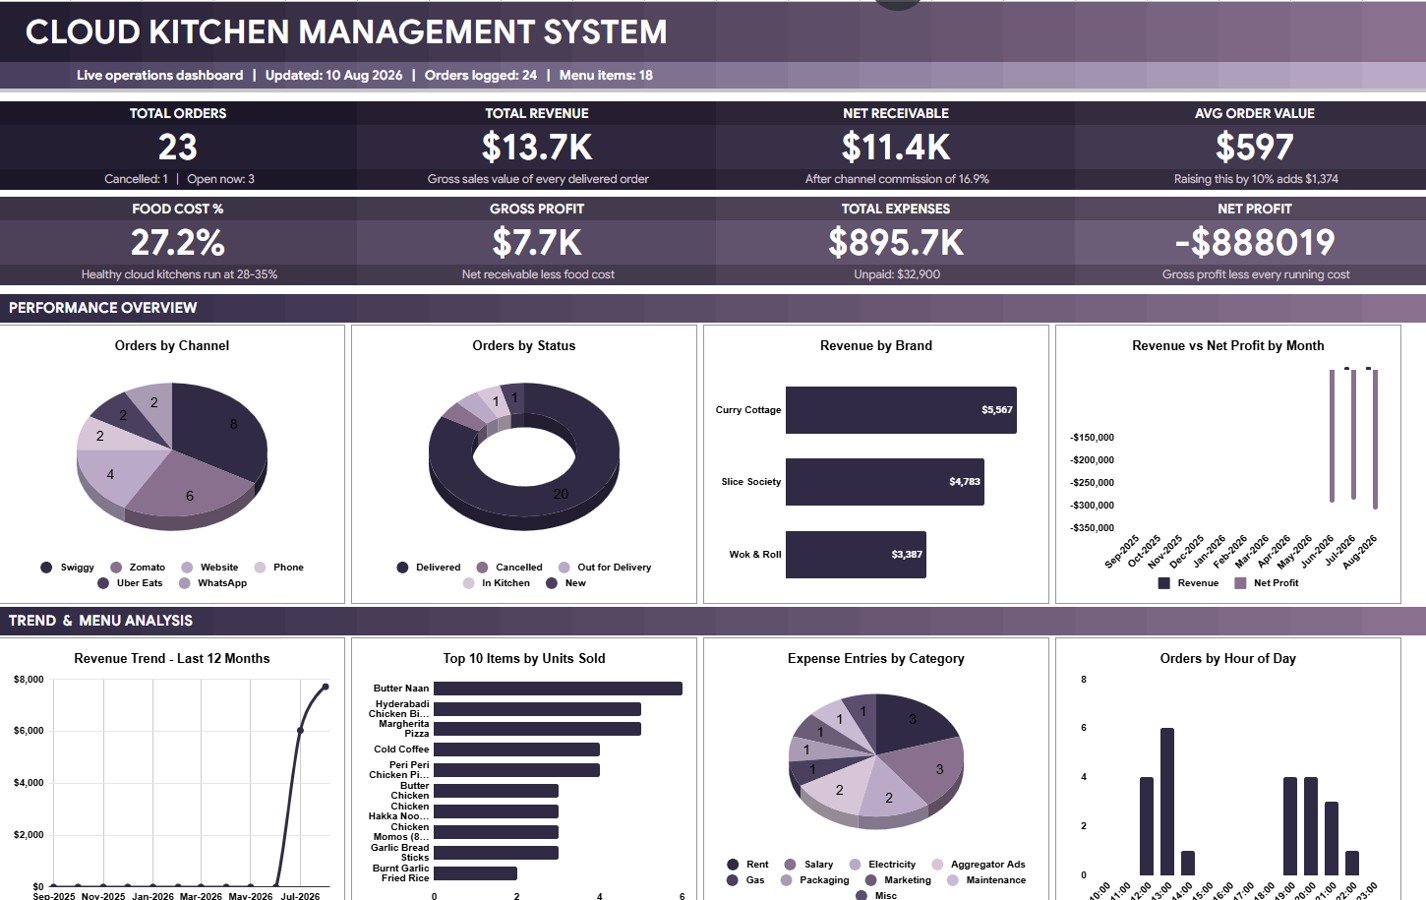
- Eight executive cards: Total Orders, Total Revenue, Net Receivable, Avg Order Value, Food Cost %, Gross Profit, Total Expenses, and Net Profit.
- Channel reporting: Compare orders, commission, receivables, payment modes, and statuses by delivery channel.
- Brand-level performance: See revenue, net receivable, gross profit, and sales by brand.
- Menu profitability: Review food cost %, margin per unit, units sold, total margin, item availability, and menu class rank.
- Inventory and wastage control: Track opening stock, purchases, usage, wastage, closing stock, supplier value, and reorder status.
- Monthly P&L view: Connect revenue, commission, food cost, expenses, net profit, and paid status for finance review.
- Editable Google Sheets setup: Customize suppliers, riders, partners, brands, channels, commission percentages, and order status values.
Dashboard Pages Explanation
1. Overview Page
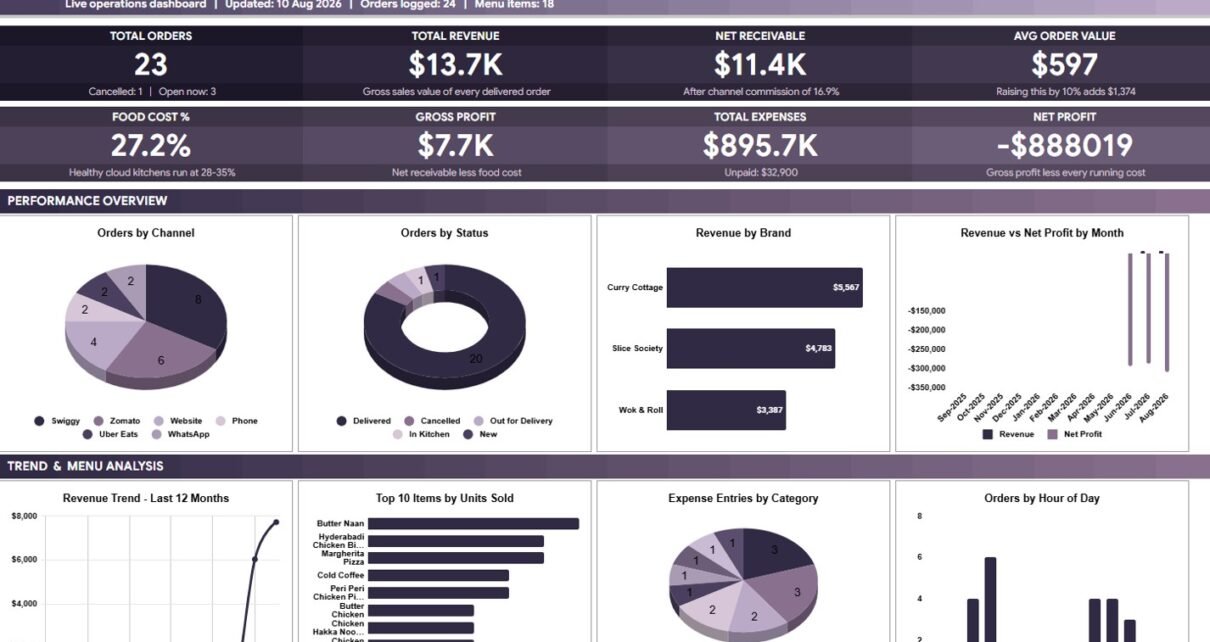
The Overview Page is the daily command view. It brings Total Orders, Total Revenue, Net Receivable, Avg Order Value, Food Cost %, Gross Profit, Total Expenses, and Net Profit into one top section, then uses slicers so managers can filter the dashboard quickly.
Orders by Channel: This chart shows which channels are driving the highest order count. It helps owners compare direct, aggregator, and partner demand before changing marketing or commission strategy.
Orders by Status: This chart separates delivered, pending, cancelled, rejected, or other status values. It helps operations teams spot service issues before they affect revenue and customer experience.
Revenue by Brand: This chart compares sales across virtual brands. It helps a kitchen decide which brand deserves menu expansion, marketing push, or pricing review.
Revenue vs Net Profit by Month: This chart places topline sales beside bottom-line profit. It reveals whether revenue growth is actually converting into profit after cost and expense pressure.
Revenue Trend by Month: This trend shows month-by-month sales movement. It is useful for identifying seasonality, promotion results, and slow periods.
Top 10 Items by Units Sold: This chart highlights the dishes with the strongest unit demand. It helps kitchen teams protect availability and plan ingredient prep around real sales volume.
Expense Entries by Category: This chart groups cost entries into categories. It makes it easier to see where packaging, staff, rent, utilities, marketing, or other costs are building up.
Orders by Hour of Day: This chart shows hourly order concentration. It helps schedule prep, staffing, and rider coordination around peak slots.
2. Order Log
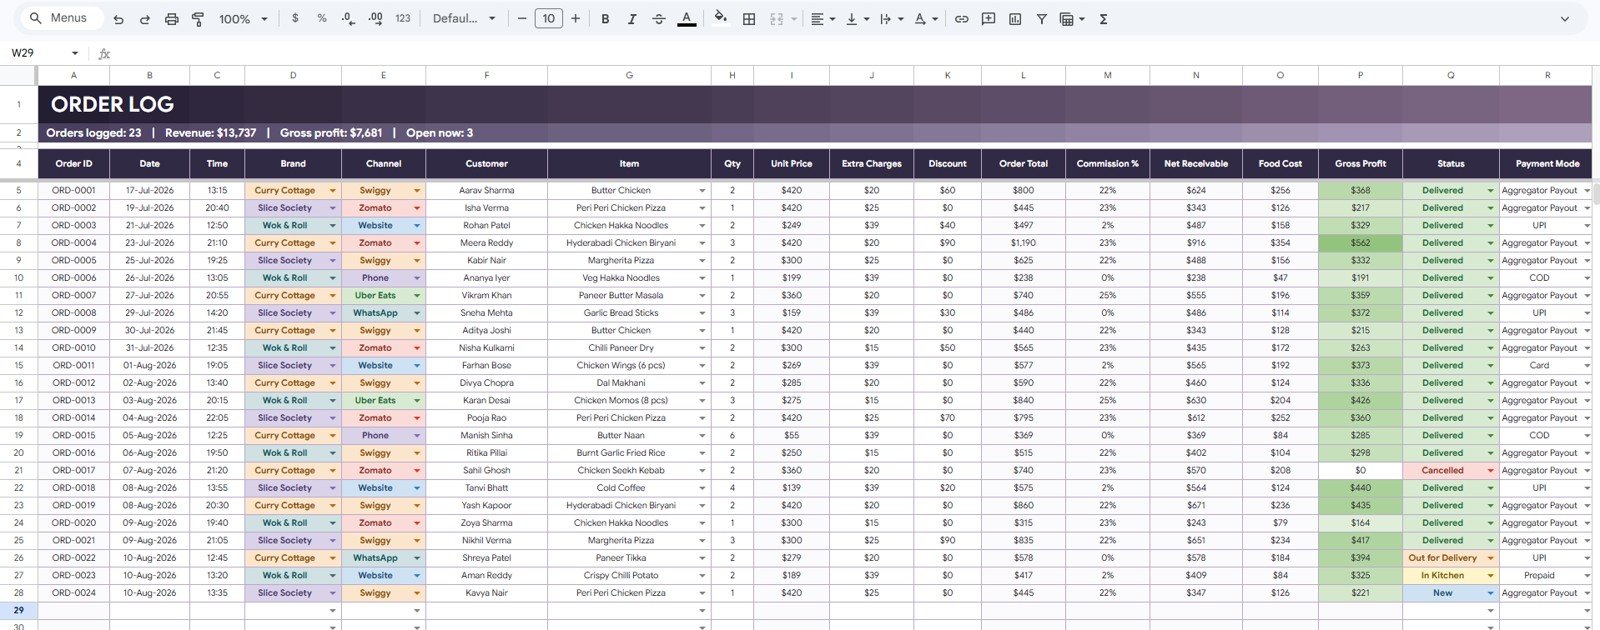
The Order Log tab is the transaction analysis layer. It includes Orders by Date, Orders by Brand, Orders by Channel, Order Total by Customer, Commission by Channel, Net Receivable by Brand, Food Cost by Item, Gross Profit by Item, and Order Status by Payment Mode.
3. Menu and Pricing
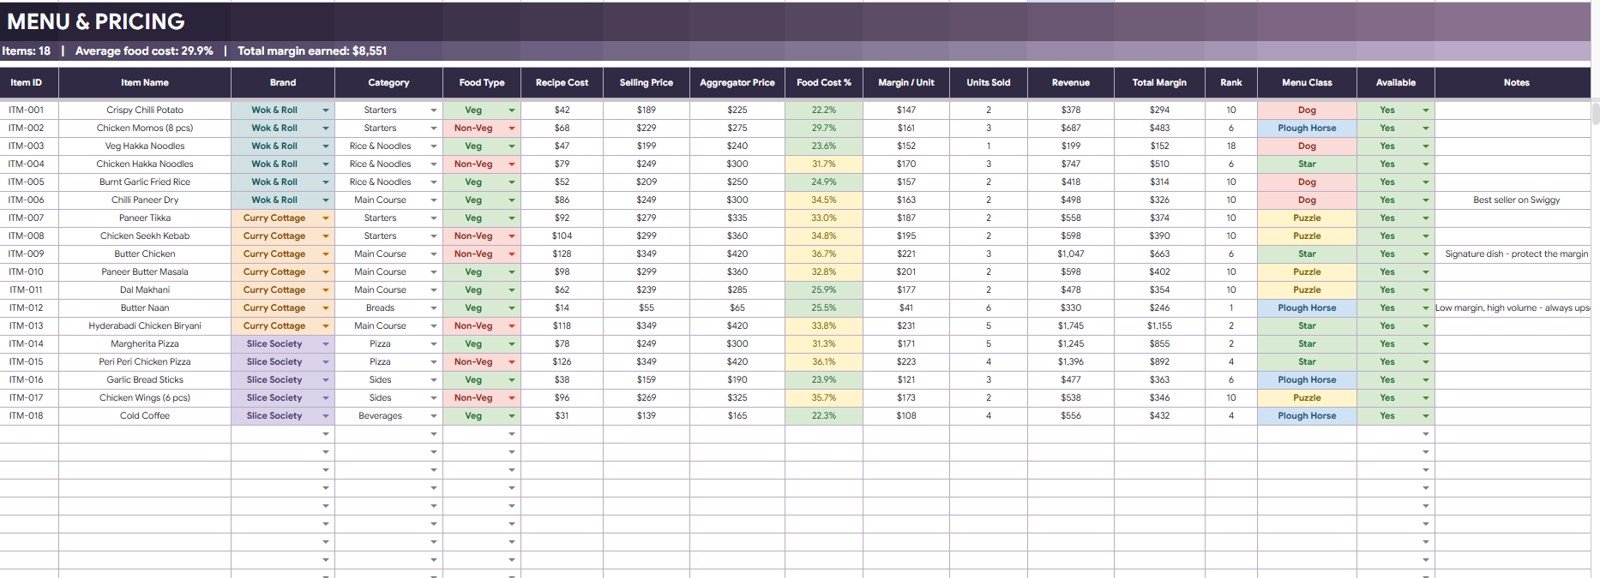
The Menu and Pricing tab is built for item economics. It reviews Food Cost % by Item Name, Margin / Unit by Item Name, Units Sold by Item Name, Revenue by Brand, Total Margin by Menu Class, Menu Class by Rank, and Availability by Item Name.
4. Inventory
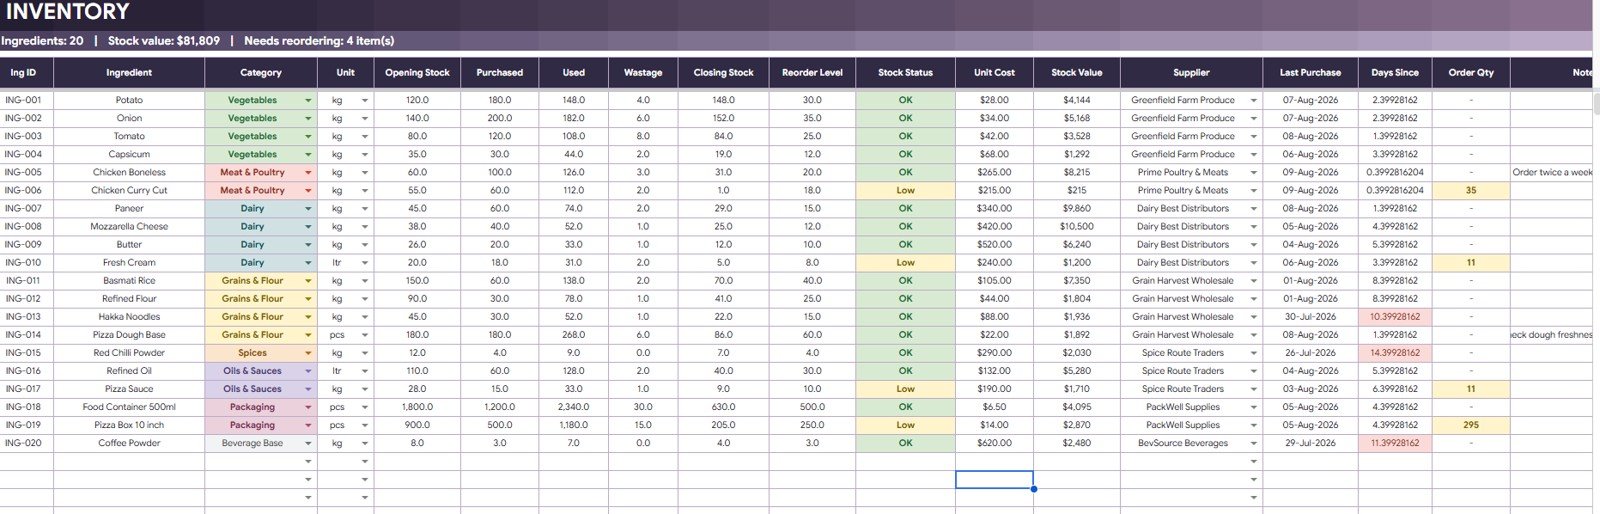
The Inventory tab keeps stock movement visible. It analyzes Opening Stock by Ingredient, Purchased Quantity by Ingredient, Used Quantity by Ingredient, Wastage by Ingredient, Closing Stock by Ingredient, Stock Status by Ingredient, Stock Value by Supplier, and Order Qty by Stock Status.
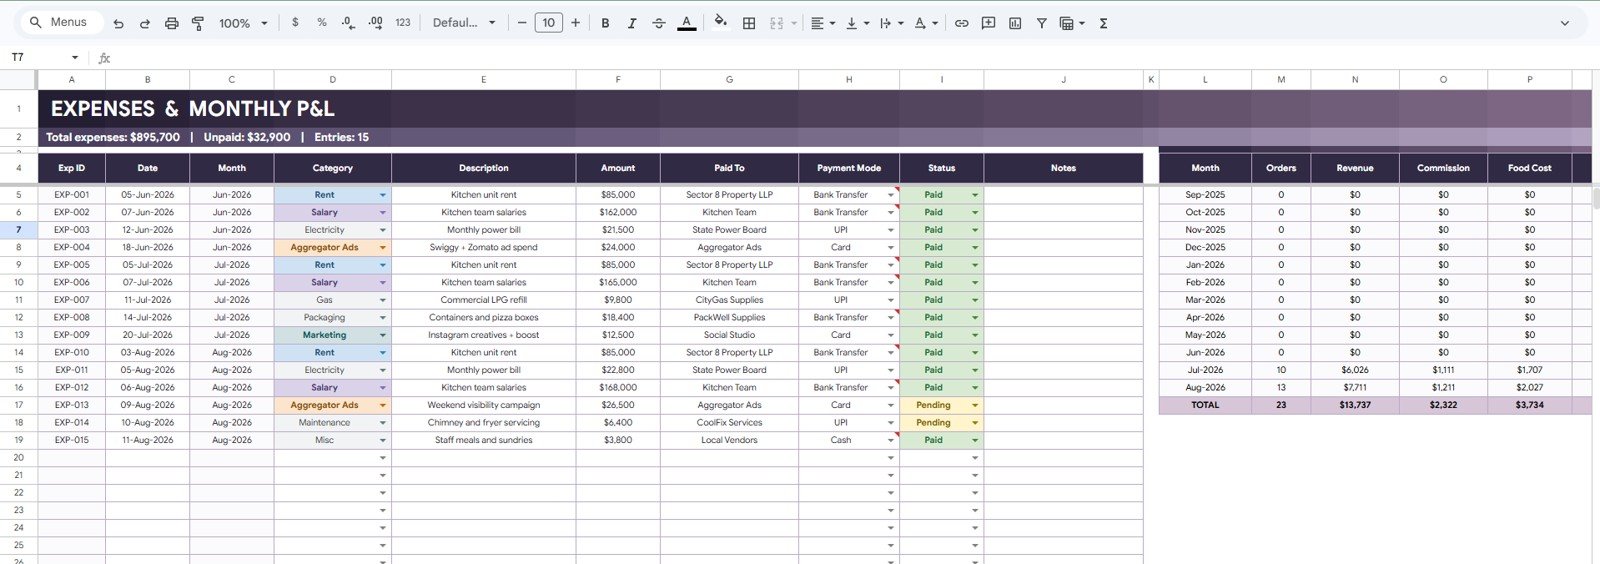
5. Expenses and Monthly P&L
This tab connects operating costs with monthly performance. It includes Expenses by Category, Amount by Month, Paid Status by Expense Date, Payment Mode by Paid To, Orders by Month, Revenue by Month, Commission by Month, and Food Cost by Month.
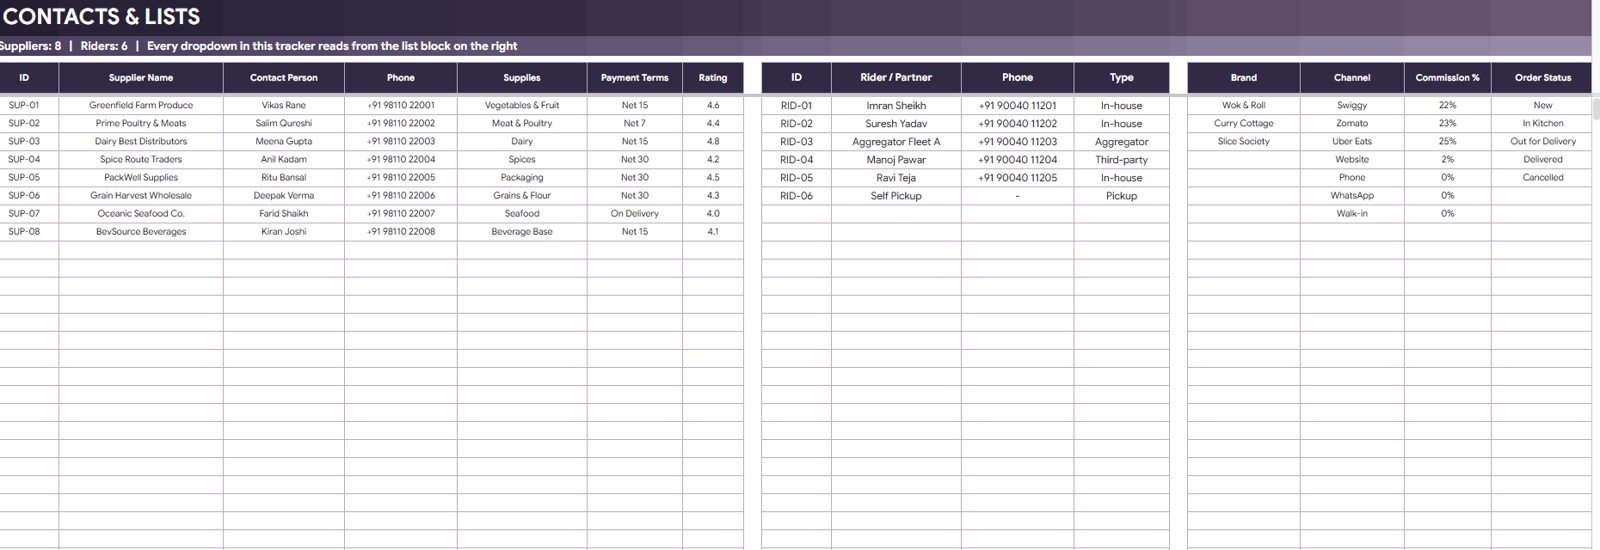
6. Data Sheet Tab
The Data Sheet stores the lookup values that keep reporting consistent. Users can add suppliers, riders, partners, brands, channels, commission percentages, and order status values in the same format, then use those values across the workbook.
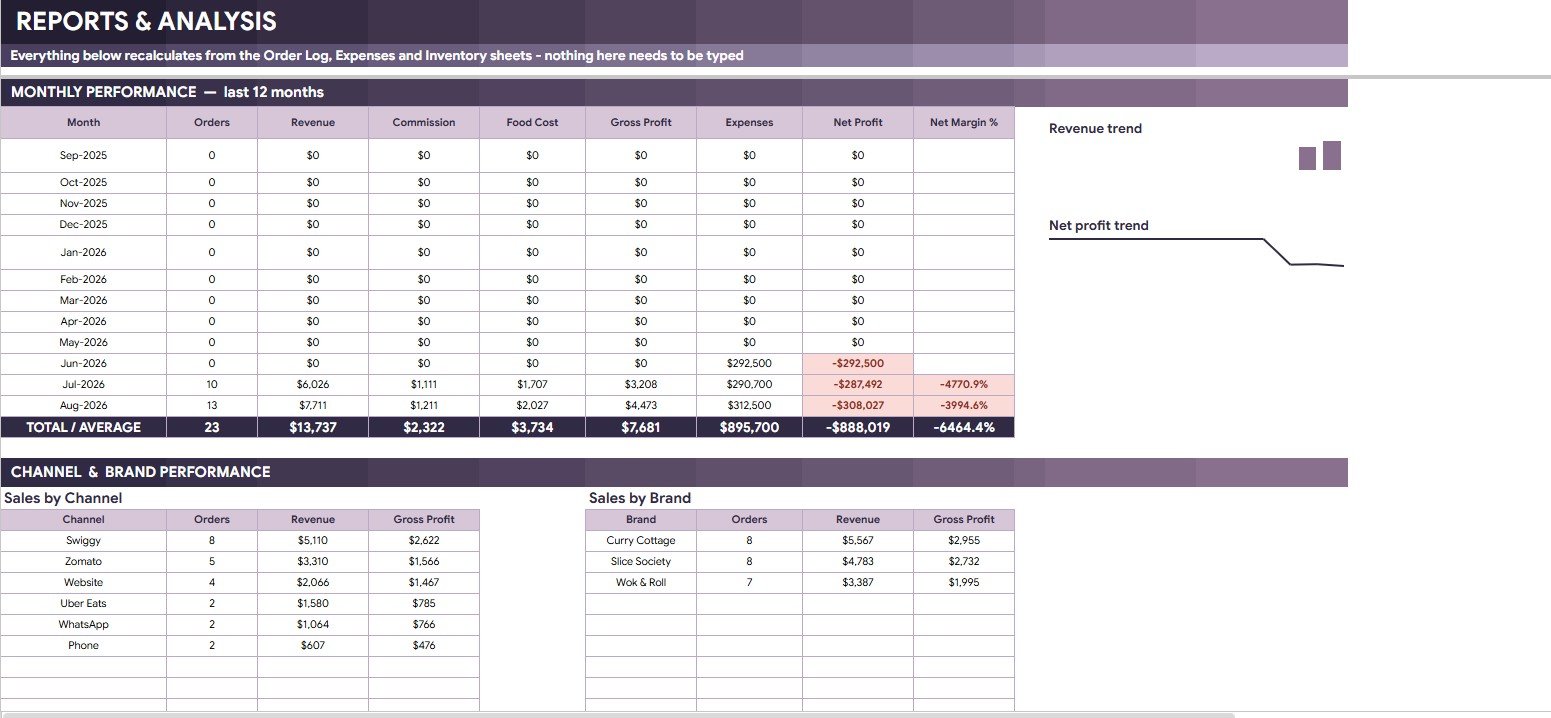
7. Reports Sheet
The Reports sheet gives automatic analysis as order log, expense, and inventory records are added. It summarizes Monthly Performance by Month, Revenue Trend by Month, Net Profit Trend by Month, Sales by Channel, Sales by Brand, Gross Profit by Channel, Gross Profit by Brand, and Orders by Month.
Cloud Kitchen Management System Tracker in Google Sheets vs. Microsoft Excel vs. Paid CRM/SaaS – Feature Comparison
| Feature | This Google Sheets template | Microsoft Excel tracker | Paid restaurant SaaS |
|---|---|---|---|
| Cost | $9.99 one-time sale price | Template cost plus Excel access | Monthly or annual subscription |
| Platform | Google Sheets in browser or mobile app | Excel desktop, web, or mobile | Vendor-hosted cloud app |
| Setup time | Copy file, update lists, add records | Download workbook and configure fields | Onboarding, imports, roles, and training |
| Real-time team collaboration | Native Google Drive sharing | Best with OneDrive or SharePoint | Usually included by plan |
| Mobile access | Google Sheets mobile app or browser | Excel mobile app | Usually included |
| Customizable fields | Editable sheets, lists, formulas, labels, and charts | Editable workbook structure | Limited by vendor configuration |
| Share with link | Yes, with Drive permissions | Yes, with Microsoft sharing | Usually account based |
| Year-1 cost at 5 users | $9.99 before optional Workspace cost | Template plus license costs | Often much higher |
| Cloud kitchen metrics | Food cost, commission, net receivable, stock, wastage, P&L | Requires custom build | Deeper, but less editable |
Who Should Use This Template
This template is useful for cloud kitchen owners, dark kitchen operators, virtual brand managers, restaurant accountants, kitchen supervisors, operations analysts, and consultants who need one shared file for order tracking, food cost review, inventory control, and profit reporting.
It is especially useful when the team already works in Google Sheets and wants a structured workbook before investing in a larger POS, inventory, or restaurant ERP system.
Real-World Use Cases
Cloud kitchen owner: Reviews Total Orders, Net Receivable, Food Cost %, Gross Profit, and Net Profit each night to understand whether delivery-channel sales are profitable.
Kitchen supervisor: Checks top items, closing stock, wastage, supplier stock value, and reorder status before starting prep for the next day.
Accounts assistant: Uses payment mode, channel commission, paid status, monthly expenses, and monthly P&L views before sending the weekly owner summary.
Advantages of Cloud Kitchen Management System Tracker in Google Sheets
- It keeps operations, menu pricing, stock movement, expenses, and reports in one workbook.Cloud Kitchen
- It helps owners connect revenue with food cost, commission, and net profit instead of tracking sales alone.
- It gives small teams a low-cost way to organize data before buying restaurant SaaS.
- It is editable, shareable, and easy to adapt for different cuisines, brands, channels, and order statuses.
- It supports daily close, weekly operating review, and monthly P&L review from the same data structure.
Opportunities for Improvement
This is a spreadsheet tracker, so it does not process payments, pull orders automatically from aggregators, print KOTs, manage live kitchen screens, scan inventory barcodes, or run payroll. A growing operation can later connect Google Sheets with Apps Script, Looker Studio, or a dedicated restaurant platform. For an app-style workflow, compare the Cloud Kitchen Management System Web App.
Best Practices
- Update the Data Sheet first so suppliers, riders, brands, channels, commission %, and order statuses stay consistent.
- Record order log data daily instead of waiting until the end of the week.
- Review Food Cost %, Gross Profit, and Net Receivable together because high revenue can still hide weak margins.Cloud Kitchen
- Protect formula-heavy ranges before sharing edit access with a larger team.
- Use Google Drive permissions carefully when sharing the workbook. Google’s official guide explains how to share files from Google Drive.
- Keep a monthly backup copy before major structure changes.Cloud Kitchen
Explore Relevant Templates
- Cloud Kitchen Management System Tracker in Google Sheets
- Cloud Kitchen Management System Web App
- Buffet Restaurant Management System Tracker in Google Sheets
- Catering Business Management System Web App
- Hospitality & Restaurant Bundle
- Google Sheets tracker templates
Curious how trackers like this are structured? The NextGenTemplates Academy learning paths cover the spreadsheet skills behind them, with practice files.
Get the Cloud Kitchen Management System Tracker in Google Sheets
Frequently Asked Questions
What sheets are included in the Cloud Kitchen Management System Tracker in Google Sheets?
It includes Overview, Order Log, Menu and Pricing, Inventory, Expenses and Monthly P&L, Data Sheet, and Reports tabs.
Can I track multiple virtual brands?
Yes. The tracker includes brand-level revenue, net receivable, channel reporting, and monthly performance views.Cloud Kitchen
Does this template calculate food cost percentage?
Yes. It includes Food Cost %, Food Cost by Item, Margin / Unit by Item Name, Gross Profit by Item, and Food Cost by Month views.Cloud Kitchen
Can I use it for delivery channels and commissions?
Yes. The tracker includes channel lists, commission percentages, Orders by Channel, Commission by Channel, and payment-mode analysis.
Does it connect directly with Swiggy, Zomato, Uber Eats, or DoorDash?
No. You enter or import order data manually. The template is a management and reporting workbook, not a live API integration.
Can multiple users work in the file?
Yes. Google Sheets supports shared access through Google Drive, so owners, managers, kitchen staff, and accounts teams can review or edit based on permissions.
About the Author
Built by PK – Microsoft Certified Professional with 15+ years of Excel, Google Sheets, and Power BI experience. Founder of NextGenTemplates, reaching 300K+ subscribers across YouTube channels. Every template is hand-built and tested before release.
Conclusion
The Cloud Kitchen Management System Tracker in Google Sheets gives cloud kitchen teams a clear way to connect orders, brand revenue, channel commission, menu margin, inventory, wastage, expenses, and net profit in one editable workbook. It is best for teams that want daily visibility before investing in heavier restaurant software.
Last updated: August 10, 2026.