Real Estate Development Dashboard in Google Sheets
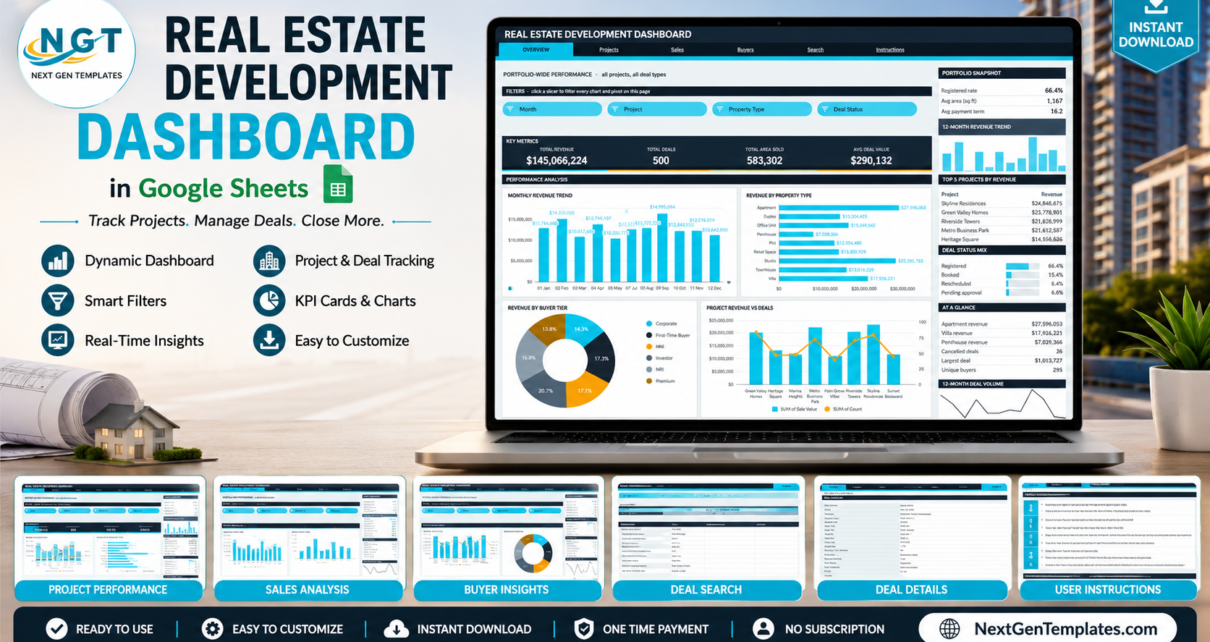
A developer’s sales register knows everything and shows nothing. Total booked value is easy to pull; what is hard, on one screen, is which project earns most per square foot rather than in total, what a pre-launch discount actually costs, and how much of the pipeline is still sitting unregistered. The Real Estate Development Dashboard in Google Sheets is built for those questions – 6 pages, 16 KPI cards, 16 charts, 4 named slicers per page and a deal lookup, all running on native Google Sheets pivot tables and slicers rather than a wall of formulas. The sample file carries 500 deals across 8 projects, 9 property types, 8 booking types and 10 sales agents.
Get the Real Estate Development Dashboard in Google Sheets
This article walks through each page, explains why revenue per square foot is the measure worth building a report around, compares the approach with Excel and a property CRM, and is honest about what it cannot do. The template is available here.Real Estate Development Dashboard in Google Sheets
Key Features of the Real Estate Development Dashboard
Real Estate Development Dashboard in Google Sheets
- Pivot-and-slicer architecture. Every chart reads a native pivot table parked to the right of its page. No hidden helper formulas, which keeps the file quick as the register grows.Real Estate Development Dashboard in Google Sheets
- Named slicers on every analysis page. Month, Project, Property Type and Deal Status on Overview; Project, Booking Type, Month and Buyer Tier on Projects; Booking Type, Property Type, Sales Agent and Buyer Segment on Sales; Buyer Tier, Buyer Segment, Payment Method and Month on Buyers.Real Estate Development Dashboard in Google Sheets
- Revenue per square foot. Sale value and area sold sit on the same rows, so rate per sq ft and average area per deal are calculated rather than guessed.
- Sixteen KPI cards. Four per page, matched to what that page answers.
- A full sidebar on every page. Three-stat snapshot, 12-month revenue sparkline, Top 5 ranking, share-of-revenue bars, a six-row At a Glance panel and a 12-month deal volume sparkline.Real Estate Development Dashboard in Google Sheets
- Booking type analysis. New booking, resale, pre-launch offer, investment deal, possession handover, exchange deal, corporate lease and rent-to-own, each with revenue and share.Real Estate Development Dashboard in Google Sheets
- Agent leaderboard. All ten sales agents ranked by revenue, with a Top 5 panel that stays visible while you filter.Real Estate Development Dashboard in Google Sheets
- Buyer tier and segment analysis. Corporate, First-Time Buyer, HNI, Investor, NRI and Premium tiers, plus business owners, NRI investors, retirees and two salaried brackets.
- Financing mix. Bank loan, cash, corporate finance, installment plan, mortgage and online transfer, with the loan-financed share on the sidebar.
- Deal lookup. Enter a Deal ID and read the complete record for that transaction.
Dashboard Pages Explanation
Page 1 – Overview
Real Estate Development Dashboard in Google Sheets
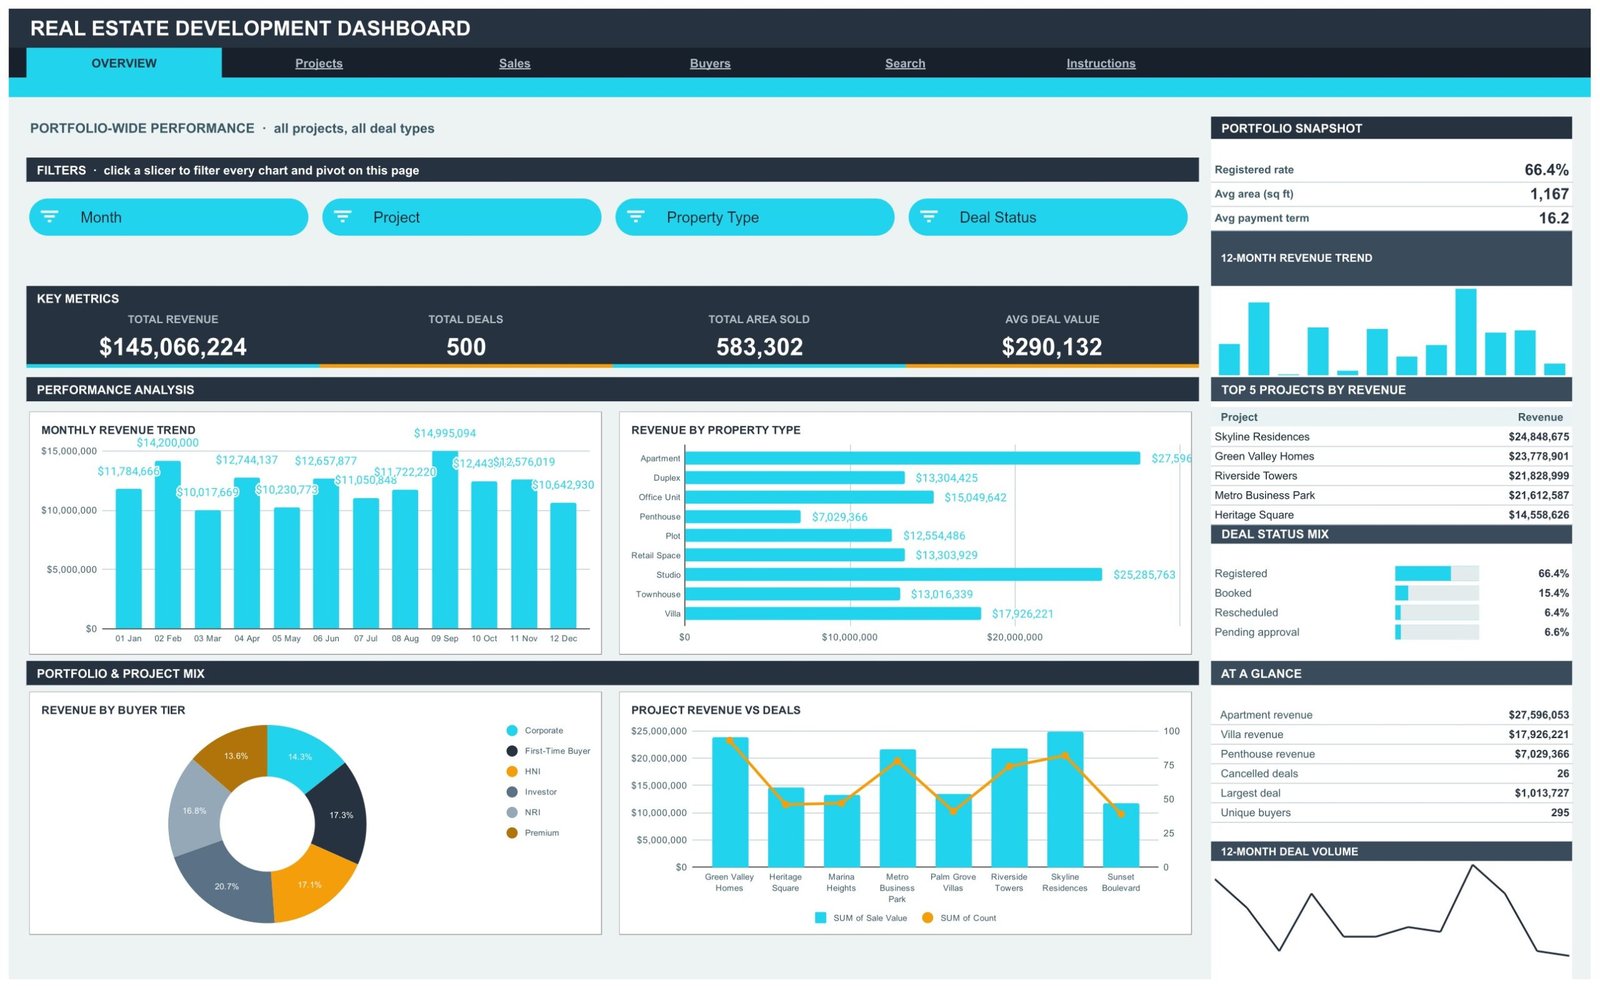
Portfolio-wide performance across all projects and deal types. Total Revenue, Total Deals, Total Area Sold and Avg Deal Value, with Monthly Revenue Trend, Revenue by Property Type, Revenue by Buyer Tier and Project Revenue vs Deals. The sidebar adds registered rate, average area, average payment term, the top five projects and the deal status mix.Real Estate Development Dashboard in Google Sheets
Page 2 – Projects
Revenue, area and deal-type mix by project. Registered Deals, Total Area, the leading project’s revenue and Avg Area per Deal, with Revenue vs Area Sold, Revenue by Project & Booking Type, Monthly Area Sold and Deals by Status. Revenue per sq ft, average payment term and the pending-approval rate sit on the sidebar.
This is the page that most often changes someone’s mind. A project can top the revenue table simply because its units are larger; the moment revenue is set against area sold, the ranking by rate per square foot can look completely different – and that is the number the next phase should be priced from.
Page 3 – Sales
Real Estate Development Dashboard in Google Sheets
Deal type, property and agent performance. Investment Deal Revenue, Corporate Leases, Pre-Launch Revenue and Largest Deal, with Revenue by Booking Type, Property Type Revenue vs Deals, Revenue by Sales Agent and Area Sold by Buyer Segment. The Top 5 Agents panel and deal-type revenue share sit on the sidebar.Real Estate Development Dashboard in Google Sheets
Page 4 – Buyers
Buyer tiers, segments and payment behaviour. HNI Revenue, Corporate Deals, Unique Buyers and Pending Approval Rate, with Deals by Buyer Tier, Buyer Segment Revenue vs Area, Revenue by Payment Method and Monthly Deal Volume. Revenue per buyer, deals per buyer and the loan-financed share sit on the sidebar – the last of those matters more than it looks, because a portfolio heavily dependent on bank finance is exposed to rate movements in a way a cash-heavy one is not.Real Estate Development Dashboard in Google Sheets
Page 5 – Search
Pick a Deal ID and the page returns the full record: date, project, property type, booking type, buyer name, buyer tier, sale value, area, payment term, sales agent, payment method, deal status, buyer segment, month and quarter.Real Estate Development Dashboard in Google Sheets
Page 6 – Instructions
A ten-point user guide covering how the pivots and slicers are wired, how to replace the sample data and how to raise the row limit. It also explains the design decision people most often misread: the KPI cards and the At a Glance list use SUMIFS and COUNTIFS against the Data sheet, so they always show unfiltered totals as a fixed reference, while the charts, pivots and Top 5 panels are slicer-aware.Real Estate Development Dashboard in Google Sheets
Real Estate Development Dashboard vs. an Excel
Real Estate Development Dashboard in Google Sheets Report vs. a Property CRM – Feature Comparison
| This Google Sheets dashboard | A hand-built Excel report | Property CRM analytics | |
|---|---|---|---|
| Cost | Under 10 once | Free, plus your build time | Bundled into 50 to 300 per user per month |
| Platform | Google Sheets, any browser | Excel on desktop | Vendor web app |
| Setup time | Under 30 minutes with your register | 2 to 3 days for six pages of pivots | Already there, with that CRM |
| Real-time collaboration | Yes, native sharing | Only via OneDrive co-authoring | Per paid seat |
| Mobile access | Yes, free Sheets app | Limited | Yes |
| Customizable metrics | Yes, every pivot and card | Yes, if you build them | No, fixed report set |
| Revenue per square foot | Yes, calculated per project | Build it yourself | Rarely included |
| Combines projects across systems | Yes – reads a data sheet, not an API | Yes | No |
| Share with an investor or lender | Yes, view-only link | Send a file | Usually needs a seat |
| Year-1 cost, 5-person sales team | Under 10 | 0 plus several days | 3,000 and up |
Who Should Use This Template
It fits developers running two or more projects who want them compared on identical measures; sales heads tracking agent performance and booking-type mix; project finance managers who need rate per sq ft and payment terms in one place; investors and lenders who want a monthly portfolio pack; and consultants producing sales reports for developer clients.Real Estate Development Dashboard in Google Sheets
It is not a CRM – it reports on closed deals rather than chasing leads, site visits and follow-ups. It does not hold a unit master, so it cannot tell you what is still unsold. And for a single project with a handful of units, it is more machinery than the question needs.
Real-World Use Cases
Real Estate Development Dashboard in Google Sheets
Ranking projects properly. One developer’s flagship led the revenue table at roughly 17% of the portfolio, but Revenue vs Area Sold showed a second project moving similar value on considerably less area. The next phase was priced from rate per square foot rather than from headline sales value.Real Estate Development Dashboard in Google Sheets
Costing a pre-launch discount. Pre-launch offers carried about 12.7% of revenue against new bookings at 29.5%. Placing the two side by side, with average deal value against each, turned an instinct-led discount policy into a numbers conversation.Real Estate Development Dashboard in Google Sheets
Reviewing a ten-agent team. Revenue by Sales Agent spread from roughly 11 million to nearly 18 million. Filtering the same page by buyer segment showed the leader’s advantage concentrated in one segment – which turned a bonus discussion into a training plan.
Advantages of the Real Estate Development Dashboard
- Fast by architecture. Native pivots rather than thousands of array formulas keeps a 1,000-row register instant.
- Rate per square foot as a first-class measure. Most developer reporting stops at total value; the per-area view is where pricing decisions actually get made.
- System-independent. Because it reads a data sheet, projects tracked in different CRMs or spreadsheets can sit in one view.
- Shareable without licences. A view-only link for an investor or lender costs nothing per person.
- Fully editable. Every pivot, card and chart is an ordinary Google Sheets object you can change.
Opportunities for Improvement
Real Estate Development Dashboard in Google Sheets
Stated plainly: there is no live CRM connection, so refreshing means exporting and pasting. The row capacity is 1,000 out of the box – beyond that you open the Apps Script file, raise DATA_ROWS and re-run main(). There is no unit inventory, so unsold stock is invisible; the dashboard reports what has been transacted. Cost and margin are not modelled, so revenue per sq ft is a top-line rate rather than a profit figure. And there is no year-on-year page, so seasonality has to be read from the 12-month trend.Real Estate Development Dashboard in Google Sheets
Best Practices
- Read the Instructions page before importing. Two minutes there prevents the usual misreading of the KPI cards.
- Keep the column headers exactly as they are when pasting your register – pivots, slicers and charts are bound to them.
- Record area on every row, without exception. A blank area column quietly breaks the one measure that makes this dashboard worth having.
- Sanity-check the Overview page after each import. If revenue, deal count and area sold look right, the rest almost always is.
- Filter one variable at a time. Four slicers per page make it easy to end up with an empty chart and no idea which filter caused it.
- Refresh monthly and keep the history. The 12-month sparklines only earn their place if the file holds a full year.
Explore Relevant Templates
- Real Estate Development Dashboard in Google Sheets – the template covered in this article.
- Tenant and Property Management Dashboard in Google Sheets – the rental side of a portfolio.
- Real Estate Crowdfunding Dashboard in Power BI – investor-side analysis with drillthrough.
- Property Enquiry Data Entry System in Excel – captures enquiries before they become deals.
- Rent Collection Data Entry System in Excel – post-handover cash collection.
Want to build skills like this step by step? The Excel Pivot Tables & Dashboards course on NextGenTemplates Academy walks you through it with practice files.
Get the Real Estate Development Dashboard in Google Sheets
Frequently Asked Questions
Real Estate Development Dashboard in Google Sheets
Do I need a paid Google account?
No. A free personal Google account is enough. The download is a PDF with a Make a copy link that puts an editable copy in your own Drive.
Does it connect to my CRM?
No. You export deals and paste them onto the Data sheet, which is what lets it work with any CRM or none – and lets you combine projects tracked in different systems.
How many deals can it hold?
1,000 rows are pre-wired. Beyond that, open the Apps Script file, raise DATA_ROWS and re-run main().
Does it track unsold inventory?
No. It reports on transacted deals and holds no unit master, so availability is a CRM or inventory job.
Why don’t the KPI cards change when I click a slicer?
By design – they use SUMIFS and COUNTIFS on the Data sheet and always show unfiltered totals as a reference. The charts, pivots and Top 5 panels do respond.
Can I add my own projects and property types?
Yes. They are values in your data, not hard-coded lists. Google’s guide to slicers and pivot table filters covers the mechanics if you want to add more.
Can an investor view it without edit rights?
Yes, through the normal Share button with view or comment access.
About the Author
Real Estate Development Dashboard in Google Sheets
Built by PK – Microsoft Certified Professional with 15+ years of Excel, Google Sheets, and Power BI experience. Founder of NextGenTemplates, reaching 300K+ subscribers across YouTube channels. Every template is hand-built and tested before release.
Conclusion
Developer reporting usually stops at booked value by project, which flatters whichever project sells the largest units. The decisions – phase pricing, discount policy, agent incentives, financing exposure – sit one level down, in rate per square foot, booking-type mix and buyer segment. Six pages of pivots on a register you control is a reasonable way to get there. Export last year, paste it in, and open the Projects page first.
Get the template here: Real Estate Development Dashboard in Google Sheets. For walkthroughs of this and other Google Sheets builds, subscribe to youtube.com/@NeoTechNavigators.