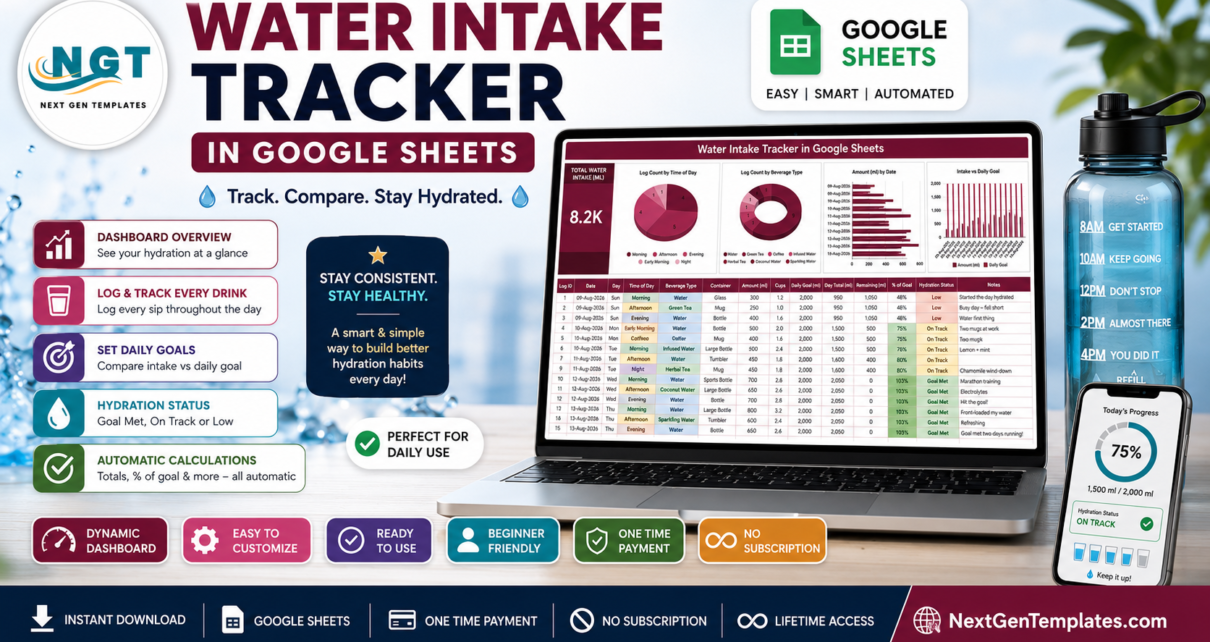
Most people who decide to drink more water manage it for about four days. The problem is not willpower, it is that nothing gets written down – so by Thursday there is no way to tell a good day from a bad one. The Water Intake Tracker in Google Sheets fixes the record-keeping half of that problem. You log each drink, and the sheet does the arithmetic: 14 columns, 7 beverage types, 6 container sizes, 5 times of day, and seven columns that calculate themselves. One page, four charts, one KPI card, and a log that lives in your own Google Drive rather than on somebody else’s server.
A note before anything else: this template is a logging and charting tool. It is not medical advice, and it deliberately does not tell you how much to drink – you type your own Daily Goal and the sheet measures against that.
Get the Water Intake Tracker in Google Sheets
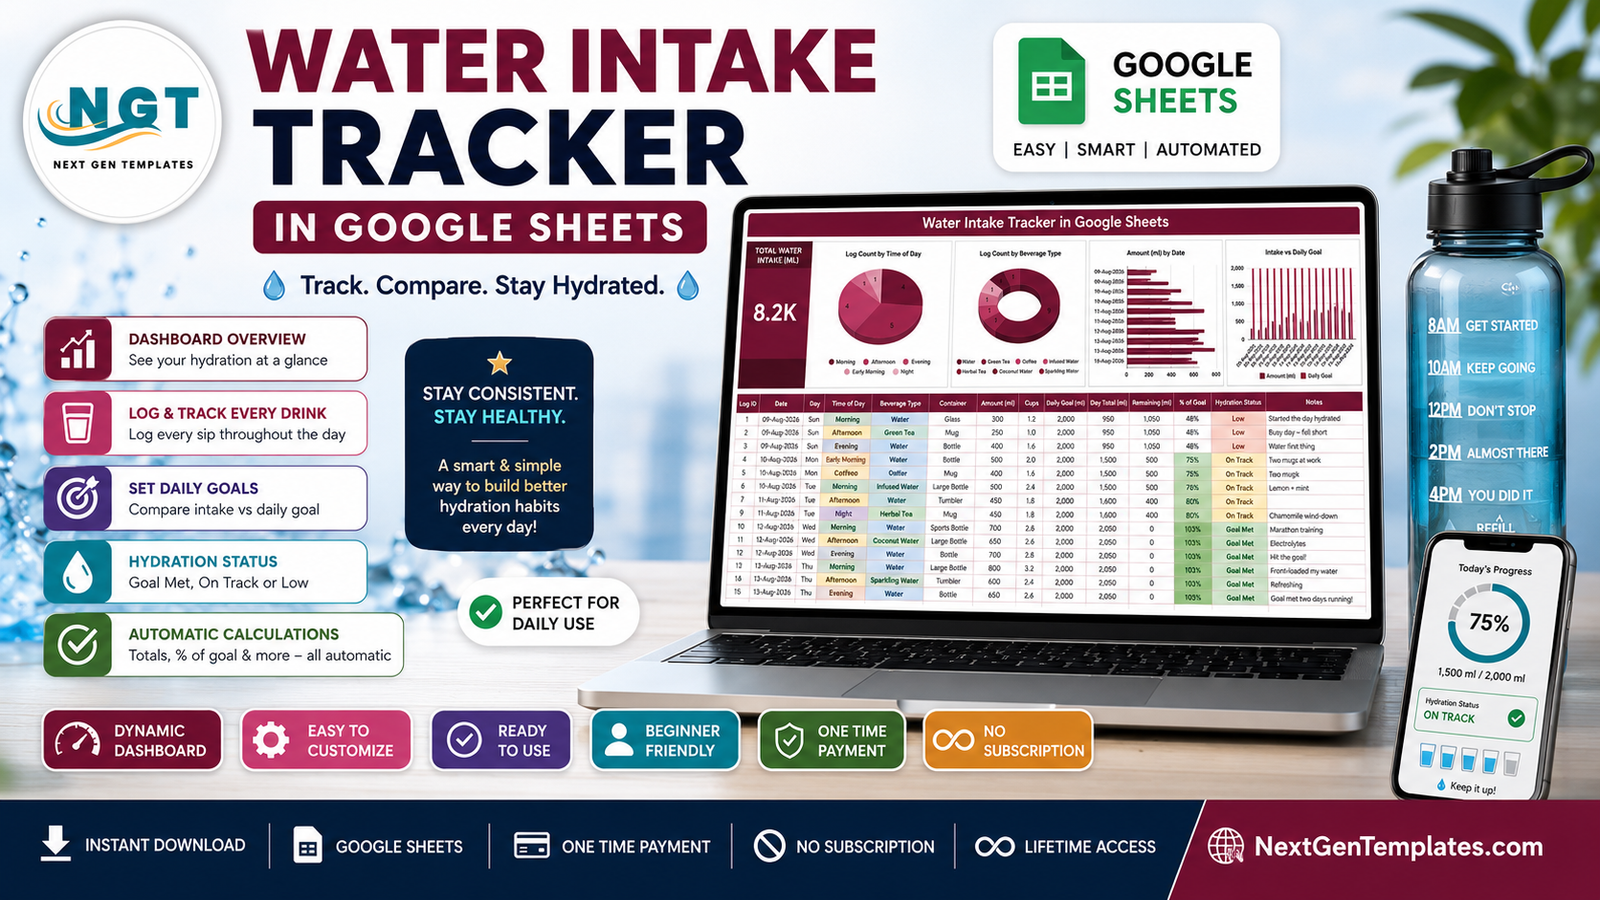
Key Features of the Water Intake Tracker in Google Sheets
- Single-page design. The KPI card, all four charts and the log table live on one sheet. There is no support tab, no hidden helper range, and nothing to break when you insert a row.
- Total Water Intake (ML) card. One large figure summing every drink logged across every date in the file.
- Log Count by Time of Day. A pie chart splitting your entries across Early Morning, Morning, Afternoon, Evening and Night.
- Log Count by Beverage Type. A donut chart separating plain Water from Green Tea, Coffee, Infused Water, Herbal Tea, Coconut Water and Sparkling Water.
- Amount (ml) by Date. A horizontal bar chart, one bar per logged entry, grouped by date.
- Intake vs Daily Goal. A column chart placing what you actually logged next to the goal you set, day after day.
- Seven automatic columns. Log ID, Day, Cups, Day Total (ml), Remaining (ml), % of Goal and Hydration Status are formulas.
- Colour-coded Hydration Status. Goal Met turns green, On Track amber, Low red – driven by % of Goal, not by anybody’s opinion.
- Auto-expanding dropdowns. Time of Day, Beverage Type and Container read the List tab (rows 2 to 500). Add a value there and it appears in the dropdown immediately.
- Charts already reach row 1000. Every chart reads the data columns directly using the built-in Aggregate option, so new entries show up without touching a chart range.
Tracker Pages Explained
Three visible tabs, plus a List tab feeding the dropdowns.
Page 1 – Water Intake Tracker
This is where you spend all of your time. The Total Water Intake (ML) card anchors the left edge, the four charts run across the top of the sheet, and the log table fills everything below with one row per drink.
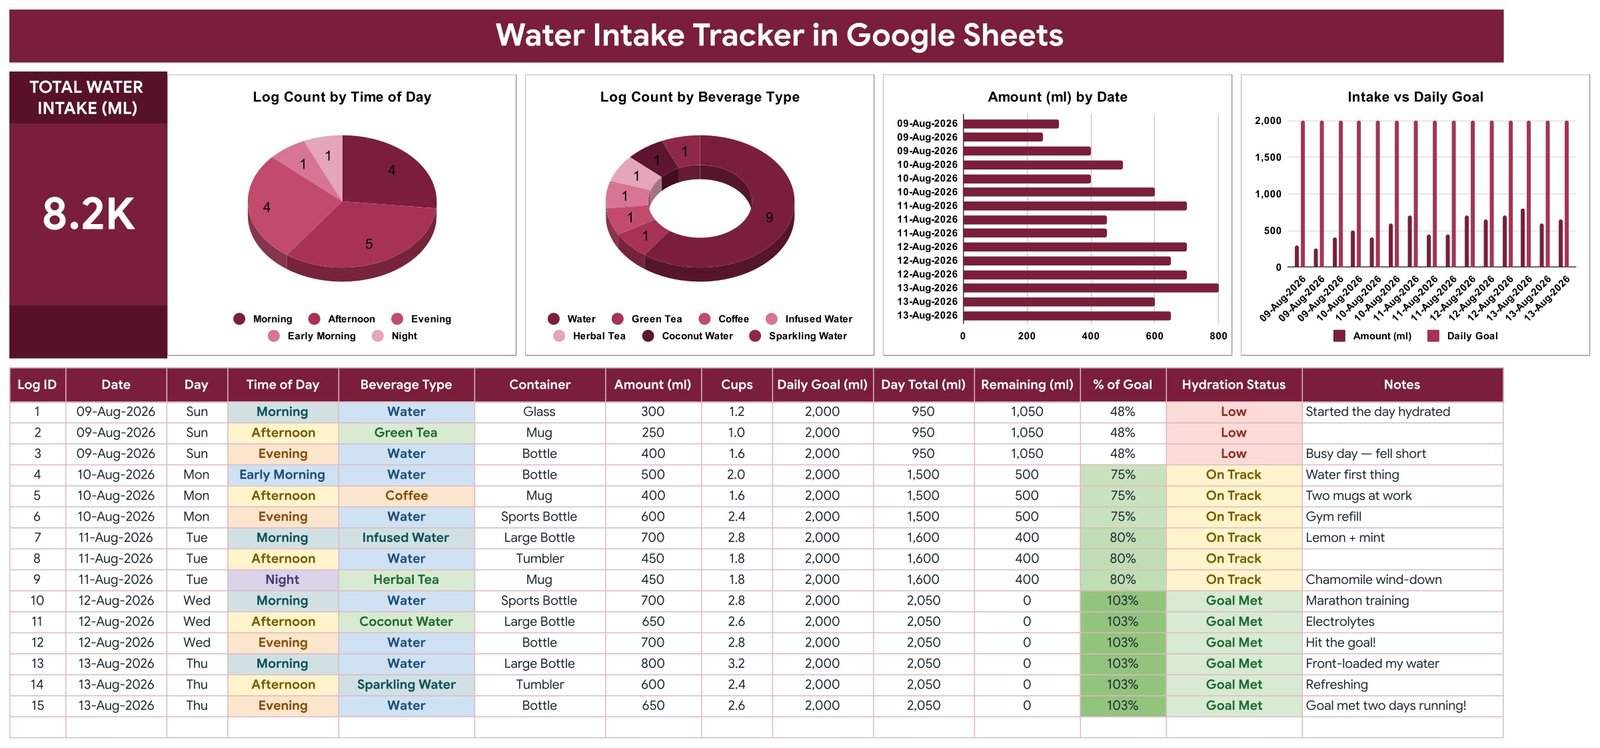
The columns, left to right: Log ID, Date, Day, Time of Day, Beverage Type, Container, Amount (ml), Cups, Daily Goal (ml), Day Total (ml), Remaining (ml), % of Goal, Hydration Status and Notes.
Two of those deserve a closer look. Day Total (ml) adds up every row that shares the same Date, which is what makes multi-entry days work – three drinks on a Tuesday become one Tuesday figure, and the same figure repeats on all three rows so any of them can be read on its own. Cups divides Amount by 250, giving you a second unit without a second column of typing. Notes is free text, and the sample rows show what it is for: Gym refill, Lemon + mint, Front-loaded my water. Those short annotations are usually what explains a bad week later.
Page 2 – How to Use
The setup guide lives inside the file rather than in a separate document you will lose. It covers which rows carry the sample data, which columns are formulas you should not overwrite, how the Daily Goal column behaves, how to extend the dropdown lists, and where the colour palette is defined.
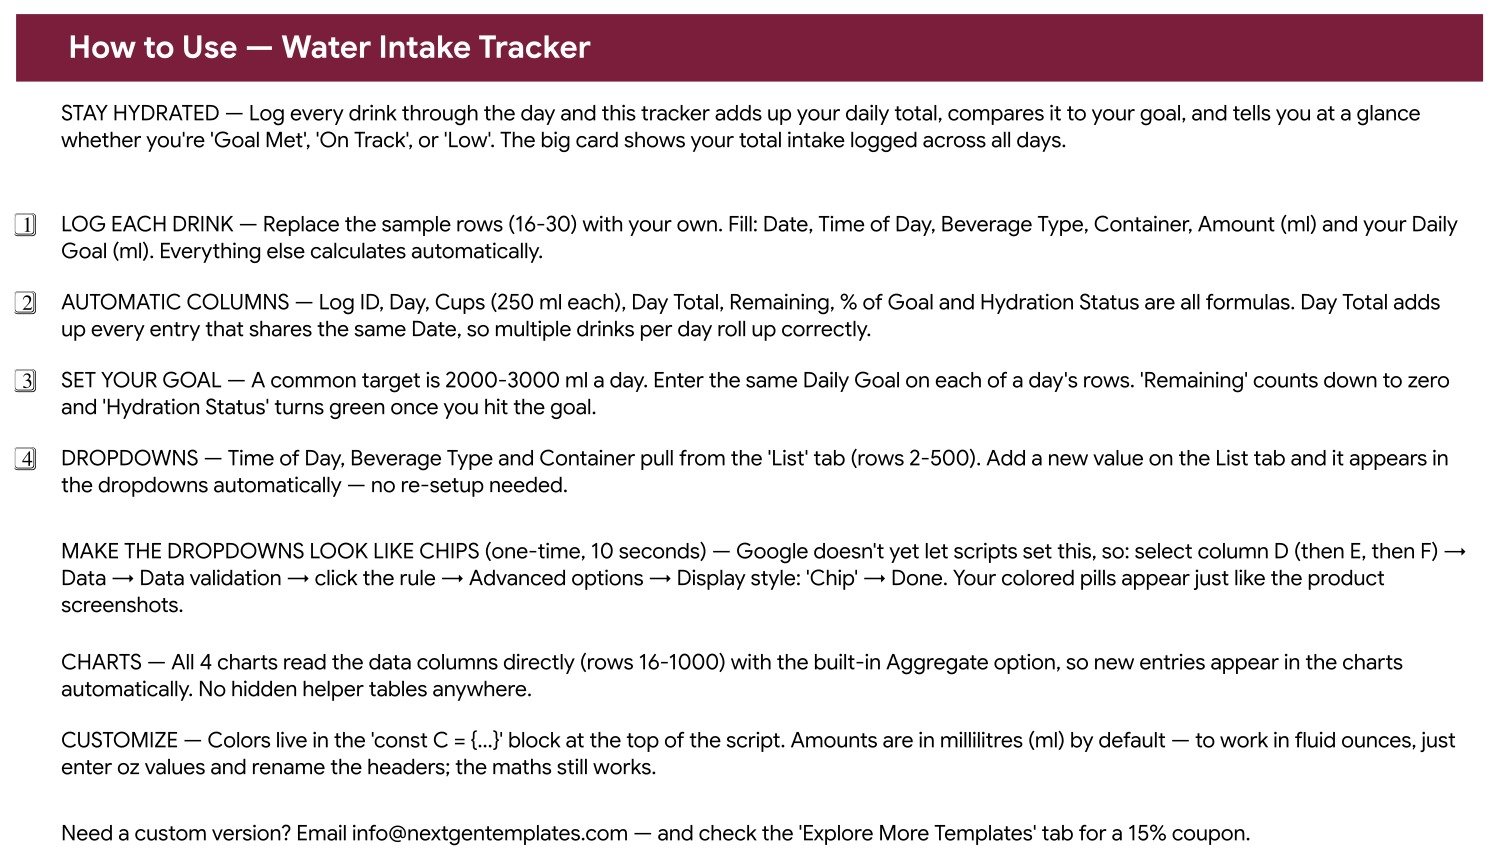
It is also honest about the one thing a script cannot do. Google Sheets does not currently let Apps Script set a data-validation rule’s display style, so the coloured pills you see in the screenshots need a ten-second manual step: select the column, open Data, then Data validation, click the rule, open Advanced options and switch Display style to Chip. You can read Google’s own reference on data validation in Google Sheets if you want the background. Do it once for columns D, E and F and the tracker looks exactly like the images.
Page 3 – Explore More Templates
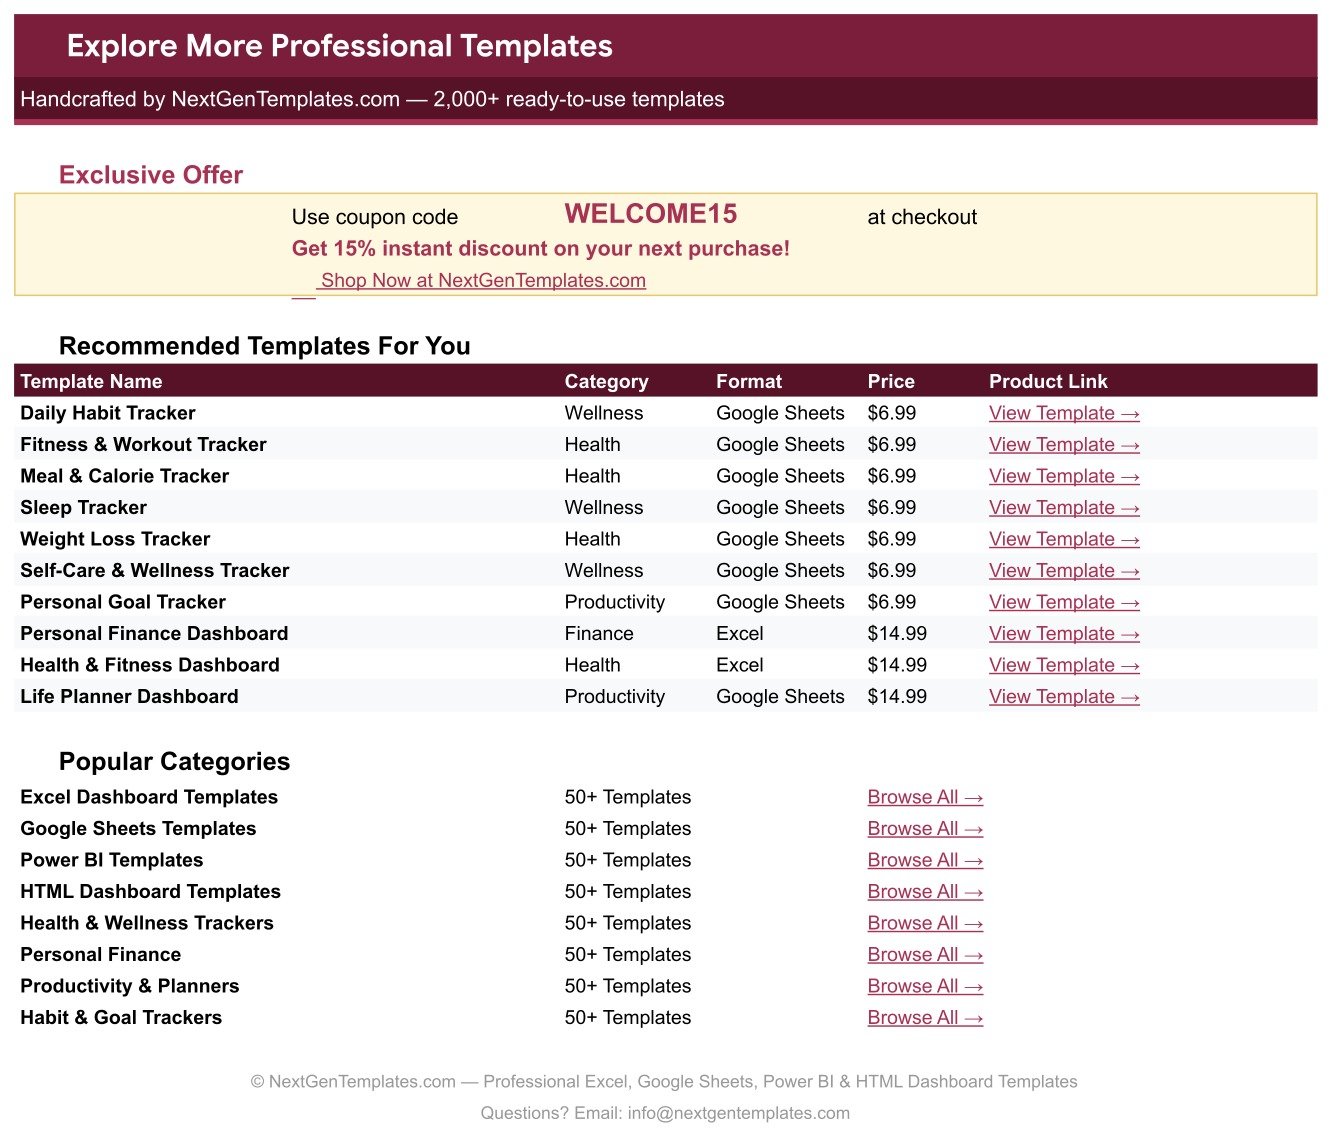
A short in-file index of related NextGenTemplates trackers and dashboards, with a WELCOME15 coupon code. It is a catalogue page, not part of the tracking machinery, and you can delete the tab without affecting anything.
Google Sheets vs. Excel vs. a Paid Hydration App – Feature Comparison
| This Google Sheets tracker | Excel hydration spreadsheet | Paid hydration app | |
|---|---|---|---|
| Cost | $6.99 one time | $7-$15 one time, plus Microsoft 365 if you do not own Excel | $3-$10 per month, per person |
| Platform | Google Sheets, any browser | Microsoft Excel, desktop first | The vendor’s iOS or Android app |
| Setup time | Under 5 minutes – open the PDF, click the copy link | Download, open, enable editing | Install, create an account, accept terms |
| Real-time collaboration | Yes, native Google Sheets sharing | Only through OneDrive co-authoring | Usually single-user unless you buy a family plan |
| Mobile access | Yes, free Google Sheets app | Excel mobile, with limited chart editing | Yes – that is the whole product |
| Customizable fields | Yes – add beverage types and containers on the List tab | Yes, if you rebuild the formulas | Rarely – you use the vendor’s fields |
| Share with a link | Yes | Needs a cloud upload first | Export only |
| Year-1 cost at 5 users | $6.99 total | $7-$15 plus licences | $180-$600 |
| Beverage-type breakdown | Built in – donut chart and a Beverage Type column | Build it yourself | Often behind a premium tier |
| Where the log lives | Your own Google Drive | Your own disk | The vendor’s servers |
Who Should Use This Template
It suits anyone who wants a written record rather than a notification. Apps nudge and then forget; a spreadsheet keeps the history. It suits people who already work in Google Sheets, because there is nothing new to learn. It suits anyone whose intake is not just water – the Beverage Type column and its donut chart exist precisely so tea, coffee and coconut water are visible rather than lumped into one number. And it suits people who are training and want intake sitting beside the rest of their numbers.
It is not for you if you want automatic logging from a smart bottle or a wearable. There are no integrations here and every row is typed. It is also the wrong tool for a clinical fluid-balance chart, which needs intake and output side by side – this template records intake only. And if you want food, weight and water in one file, you will get a cleaner result from three focused trackers than from one overloaded sheet.
Real-World Use Cases
Marathon training. Priya logs three to five entries a day, mostly Sports Bottle and Large Bottle, and marks long-run days in Notes. The Amount (ml) by Date chart tells her which training days ran short. What actually changed her routine was Log Count by Time of Day: it showed almost nothing logged before noon.
Desk work. Daniel’s first week produced a donut chart dominated by Coffee. He did not delete the coffee rows – he added Infused Water and Sparkling Water alongside them, and the beverage split became the point of the sheet rather than the total.
A shared household. The Okafors keep one copy with four date ranges. Because it is a Google Sheet, all four of them edit from their phones simultaneously – which a single-seat app licence would not allow, and a family plan would charge for.
Advantages of the Water Intake Tracker in Google Sheets
- Six fields per entry. Date, Time of Day, Beverage Type, Container, Amount and Daily Goal. Seven more columns fill themselves in.
- No subscription and no account. One payment, one file, and the data never leaves your Drive.
- Charts that keep up. All four read rows 16 to 1000 with the Aggregate option, so they extend as you do.
- Units are yours. Millilitres by default; enter fluid ounces and rename the headers instead, and only the Cups divisor needs adjusting.
- Extensible lists. A new beverage or container on the List tab appears in the dropdowns straight away.
- Honest status labels. Goal Met, On Track and Low come from % of Goal against the target you set – the sheet has no opinion of its own.
Opportunities for Improvement
Two things are worth knowing before you buy. First, the chip display style is a manual step. Google does not expose it to Apps Script, so a fresh copy shows plain dropdowns until you switch the display style yourself. It takes ten seconds per column and the How to Use page walks you through it, but it is a step, and pretending otherwise would be dishonest.
Second, Daily Goal is entered per row rather than once per day. That is what makes the goal changeable over time, but it does mean retyping the same figure on each of a day’s rows. Copying the cell down handles it, and a filled-down column is a small price for being able to change your target mid-month without breaking earlier days.
Beyond those: no integrations, no reminders, and no output column. If any of those three are essential, this is the wrong tool and it is better to say so now.
Best Practices
- Log at the moment, not at bedtime. The Google Sheets mobile app exists for this. Retrospective logging is where the habit usually dies.
- Set the goal before the first entry. Remaining and % of Goal are meaningless without it, and a column of blanks is discouraging.
- Fill Daily Goal down. Copy the cell to the rest of the day’s rows the moment you add them.
- Use Notes. Two words explaining a low day is worth more in a month than the number itself.
- Extend the List tab early. Add the drinks you actually consume in the first week so the beverage chart reflects reality.
- Read the pattern, not the day. One red row means nothing. A red Monday every week means something.
- Keep a copy of the untouched file. Duplicate the sheet before you start editing formulas, so you always have a clean version.
Explore Relevant Templates
- Body Measurements Tracker in Google Sheets – the same one-page layout for tape-measure numbers.
- Calorie & Macro Tracker in Google Sheets – food logging with the same dropdown-and-chart approach.
- Weight Loss Tracker in Google Sheets – weigh-ins charted over time.
- Workout Log Tracker in Google Sheets – sets, reps and session volume.
- Gym Membership Tracker in Google Sheets – for running the gym rather than attending it.
- Or browse every Google Sheets tracker in the catalogue.
Get the Water Intake Tracker in Google Sheets
If tracker-building appeals to you, the NextGenTemplates Academy learning paths take you through the spreadsheet skills behind templates like this one, with practice files.
Frequently Asked Questions
Does this template tell me how much water to drink?
No, and that is deliberate. You enter your own Daily Goal and the sheet measures your logged intake against it. The template makes no recommendation and is not medical advice. If you want a target set for you, ask a qualified professional.
Can I work in fluid ounces instead of millilitres?
Yes. Enter oz values and rename the headers. The only hard-coded conversion is the Cups column, which divides by 250, so change that one formula if you switch units.
Do drinks other than water count?
Your call – the template supports either answer. Every row carries a Beverage Type, so you can total everything or filter to plain Water and read that figure instead.
Will new rows appear in the charts automatically?
Yes. All four charts read the data columns from row 16 to row 1000 using the built-in Aggregate option, with no helper tables in between.
How do I add a beverage or container that is not in the list?
Type it on the List tab, anywhere in rows 2 to 500. The dropdowns pick it up immediately – no re-setup.
Can several people share one copy?
Yes. It is an ordinary Google Sheet, so normal sharing applies and several people can edit at once. Give each person their own date range, or make each a copy of their own.
What do I actually receive?
A PDF containing the Make a Copy link. Click it and the full tracker – all three tabs, the List tab, every formula and all four charts – is created in your own Google Drive.
About the Author
Built by PK – Microsoft Certified Professional with 15+ years of Excel, Google Sheets, and Power BI experience. Founder of NextGenTemplates, reaching 300K+ subscribers across YouTube channels. Every template is hand-built and tested before release.
Conclusion
The Water Intake Tracker in Google Sheets is not trying to be clever. It is a well-built log: six fields to type, seven columns that calculate, four charts that read the log directly, and a status label that comes from your own target rather than a default someone else picked. What it gives you that an app usually does not is the history – a month of rows you can sort, filter and read, sitting in a file you own.
You can pick it up for a one-time $6.99 on the Water Intake Tracker in Google Sheets product page. Open the PDF, click the copy link, and you will be logging your first drink inside five minutes.
Reminder: this is a logging and charting template, not medical advice. It does not recommend an intake amount – you set your own goal.