Ask a company secretary how governance reporting actually gets produced and you will usually hear the same story: board composition figures live in one document, internal audit keeps its own tracker, compliance sends a summary a week late, and somebody spends two days a quarter stitching it all into a deck. The numbers are real, but nobody can see them together, and nobody can tell at a glance whether governance performance is improving or slipping.Corporate Governance KPI Dashboard in Google Sheets
A KPI scorecard fixes that particular problem. Not by adding analysis, but by putting every governance measure on one page in the same shape – Actual, Target, Achievement %, Status and Prior Year – for the month and for the year to date. This post walks through exactly such a template: the Corporate Governance KPI Dashboard in Google Sheets, a formula-driven workbook that tracks 14 governance KPIs across seven groups and recalculates the whole scorecard when you change one dropdown.
Before anything else, one thing needs saying plainly. This is a reporting and tracking template. It does not audit, verify or certify anything. It does not make an organisation compliant with any listing rule, corporate-governance code, board-reporting standard or audit requirement, and nothing here is legal, financial, audit or governance advice. Every number in the screenshots below is demonstration data.Corporate Governance KPI Dashboard in Google Sheets
Get the Corporate Governance KPI Dashboard in Google Sheets
What a Governance KPI Scorecard Is – and Is Not
There are two very different templates people call a governance dashboard, and buying the wrong one is a common and avoidable mistake.
An analytical dashboard sits on top of row-level data. You paste in transactions, meetings, findings or cases, and slicers and pivots let you cut it every which way. It answers open-ended questions: which committee has the longest remediation cycle, how findings cluster by business unit, where the outliers are.
A KPI scorecard – which is what this template is – starts from monthly totals you already report. It answers one closed question repeatedly: are we hitting our targets, and are we better or worse than last year? It is deliberately table-shaped, because that is what a board paper looks like.
| KPI Scorecard (this template) | Analytical Dashboard | |
|---|---|---|
| Shape | One row per KPI | Charts, slicers, pivots |
| Driven by | A single month picker | Filters over a dataset |
| You enter | Monthly MTD and YTD totals | Row-level records |
| Core view | Actual vs Target vs Prior Year | Breakdowns and rankings |
| Reads well to | Directors and committees | Analysts |
| Effort per month | Type 14 numbers | Refresh and re-cut the data |
Neither is better. They answer different questions, and a governance office that reports monthly and investigates quarterly usually ends up with both.
The 14 Governance KPIs
The template ships with 14 KPIs grouped into seven governance areas. All of them are editable – the list below is a starting point, not a prescription, and it is not a claim about what any organisation is required to report.
| Group | KPI | Unit | Direction | Sample owner |
|---|---|---|---|---|
| Board Composition | Board Independence | % | Higher is better | Company Secretary |
| Board Composition | Board Gender Diversity | % | Higher is better | Nomination Committee |
| Board Composition | Average Board Tenure | Years | Lower is better | Nomination Committee |
| Board Effectiveness | Board Meeting Attendance | % | Higher is better | Company Secretary |
| Board Effectiveness | Director Training Hours | Hours | Higher is better | Governance Office |
| Audit & Risk | Audit Findings Closed | % | Higher is better | Head of Internal Audit |
| Audit & Risk | Open Audit Findings | Count | Lower is better | Head of Internal Audit |
| Audit & Risk | Time to Close Audit Actions | Days | Lower is better | Risk Manager |
| Audit & Risk | Related-Party Transactions Reviewed | % | Higher is better | Audit Committee |
| Compliance | Policy Compliance Rate | % | Higher is better | Chief Compliance Officer |
| Ethics & Conduct | Code of Conduct Violations | Count | Lower is better | Ethics Officer |
| Ethics & Conduct | Whistleblower Cases Resolved | % | Higher is better | Ethics Officer |
| Disclosure & Transparency | ESG Disclosure Score | Index | Higher is better | Head of Sustainability |
| Shareholder Rights | Shareholder Voting Participation | % | Higher is better | Investor Relations |
The direction column matters more than it looks. Four of these KPIs are lower-is-better: average board tenure, open audit findings, days to close audit actions, and code-of-conduct violations. In a naive scorecard, a falling number looks like a failure. This template tags every KPI as UTB (Upper The Better) or LTB (Lower The Better) and flips the achievement formula accordingly, so cutting your remediation cycle time scores above 100% rather than below it.
Inside the Workbook
The Home page
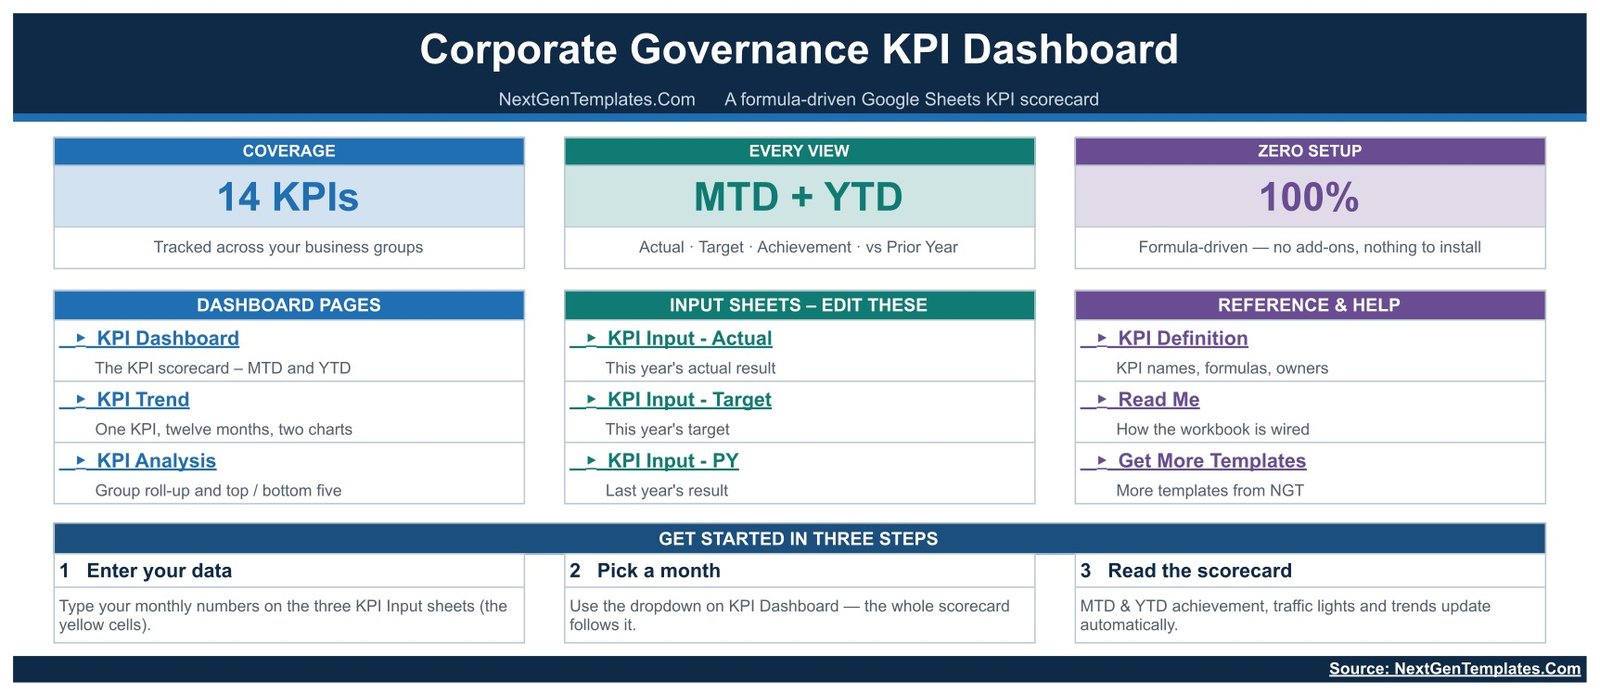
A navigation page rather than a report. It splits the workbook into three columns – Dashboard Pages, Input Sheets (the ones you edit) and Reference & Help – and closes with a three-step Get Started panel: enter your data, pick a month, read the scorecard. It is a small thing that saves a lot of “which tab do I type in?” questions when you hand the file to a colleague.Corporate Governance KPI Dashboard in Google Sheets
KPI Dashboard – the scorecard itself
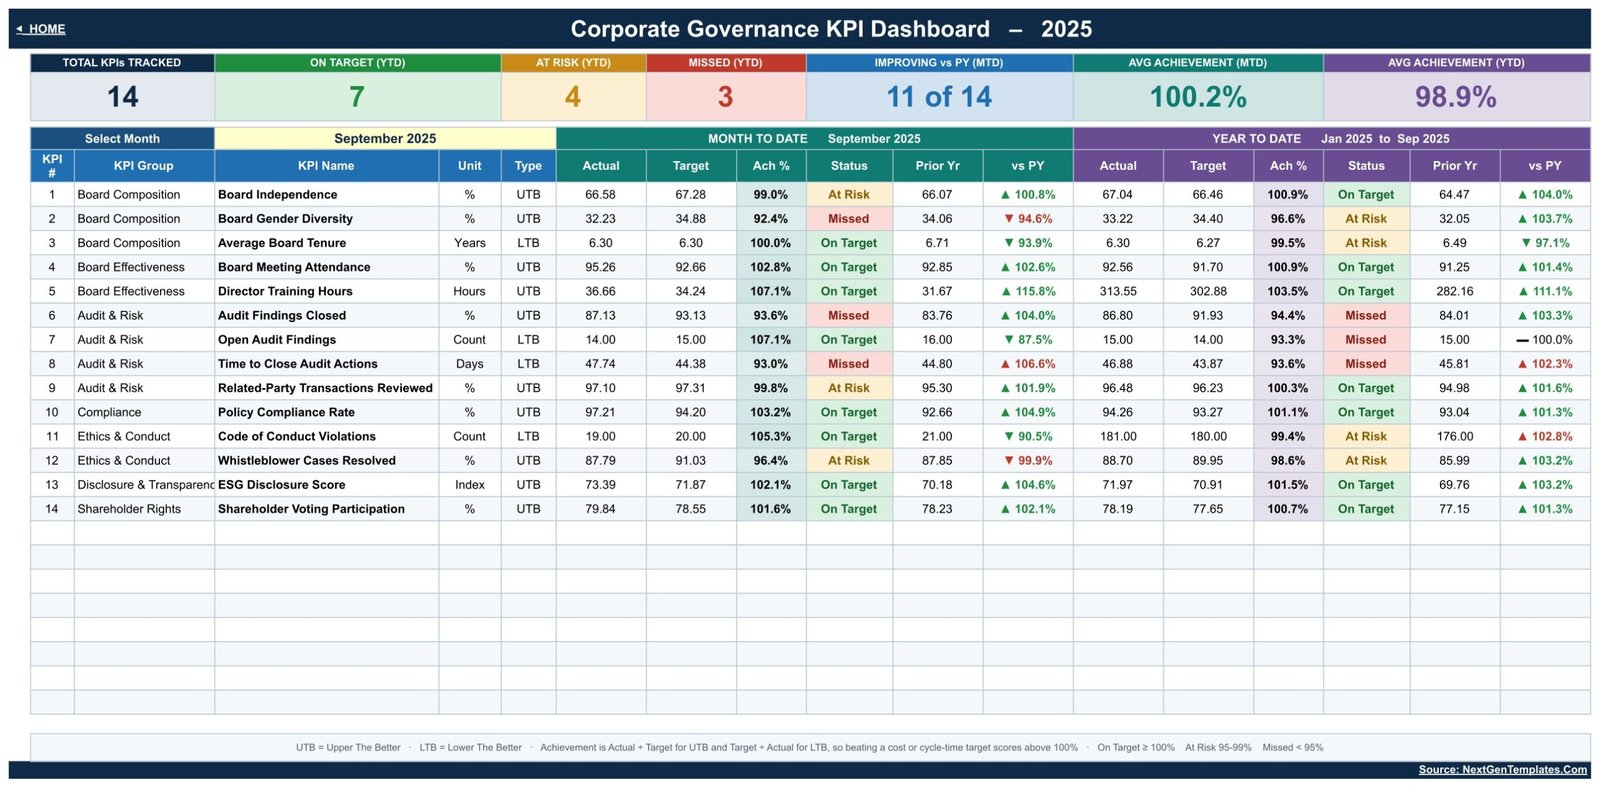
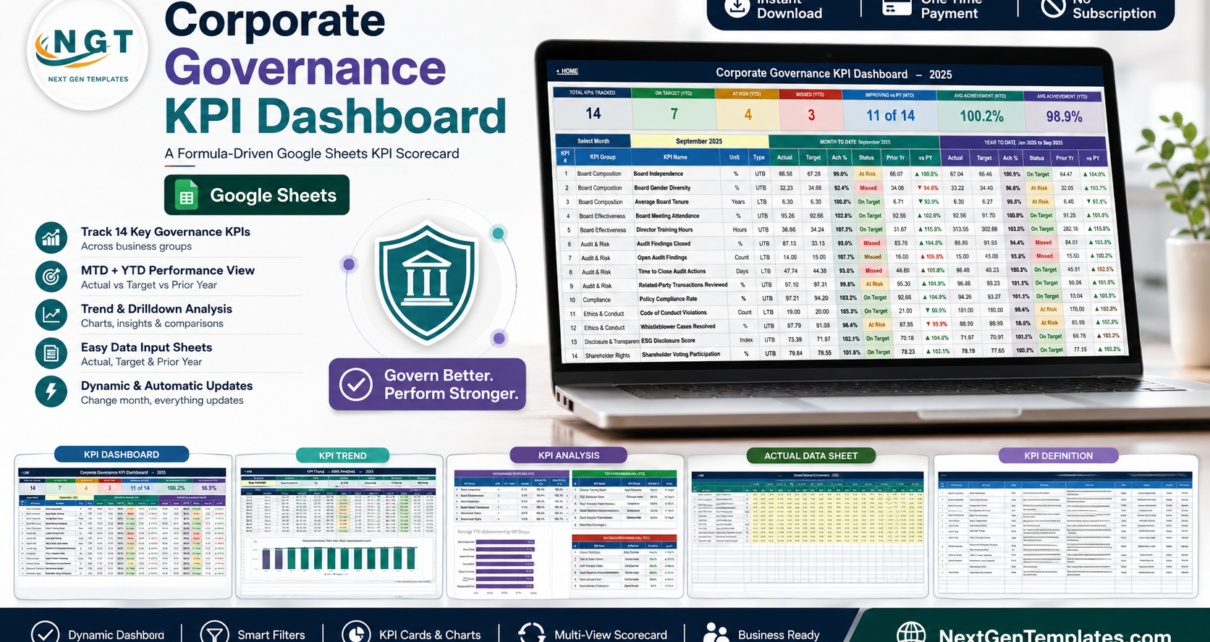
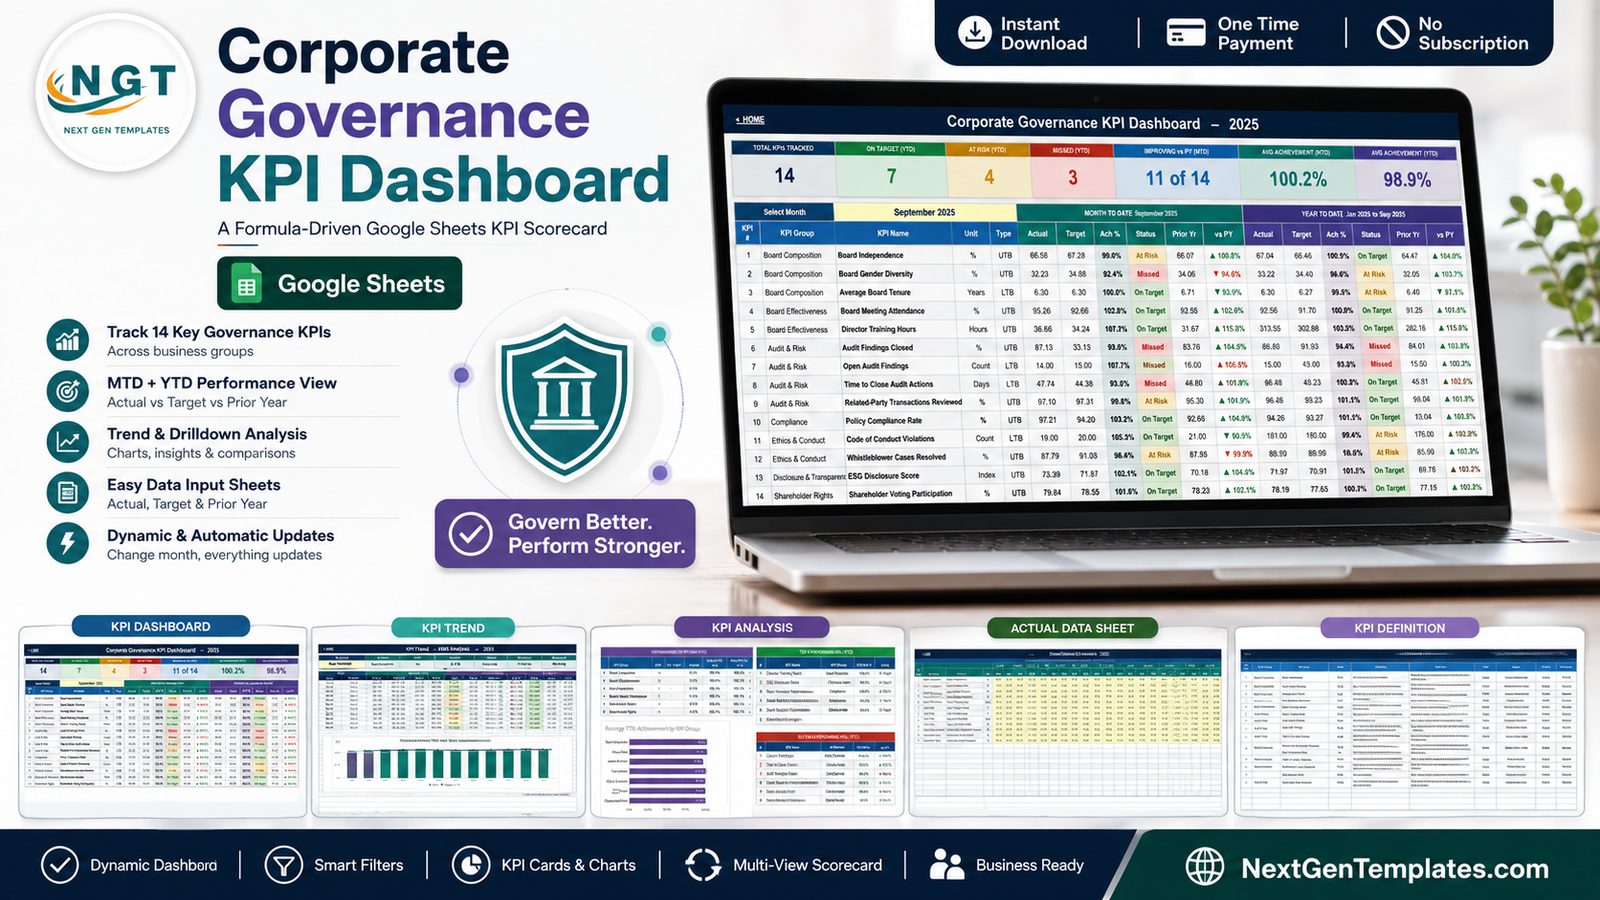
This is the page that goes in the board pack. Seven summary cards run across the top – Total KPIs Tracked, On Target (YTD), At Risk (YTD), Missed (YTD), Improving vs PY (MTD), Avg Achievement (MTD) and Avg Achievement (YTD). In the demonstration data for September 2025 they read 14 KPIs, 7 On Target, 4 At Risk, 3 Missed, 11 of 14 improving against prior year, and 100.2% average achievement MTD against 98.9% YTD.Corporate Governance KPI Dashboard in Google Sheets
Below them, one row per KPI, split into a Month To Date block and a Year To Date block. Each block carries Actual, Target, Ach %, Status, Prior Yr and a vs PY figure with an up, down or flat arrow. The status column is colour coded: On Target from 100%, At Risk between 95% and 99%, Missed below 95%. Those thresholds are ordinary formulas on the sheet, so if your governance committee works to a different tolerance you change them once.Corporate Governance KPI Dashboard in Google Sheets
The genuinely useful part is the MTD/YTD split sitting side by side. In the sample data Board Gender Diversity is Missed for the month at 92.4% but only At Risk for the year at 96.6% – a bad month inside a mediocre year. Open Audit Findings is the reverse: On Target for the month at 107.1%, Missed for the year at 93.3%. A single-period scorecard hides both of those stories.Corporate Governance KPI Dashboard in Google Sheets
KPI Trend – one KPI over twelve months
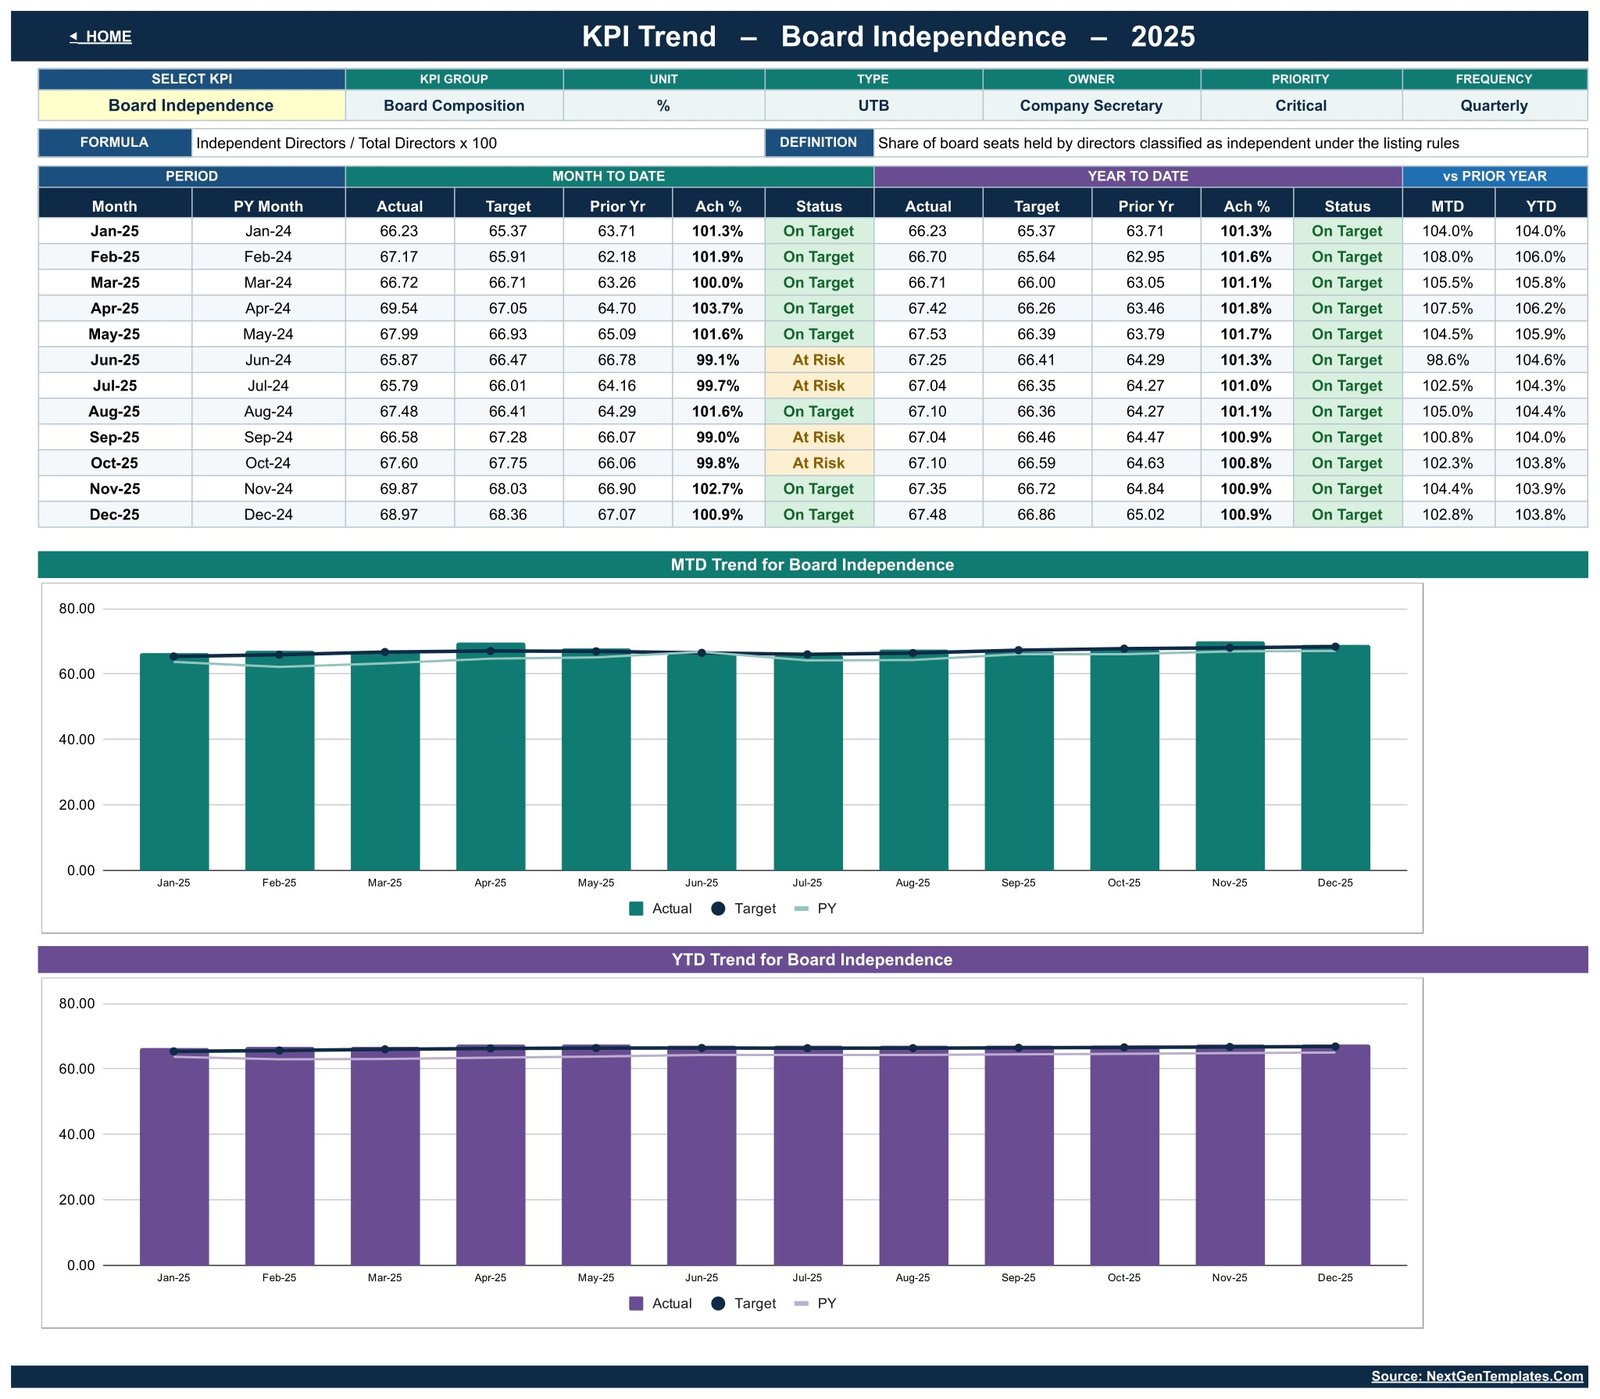
When a status turns amber, this is where you go. Pick any KPI from the dropdown and the entire page rebuilds around it. A header strip restates its group, unit, type, owner, priority, frequency, formula and definition – so the reader does not have to remember that Board Independence means independent directors divided by total directors.Corporate Governance KPI Dashboard in Google Sheets
Underneath, twelve rows give Actual, Target, Prior Yr, Ach % and Status for both MTD and YTD, plus vs Prior Year columns for each. Two charts finish the page: MTD Trend for Board Independence and YTD Trend for Board Independence in the screenshot, each plotting Actual as bars against Target and Prior Year lines. The chart titles follow the selected KPI, so they are never stale.
KPI Analysis – groups, leaders and laggards
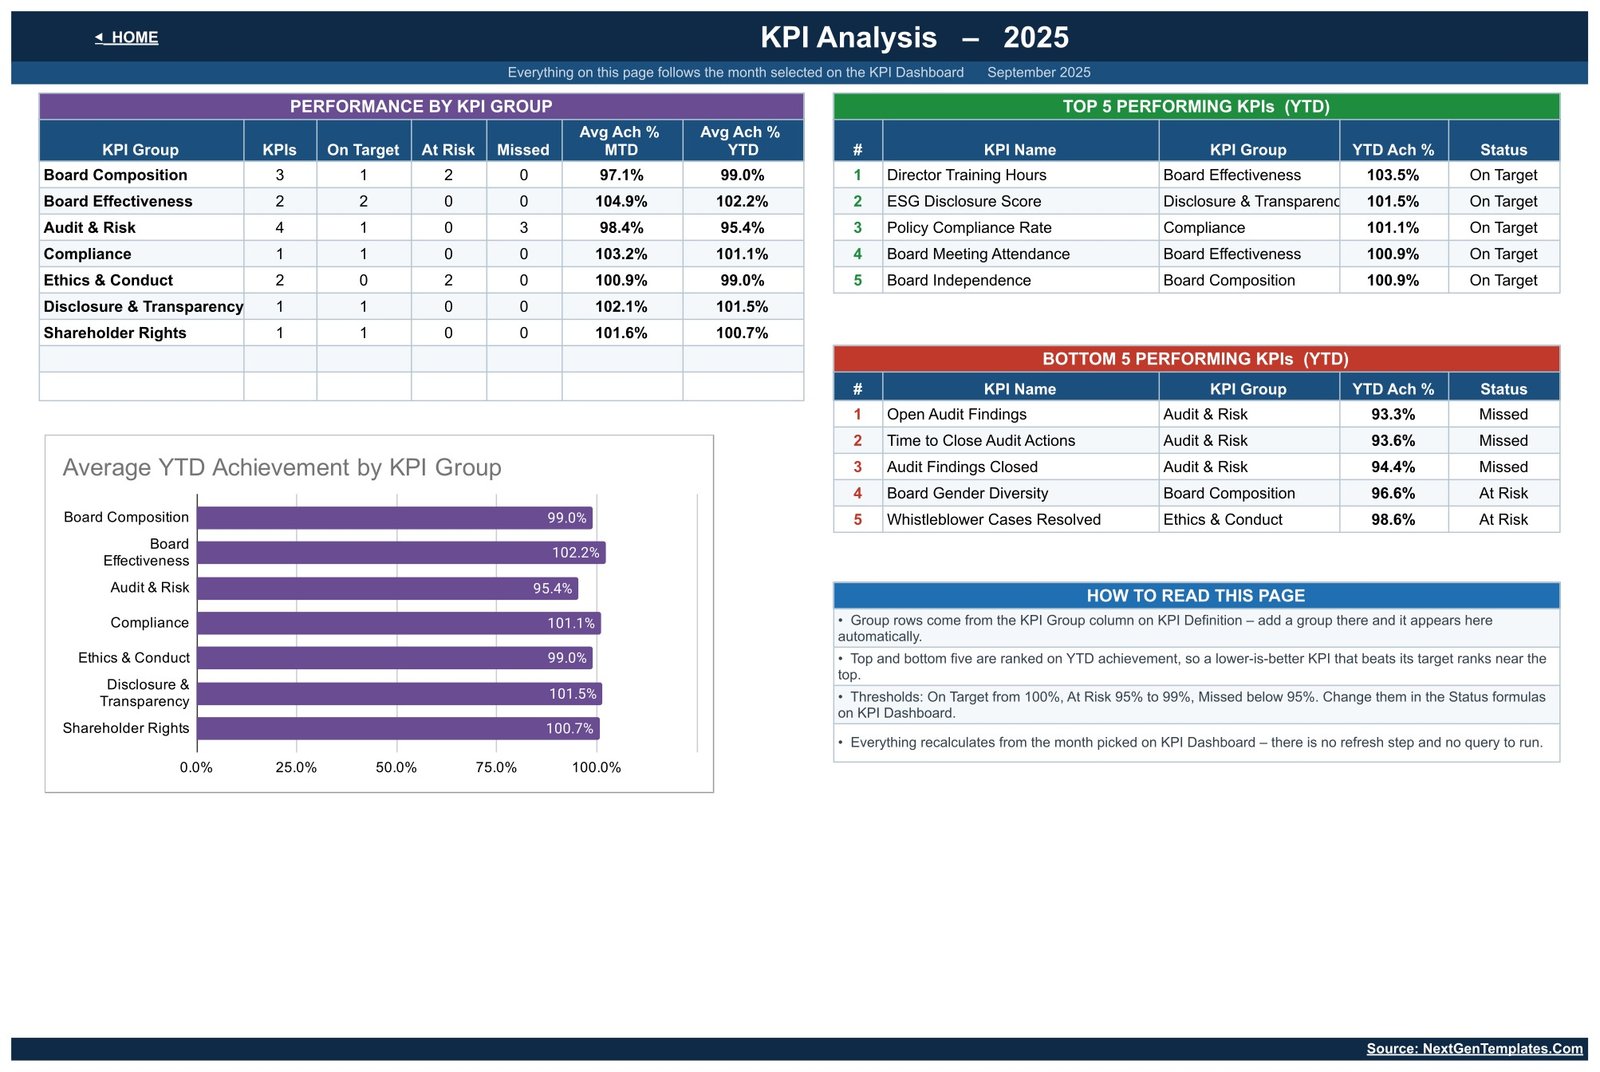
The roll-up page. A Performance by KPI Group table counts how many KPIs each group holds and how many are On Target, At Risk or Missed, with average MTD and YTD achievement per group. An Average YTD Achievement by KPI Group bar chart plots the same thing for anyone who prefers a picture.Corporate Governance KPI Dashboard in Google Sheets
Beside it, Top 5 and Bottom 5 Performing KPIs (YTD) name names. In the sample data the bottom five is dominated by Audit & Risk – Open Audit Findings, Time to Close Audit Actions and Audit Findings Closed all sit there – which is exactly the sort of pattern a group-level average would smooth away. A How to Read This Page panel in the corner explains the ranking and the thresholds in plain language, which matters when the file gets forwarded to someone who did not build it.Corporate Governance KPI Dashboard in Google Sheets
The three input sheets
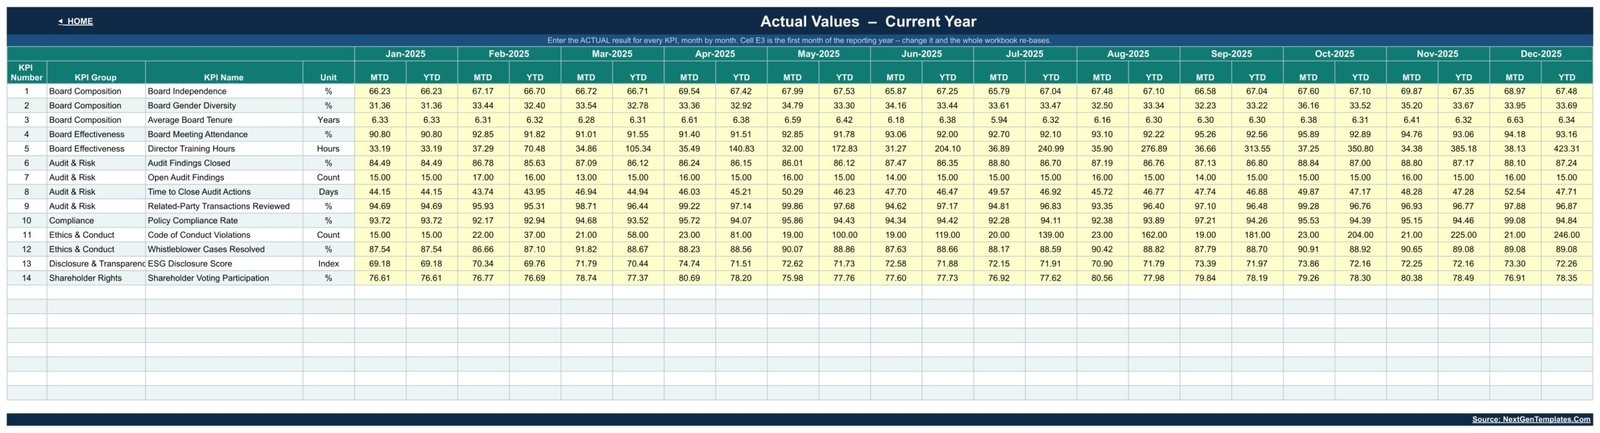
Three identically shaped grids: this year’s Actual, this year’s Target, and last year’s result. Each is 14 rows by twelve months, with an MTD and a YTD column per month. Only these cells are yellow, and only these cells are meant to be typed in – everything else in the workbook is formula.
One cell on the Actual sheet sets the first month of your reporting year. Change it and the whole workbook re-bases, which is what you want if your financial year starts in April or July rather than January.
KPI Definition – the control sheet
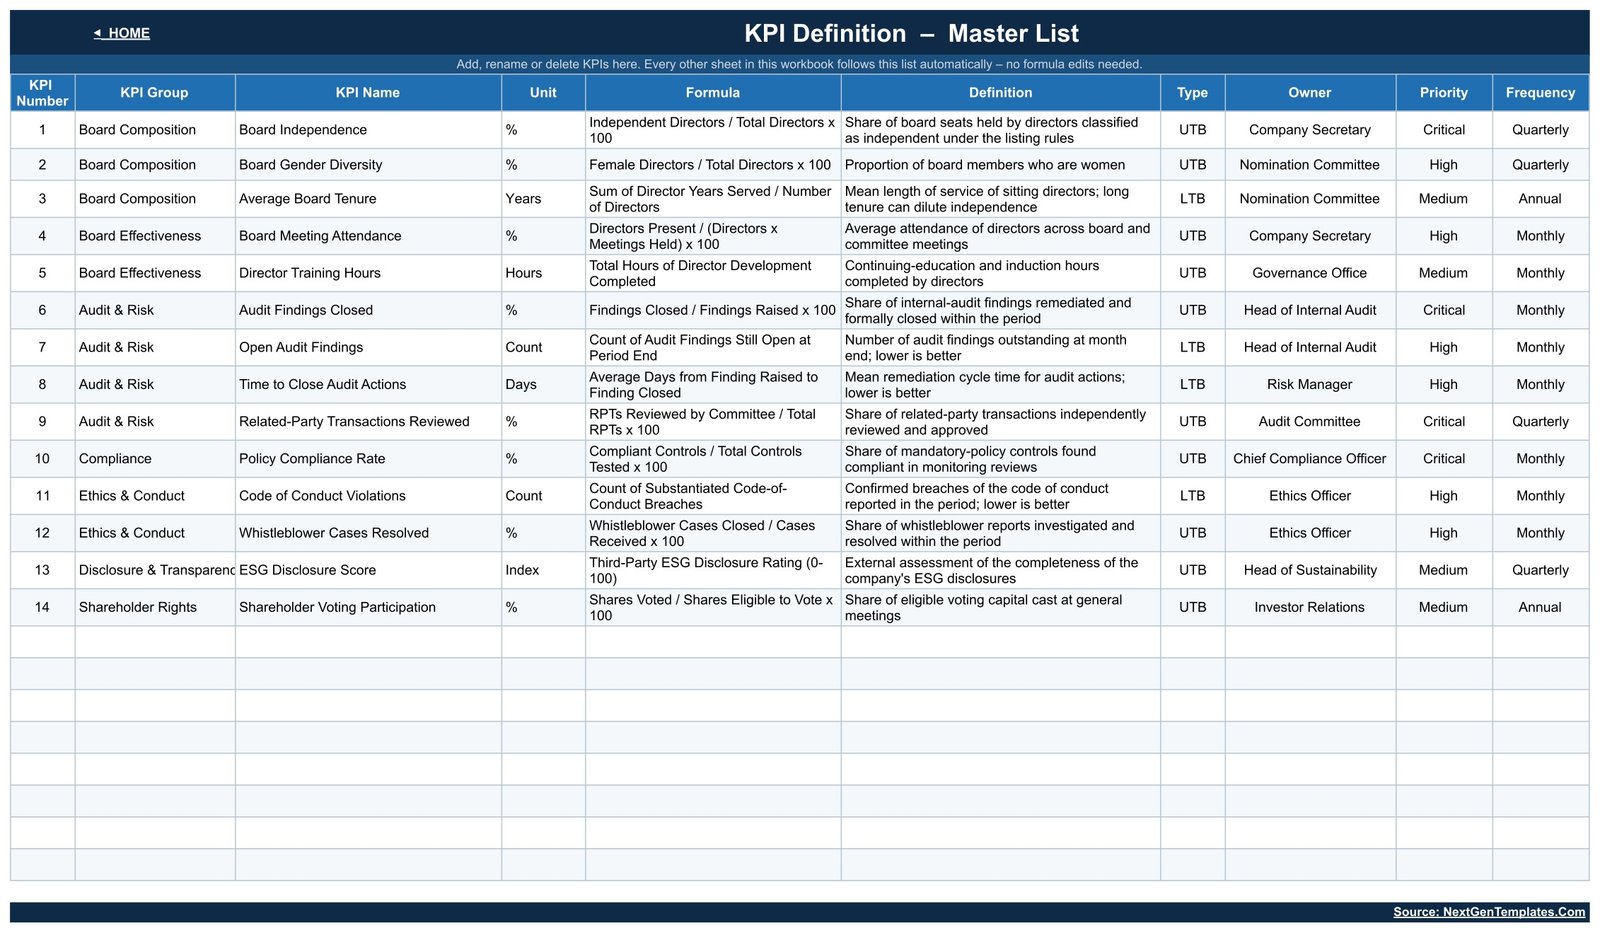
This is the sheet that makes the template reusable rather than fixed. Every KPI’s group, name, unit, formula, definition, type, owner, priority and reporting frequency lives here in one row. Add a KPI, rename one, or delete the ones you do not report, and the scorecard, the Trend page, the Analysis page and the input sheets all follow automatically. No formula editing anywhere else.
Worth noting: the Owner, Priority and Frequency columns are plain editable text. “Critical” and “Quarterly” in the sample are placeholders describing how that example organisation chose to report, not a standard anyone must follow.Corporate Governance KPI Dashboard in Google Sheets
Setting It Up
- Get your own copy. The download is a PDF containing a Make a Copy link. Click it and the workbook lands in your own Google Drive.
- Rewrite the KPI Definition sheet. Do this before anything else. Your KPI names, your groups, your formulas, your owners. Mark each one UTB or LTB.
- Set the reporting-year start in cell E3 on the KPI Input – Actual sheet.
- Enter last year first. Fill the PY sheet before the current year, otherwise every vs PY column reads as a false improvement.
- Set your targets on the Target sheet – MTD and YTD, month by month.
- Add this month’s actuals and pick the month on the KPI Dashboard. That is the whole monthly routine once it is running.
- Tune the thresholds in the Status formulas if 100 / 95 is not the right tolerance for your committee.
- Share read-only with the committee, or use File > Download > PDF for the board pack.
Practical Notes From Using a Scorecard Like This
Fewer KPIs beat more. Fourteen is already close to the limit of what a board will read carefully. If you add ten more, the summary cards stop meaning anything.
Get the direction right before the numbers. The single most common error in a governance scorecard is treating a count of open findings as higher-is-better because that is the default. Set UTB/LTB per KPI on the definition sheet on day one.
Targets need an owner and a date. A target that nobody agreed to becomes a number people argue about in the meeting instead of a number that drives action. The Owner column exists for exactly this.
Do not confuse the score with the substance. 103% on Policy Compliance Rate says your monitoring found more compliant controls than you targeted. It does not say your controls work, that the sample was representative, or that you are compliant with anything. The scorecard tracks what you measure; it cannot tell you whether you measured the right thing.
Keep the demonstration data out. Clear the sample numbers completely before the first real run, or you will spend a meeting explaining why September looks suspiciously tidy.
Curious how scorecards like this are built from scratch? The Excel Pivot Tables & Dashboards course on NextGenTemplates Academy shows the approach with practice files.
Get the Corporate Governance KPI Dashboard in Google Sheets
Frequently Asked Questions
Does this template make my organisation compliant?
No. It stores and presents numbers you type in. It performs no audit, verifies nothing, and makes no claim to satisfy any listing rule, governance code, board-reporting standard, audit requirement or regulation in any jurisdiction. It is not legal, financial, audit or governance advice. Your obligations are a matter for you and your own advisers.
Are the figures in the screenshots real company data?
No. Every number shown is generated demonstration data, present only so the charts and traffic lights are visible.
Is this the analytical Corporate Governance dashboard?
No, and the difference is the whole point of the first section above. This is the month-picker KPI scorecard. An analytical governance dashboard is chart-led over row-level data and answers different questions.
Can I add or remove KPIs?
Yes. Edit the KPI Definition sheet and the rest of the workbook follows. Stay inside the prepared row range so the formulas keep reaching your rows.
Why does a KPI score above 100% when the value fell?
It is marked LTB. For lower-is-better KPIs achievement is Target divided by Actual, so beating a cycle-time or count target scores above 100%. UTB KPIs use Actual divided by Target.
Does it need add-ons, macros or Apps Script?
No. It is native Google Sheets formulas and built-in charts throughout. Nothing to install, nothing to authorise, and no refresh step.
Can several people use it at once?
Yes, it behaves like any Google Sheet. Share it with your committee and set edit or view-only rights per person.
What about next year?
Duplicate your copy, move this year’s Actuals into the PY sheet, change the reporting-year start cell and enter the new targets.
What is actually delivered?
A PDF carrying the Make a Copy link and a short setup walkthrough. You end up with a live Google Sheet in your own Drive rather than a file on your desktop.
Related Templates
- Environmental, Social, and Governance (ESG) Dashboard in Google Sheets – the analytical counterpart for the E, S and G side.
- Audit & Internal Controls Dashboard in Google Sheets – goes much deeper on the audit and controls half of this scorecard.
- Carbon Footprint KPI Dashboard in Google Sheets – the same scorecard engine applied to emissions reporting.
Closing Thoughts
Governance reporting rarely fails because the data is missing. It fails because the data is scattered, arrives in different shapes, and gets rebuilt by hand every period until somebody quietly stops doing it. A scorecard with a fixed shape and a single month picker removes most of that friction: you type fourteen numbers, and the board pack builds itself.
What it will not do is tell you whether your governance is good. That judgement stays with the board, the committees and your advisers. The template just makes sure everyone is looking at the same numbers, presented the same way, month after month.
The template is available here: Corporate Governance KPI Dashboard in Google Sheets.
Disclaimer: this template and this article are for general information only. They are not legal, financial, audit or governance advice, and the template does not ensure, evidence or assess compliance with any law, listing rule, governance code or reporting standard. All figures shown are sample data.