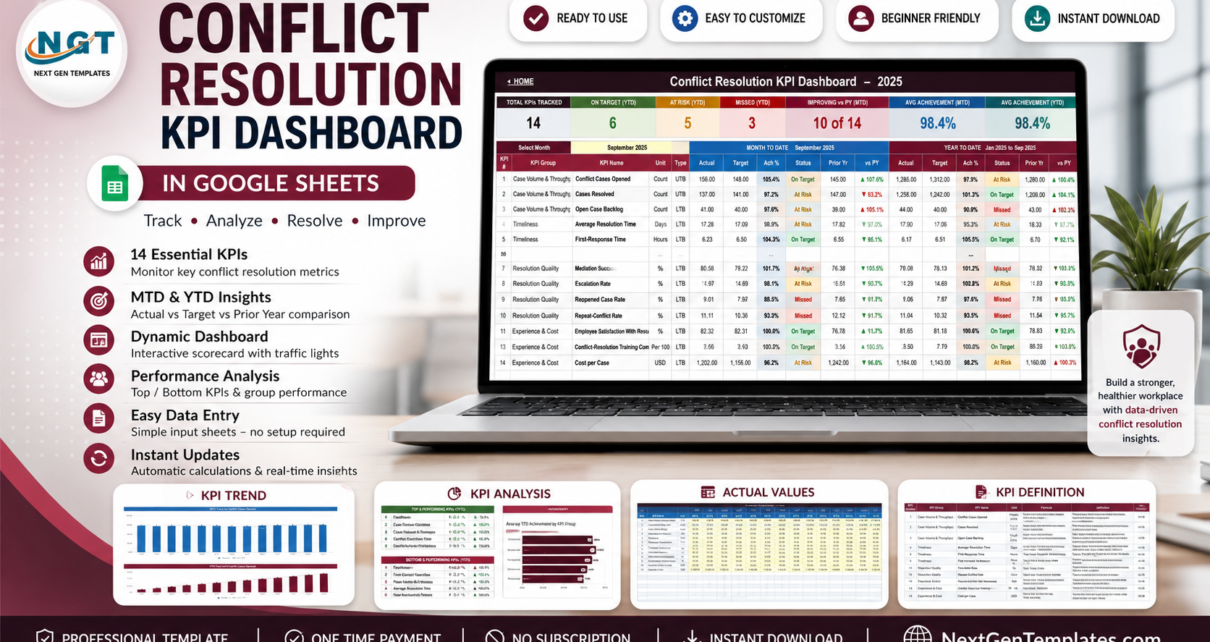
Most HR teams can tell you how many grievance and conflict cases they opened last month. Far fewer can say whether that number beat target, how it compares with the same month last year, or whether the average case is closing faster or slower than it used to. The Conflict Resolution KPI Dashboard in Google Sheets closes that gap with 14 KPIs across 4 groups, each carrying a target, a prior-year figure, a month-to-date and year-to-date achievement percentage and a traffic light – all driven by a single month dropdown.Conflict Resolution KPI Dashboard in Google Sheets
Before anything else, the honest framing: this is a manual tracking and visualisation template. It holds monthly totals that you type in. It is not a case-management system, it does not store individual grievance records, it does not connect to an HRIS, and it makes no employment-law or compliance claim. It is the reporting layer that sits on top of whatever process you already run.
Get the Conflict Resolution KPI Dashboard in Google Sheets
Key Features of the Conflict Resolution KPI Dashboard in Google Sheets
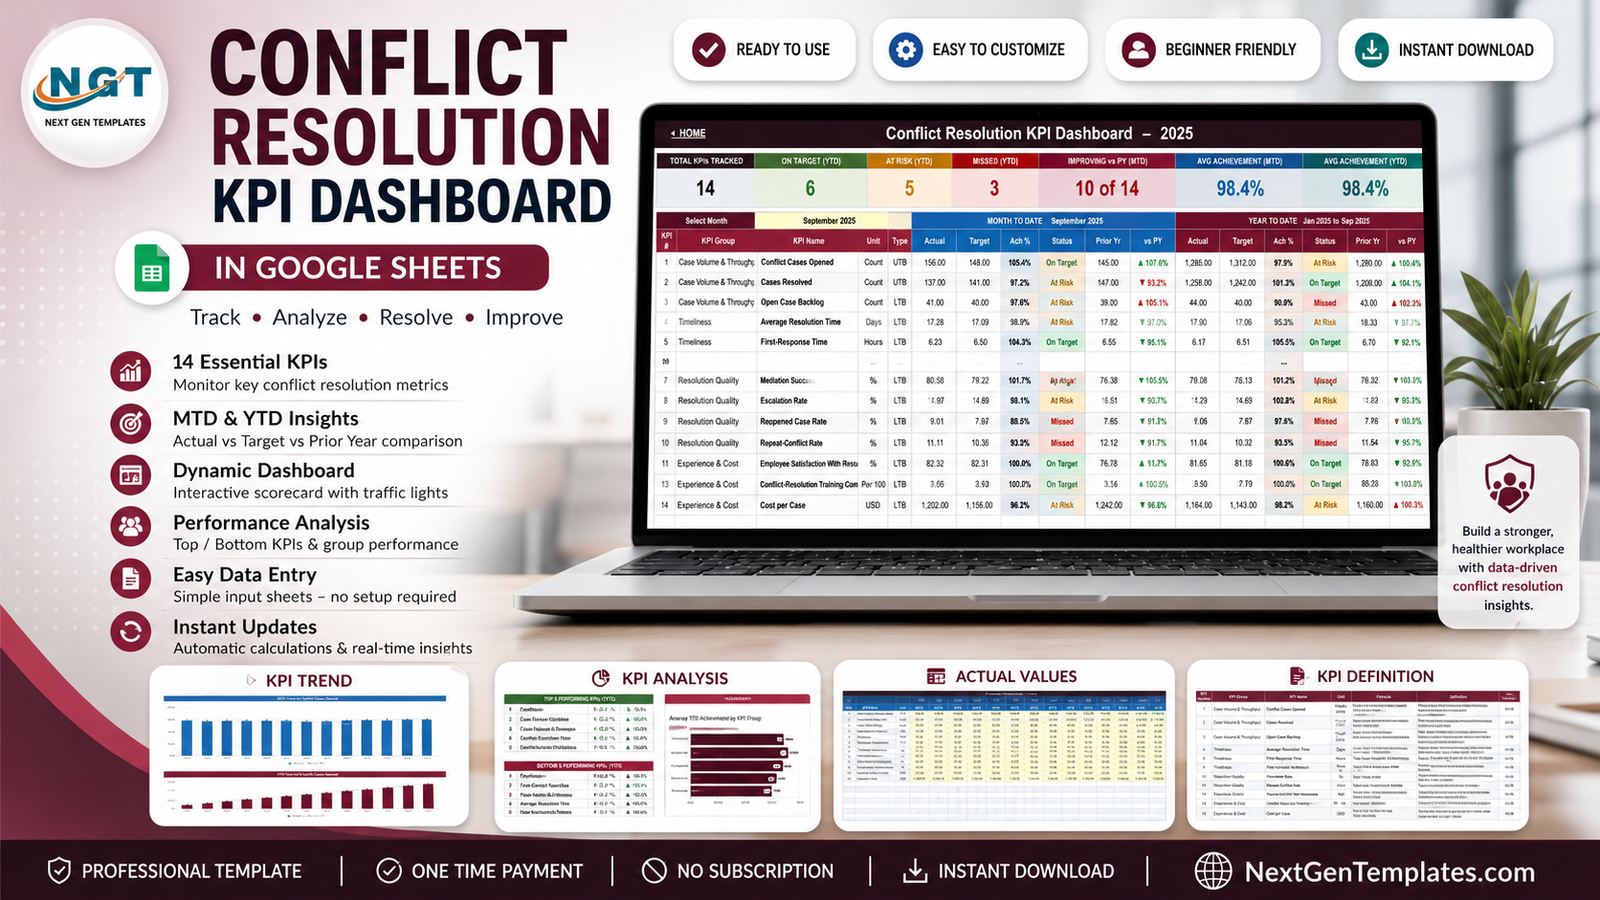
- 14 KPIs in 4 groups. Case Volume & Throughput (3), Timeliness (3), Resolution Quality (4) and Experience & Cost (4).
- One dropdown drives six sheets. Pick a month on the KPI Dashboard sheet and the tiles, percentages, traffic lights and the whole KPI Analysis page follow it.
- MTD and YTD side by side. Every KPI row shows Actual, Target, Achievement %, Status and Prior Year twice – once for the selected month, once for the year to date – plus a vs PY arrow for each.
- Direction-aware achievement. Upper-the-better (UTB) KPIs score Actual / Target. Lower-the-better (LTB) KPIs such as Average Resolution Time, Escalation Rate, Reopened Case Rate and Cost per Case score Target / Actual, so undercutting a cost or cycle-time target reads correctly as over 100%.
- Adjustable thresholds. On Target from 100%, At Risk 95% to 99%, Missed below 95% – all three live in the Status formulas.
- A single-KPI trend page with twelve monthly rows and two charts.
- An analysis page that ranks the top five and bottom five KPIs by YTD achievement on its own.Conflict Resolution KPI Dashboard in Google Sheets
- An editable KPI master list. Rename, re-group, add or delete a KPI once and every sheet follows.Conflict Resolution KPI Dashboard in Google Sheets
- Pure Google Sheets. No add-on, no Apps Script, no permission prompt, no refresh step.Conflict Resolution KPI Dashboard in Google Sheets
Dashboard Pages Explanation
Home
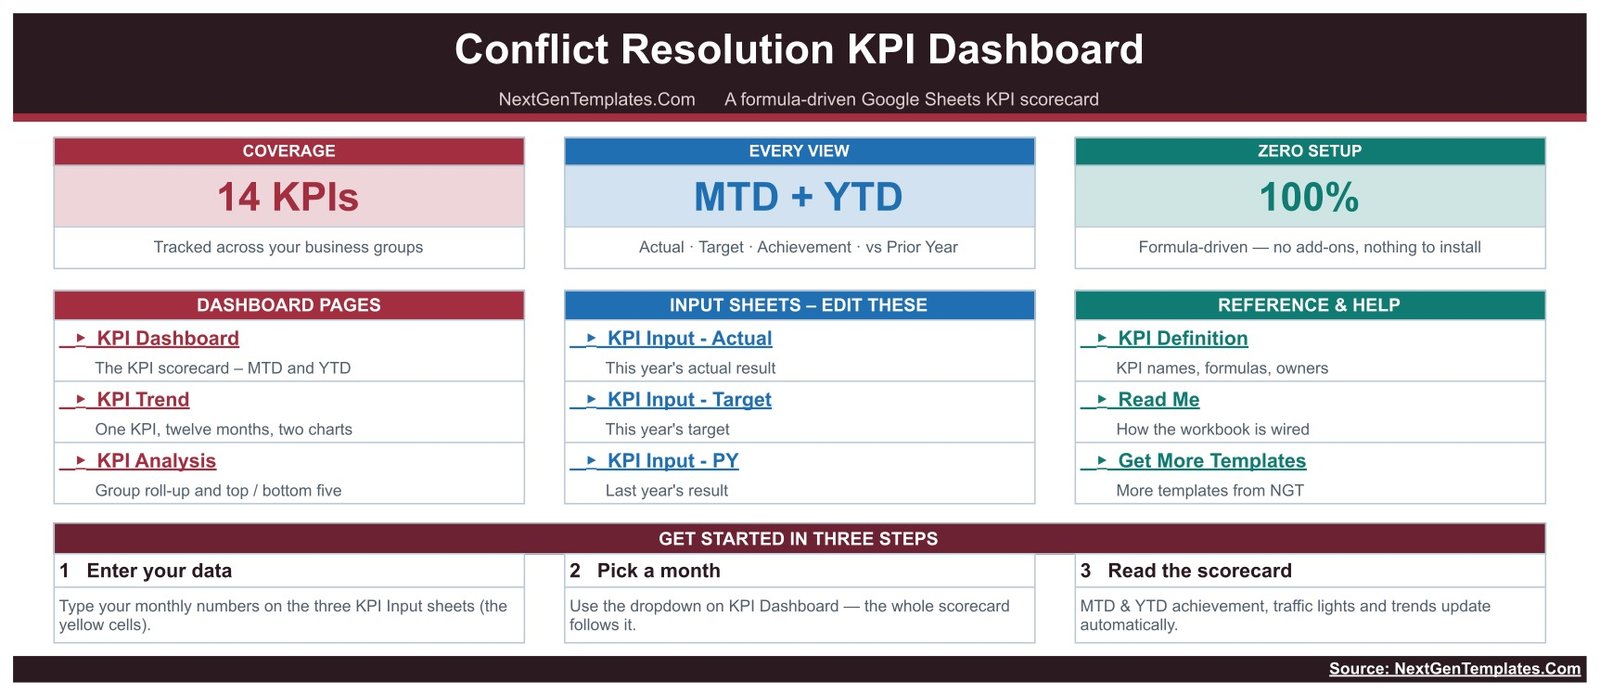
A launch page with three headline tiles – 14 KPIs, MTD + YTD, and 100% formula-driven – then three link blocks: the dashboard pages, the three input sheets you are meant to edit, and the reference sheets. A Get Started In Three Steps strip closes it: enter your data, pick a month, read the scorecard.
KPI Dashboard
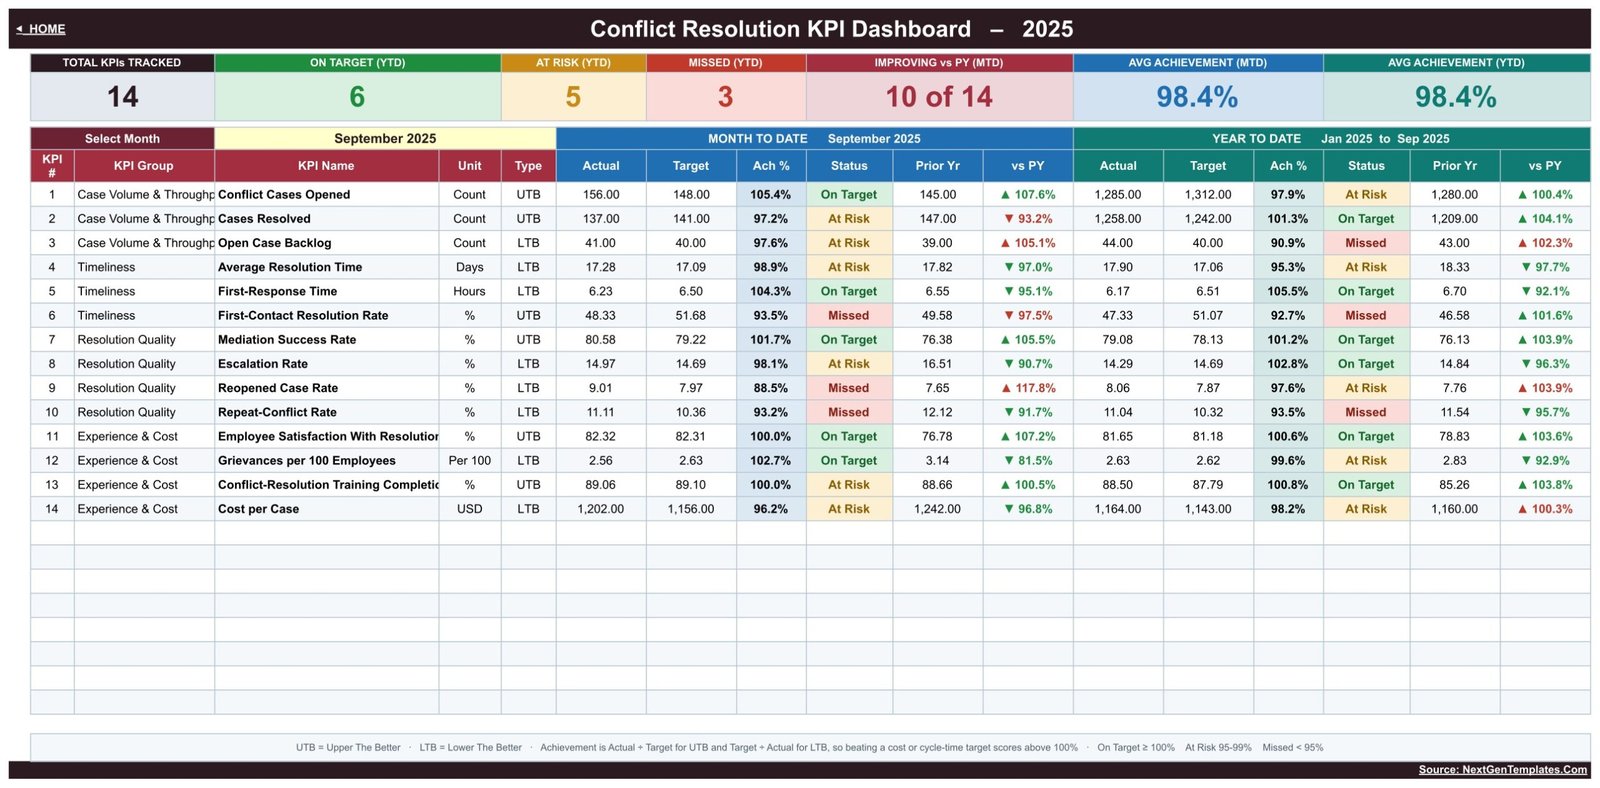
The scorecard. Seven tiles run across the top: Total KPIs Tracked, On Target (YTD), At Risk (YTD), Missed (YTD), Improving vs PY (MTD), Avg Achievement (MTD) and Avg Achievement (YTD). In the shipped demo data, with September 2025 selected, that reads 14 KPIs, 6 On Target, 5 At Risk, 3 Missed, 10 of 14 improving against prior year, and 98.4% average achievement on both MTD and YTD.
Below it, the 14 KPI rows. Conflict Cases Opened comes in at 156 against a 148 target – 105.4%, On Target – while its YTD figure of 1,285 against 1,312 lands at 97.9% and flags At Risk. Mediation Success Rate reads 80.58% against 79.22% (101.7%). Reopened Case Rate at 9.01% against a 7.97% target scores 88.5% and shows Missed, which is exactly the kind of line a monthly review should stop on.
KPI Trend
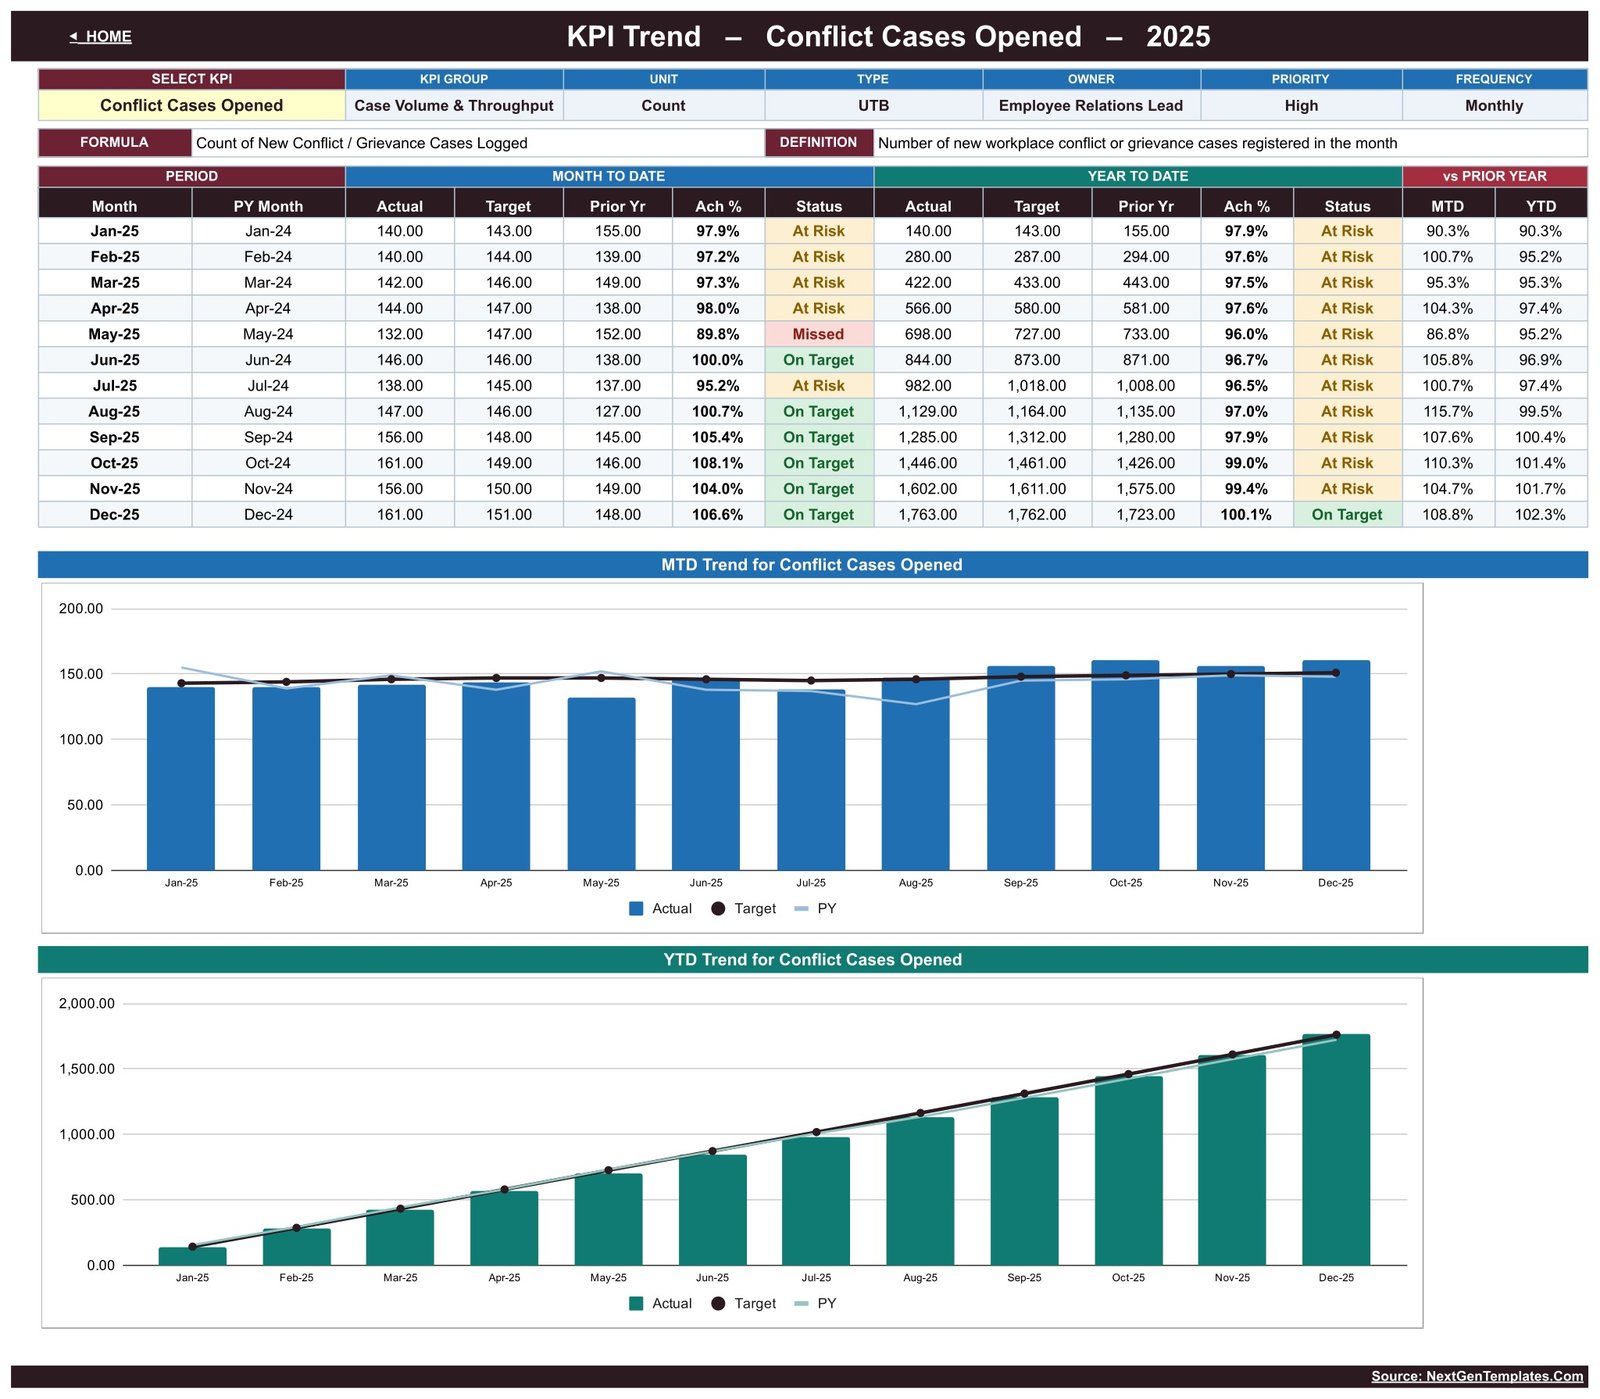
Pick one KPI from a dropdown and the page rebuilds around it. A header strip repeats that KPI’s group, unit, type, owner, priority, frequency, formula and definition, so nobody has to guess what is being measured. Twelve monthly rows follow with MTD and YTD blocks and a vs Prior Year pair, then two charts: MTD Trend and YTD Trend for the selected KPI, each plotting Actual as bars against Target markers and a Prior Year line.
KPI Analysis
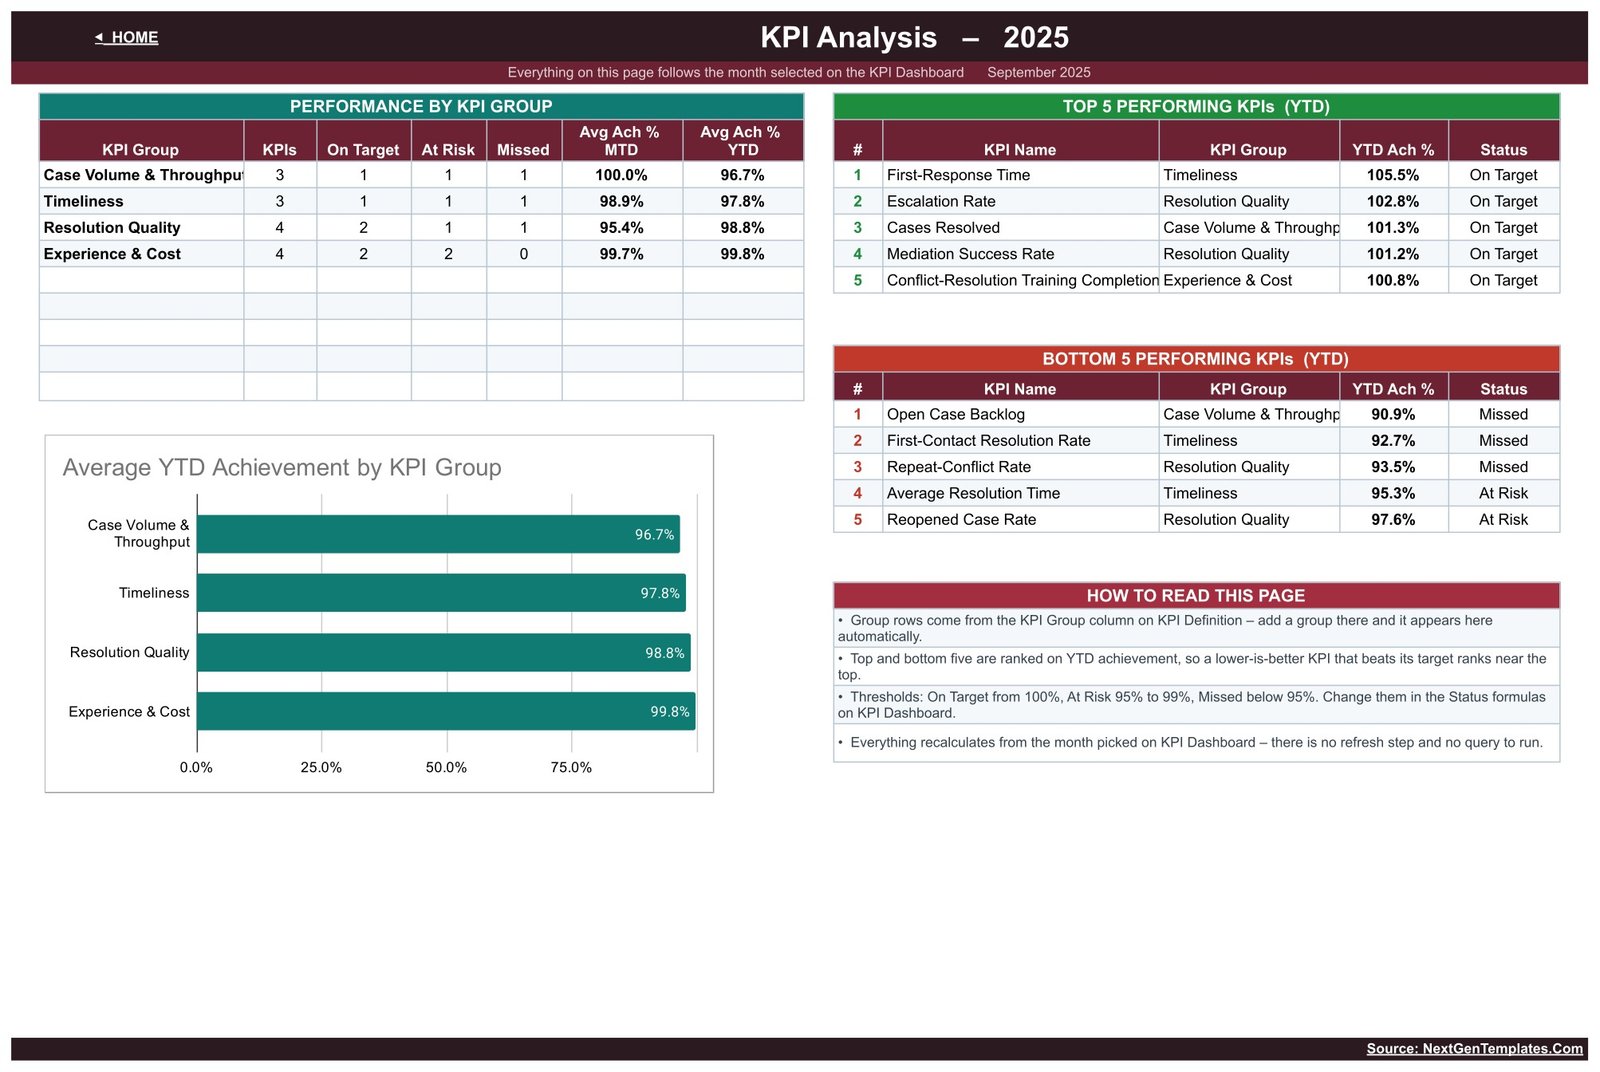
Three blocks plus a chart. Performance by KPI Group counts how many KPIs in each group are On Target, At Risk or Missed and averages their achievement – in the demo, Experience & Cost leads on 99.8% YTD and Case Volume & Throughput trails on 96.7%. Top 5 and Bottom 5 Performing KPIs rank on YTD achievement: First-Response Time heads the list at 105.5%, Open Case Backlog sits bottom at 90.9%. An Average YTD Achievement by KPI Group bar chart and a How To Read This Page panel finish the sheet.Conflict Resolution KPI Dashboard in Google Sheets
KPI Input – Actual, Target and PY
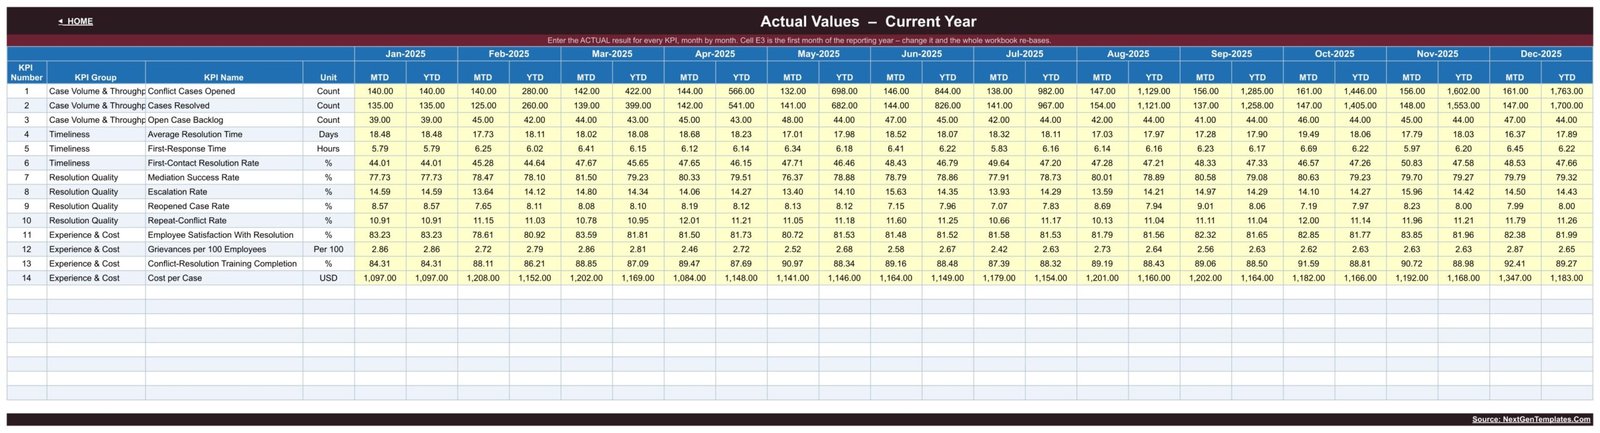
Three identical grids: this year’s actual result, this year’s target, and last year’s result. Fourteen KPI rows by twelve months, each month split into MTD and YTD columns, with yellow shading on every cell you are meant to type in. Cell E3 sets the first month of the reporting year, so a July-to-June financial year is one edit away.
KPI Definition
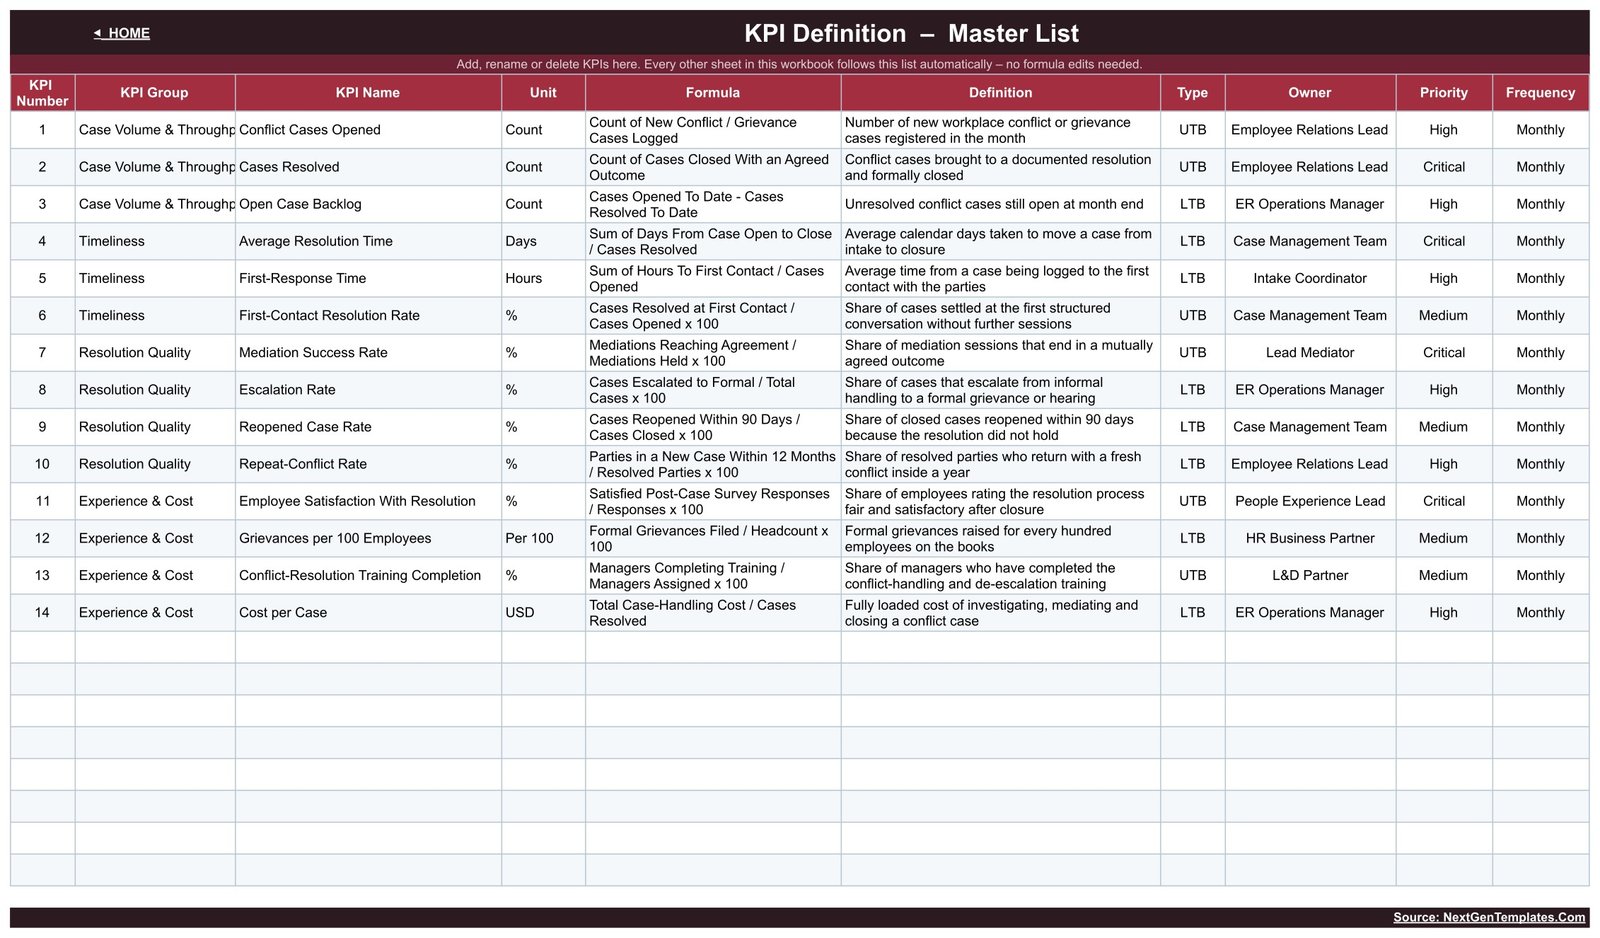
The master list the whole workbook reads from: KPI number, group, name, unit, formula, definition, type, owner, priority and frequency. Owners ship as roles rather than names – Employee Relations Lead, ER Operations Manager, Case Management Team, Intake Coordinator, Lead Mediator, People Experience Lead, HR Business Partner, L&D Partner – and the formula column spells out each definition, so Repeat-Conflict Rate is unambiguously “parties in a new case within 12 months divided by resolved parties”.
Google Sheets vs. Excel vs. Paid HR Case Software – Feature Comparison
| This template (Google Sheets) | An Excel KPI workbook | Paid HR case software | |
|---|---|---|---|
| Cost | One-time, under 10 | One-time, similar | Per user, per month |
| Platform | Browser, any device | Desktop Excel | Vendor web app |
| Setup time | Minutes | Minutes | Weeks, with implementation |
| Real-time collaboration | Yes, native | Only via OneDrive co-authoring | Yes |
| Mobile access | Yes, Sheets app | Limited | Yes |
| Customisable KPIs | Yes – edit the master list | Yes | Usually vendor-defined |
| Share with a link | Yes | No | Account required |
| Year-1 cost at 5 users | Under 10 total | Similar one-off | Typically several thousand |
| KPIs out of the box | 14, in 4 groups | Varies | Vendor-defined |
| Individual case records | No – monthly totals only | No | Yes, that is its purpose |
Who Should Use This Template
Employee-relations and HR operations leads who already log cases somewhere and need a monthly scorecard rather than another case list. HR business partners running two or more sites who want identical KPI definitions in each copy. Small people teams with no HR analytics platform and no budget for one. And anyone who wants to trial a conflict-resolution KPI set – the definitions alone are worth reading – before committing to a paid tool.
It is the wrong tool if you need case files, investigation notes, workflow, permissions per case or an audit trail. It is also wrong if you expect a live feed: every figure in it is typed by a person.
Real-World Use Cases
A 900-person services firm. The ER operations manager exports six counts from a ticketing tool each month, pastes them into the input sheets, and sends leadership one tab. Backlog, average resolution time and escalation rate all carry a target and a prior-year column, so the conversation starts at “why” rather than “what”.
A two-site manufacturer. One copy per site, same KPI master list. Grievances per 100 Employees and Repeat-Conflict Rate are compared directly because both sites are measuring the same thing the same way.
A 40-person startup. No HR platform. The people lead keeps five of the fourteen KPIs, deletes the rest from the master list, and pulls a quarterly board slide straight off the KPI Analysis page.
Advantages of the Conflict Resolution KPI Dashboard in Google Sheets
- Nothing to install or authorise. Native formulas and native charts only, which is also why it loads on a phone.
- Definitions travel with the numbers. The formula and definition columns stop two managers reporting “resolution time” two different ways.
- The lower-is-better handling is genuinely correct. Plenty of homemade scorecards punish a team for cutting cost per case; this one does not.
- Adding a KPI is a row, not a rebuild. The dashboard, trend and analysis sheets read the master list.
- Cheap to share. A view-only link costs nothing and adds no seat.
Opportunities for Improvement
Two things worth knowing before you buy, both cosmetic rather than functional:
- The KPI Group column clips long values. On the KPI Dashboard, KPI Analysis, KPI Input and KPI Definition sheets, “Case Volume & Throughput” renders as “Case Volume & Throughp” because the column is narrower than the text. Widening the column in your own copy fixes it in seconds; the underlying value is complete and every formula that reads it works.
- Two long KPI names clip the same way on the dashboard and analysis sheets – “Employee Satisfaction With Resolution” and “Conflict-Resolution Training Completion”. Same fix, same non-issue for the maths.
Beyond the cosmetics, the honest limitations are structural rather than fixable: there is no drill-down from a monthly figure to the cases behind it, no automated data feed, and no multi-year view – the workbook covers one reporting year at a time, with the prior year held as a comparison input.
Best Practices
- Enter aggregates only. Grievance and conflict records are confidential personal data. Keep names, case numbers and narrative out of this file entirely – it is designed for monthly totals and nothing about it is built to hold personal records safely.
- Lock down sharing on your copy. Even aggregate ER numbers are sensitive in a small organisation. Use restricted sharing rather than “anyone with the link”, and review access the way you would any HR document. Google’s own guide to sharing files from Google Drive covers the options.
- Agree the definitions before the first number. Fill the KPI Definition sheet with your organisation’s wording and owners, then start typing actuals.
- Set targets once a year, not monthly. Moving the target to match the actual defeats the whole scorecard.
- Read Bottom 5 before Top 5. The bottom block on KPI Analysis is where the month’s conversation is.
- Beware small denominators. A rate KPI over a handful of cases swings wildly. In a small team, watch the counts as well as the percentages.
Explore Relevant Templates
- Conflict Resolution KPI Dashboard in Google Sheets – the template this article covers.
- Internal Communications KPI Dashboard in Google Sheets
- Employee Benefits Utilization KPI Dashboard in Google Sheets
- Leadership Development KPI Dashboard in Google Sheets
- Workplace Safety KPI Dashboard in Google Sheets
- Corporate Governance KPI Dashboard in Google Sheets
- Human Resources (HR) KPI Dashboard in Excel
- Or browse the full Google Sheets KPI Dashboard category.
Want to build HR scorecards like this on your own data? The Excel Pivot Tables & Dashboards course on NextGenTemplates Academy teaches the reporting skills behind them, with practice files.
Get the Conflict Resolution KPI Dashboard in Google Sheets
Frequently Asked Questions
Does this dashboard help me comply with employment law?
No. It makes no employment-law, HR-compliance or employee-relations assurance claim. It charts numbers you type in. How you run a grievance or conflict process is a matter for your own qualified HR and legal advisers.
Is it a case-management or investigation system?
No. There are no case records, no notes, no workflow and no audit trail – one aggregate figure per KPI per month is all it holds.
Can I put case details in it?
Please do not. Those records are confidential personal data and you are responsible for how they are stored, shared and retained. Enter monthly totals only.
Does it connect to an HRIS or ticketing tool?
No. There is no integration and no refresh step, which is precisely why it needs no add-on and no permissions.
Can I change the KPIs?
Yes. Edit the KPI Definition sheet and the dashboard, trend and analysis sheets follow automatically.
Why does a lower Cost per Case score above 100%?
It is marked LTB – lower the better – so achievement is Target divided by Actual. Coming in under a cost or cycle-time target correctly reads as over-performance.Conflict Resolution KPI Dashboard in Google Sheets
Do I need Excel or a paid add-on?
Neither. A free Google account and a browser are enough.Conflict Resolution KPI Dashboard in Google Sheets
About the Author
Built by PK – Microsoft Certified Professional with 15+ years of Excel, Google Sheets, and Power BI experience. Founder of NextGenTemplates, reaching 300K+ subscribers across YouTube channels. Every template is hand-built and tested before release.
Conclusion
Conflict and grievance work is judged on how it feels long before anyone checks how it performs. A scorecard will not settle a dispute, but it will tell you whether cases are closing faster than last year, whether escalations are rising, and whether the people who went through the process said it was fair. The Conflict Resolution KPI Dashboard in Google Sheets gives you those 14 answers on one page, for the price of a lunch and about ten minutes of typing a month – as a reporting layer over your own numbers, not as a substitute for the process itself or for professional HR advice.Conflict Resolution KPI Dashboard in Google Sheets
Get the Conflict Resolution KPI Dashboard in Google Sheets – one-time payment, instant download, and the PDF in your order carries the Make a copy link.Conflict Resolution KPI Dashboard in Google Sheets