Most electrical contractors already have the numbers. They are just in six places: the inspection log, the safety file, the dispatch board, the job costing export and two spreadsheets nobody else can open. The Electrical Contractor KPI Scorecard in Google Sheets collapses that into one monthly page – ten KPIs, each with a target, a traffic light, a change figure and a twelve-month bar strip – so the monthly review starts with what is red instead of with what is missing.Electrical Contractor KPI Scorecard in Google Sheets
This is a scorecard, not an analytics dashboard. You pick a month, and every KPI is scored against that month’s target. It ships as four sheets: a Scorecard page, a KPI Trend page, a KPI Analysis definitions page and a Data sheet holding twelve months of MTD and YTD figures. It runs entirely in Google Sheets – no add-on, no macro, no subscription.
Get the Electrical Contractor KPI Scorecard in Google Sheets
Key Features of the Electrical Contractor KPI Scorecard in Google Sheets
- Ten electrical-contracting KPIs already written – across four groups: Safety & Compliance, Field Productivity, Project Delivery and Financial Performance.
- A single month picker – the Select Month control on the Scorecard header re-scores all ten cards.Electrical Contractor KPI Scorecard in Google Sheets
- Traffic-light status per KPI – green, amber or red against that month’s target, on every card.Electrical Contractor KPI Scorecard in Google Sheets
- Target, change and percentage move – shown under each headline value with a green up or red down arrow.Electrical Contractor KPI Scorecard in Google Sheets
- Twelve-month mini bar chart in every card – the shape of the year without opening another sheet.Electrical Contractor KPI Scorecard in Google Sheets
- UTB / LTB direction logic – Callback Rate and Recordable Incident Rate are lower-the-better, so a fall scores green rather than red.
- MTD and YTD, actual vs target vs prior year – both views carried in the data and charted on the KPI Trend page.
- Formula and definition for every KPI – documented on the KPI Analysis sheet so estimators, foremen and the owner argue about the number, not the definition.
Scorecard Pages Explained
Page 1 – KPI Scorecard
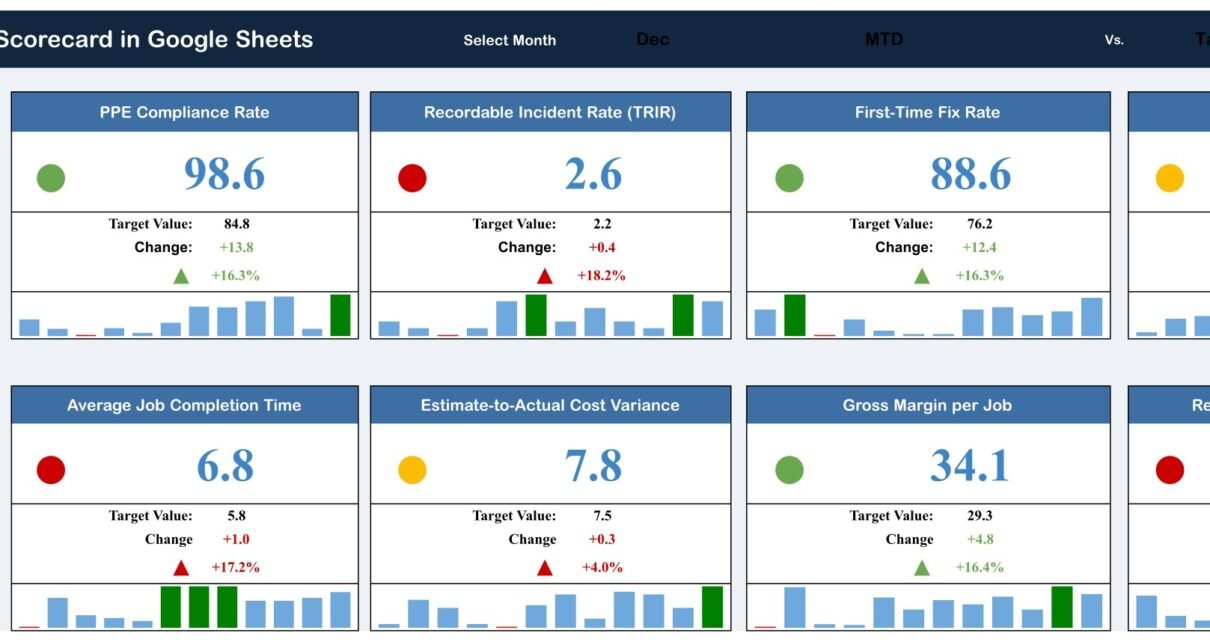
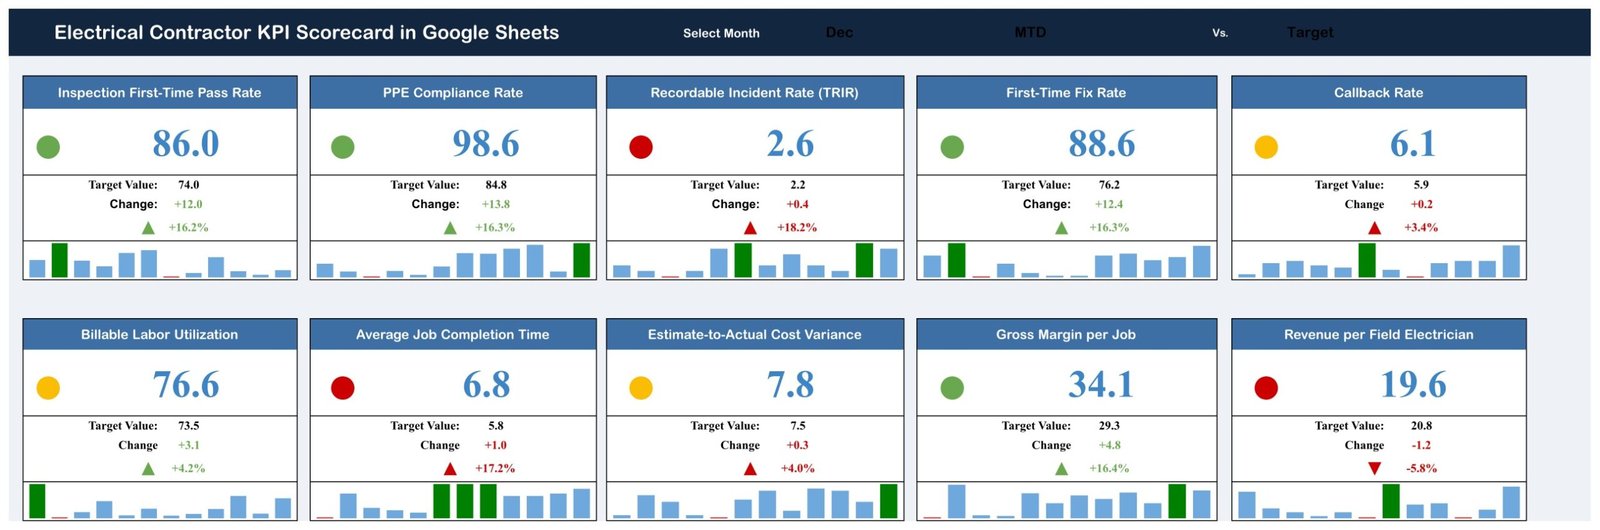
Ten cards in two rows of five. The header carries the Select Month control and the MTD vs. Target label. Each card shows the KPI name in a coloured band, a traffic-light dot, the actual value in large type, the Target Value, the absolute Change, the percentage change with a direction arrow, and a twelve-month bar strip that highlights the month you selected.
The ten KPIs are Inspection First-Time Pass Rate, PPE Compliance Rate, Recordable Incident Rate (TRIR), First-Time Fix Rate, Callback Rate, Billable Labor Utilization, Average Job Completion Time, Estimate-to-Actual Cost Variance, Gross Margin per Job and Revenue per Field Electrician.
Page 2 – KPI Trend
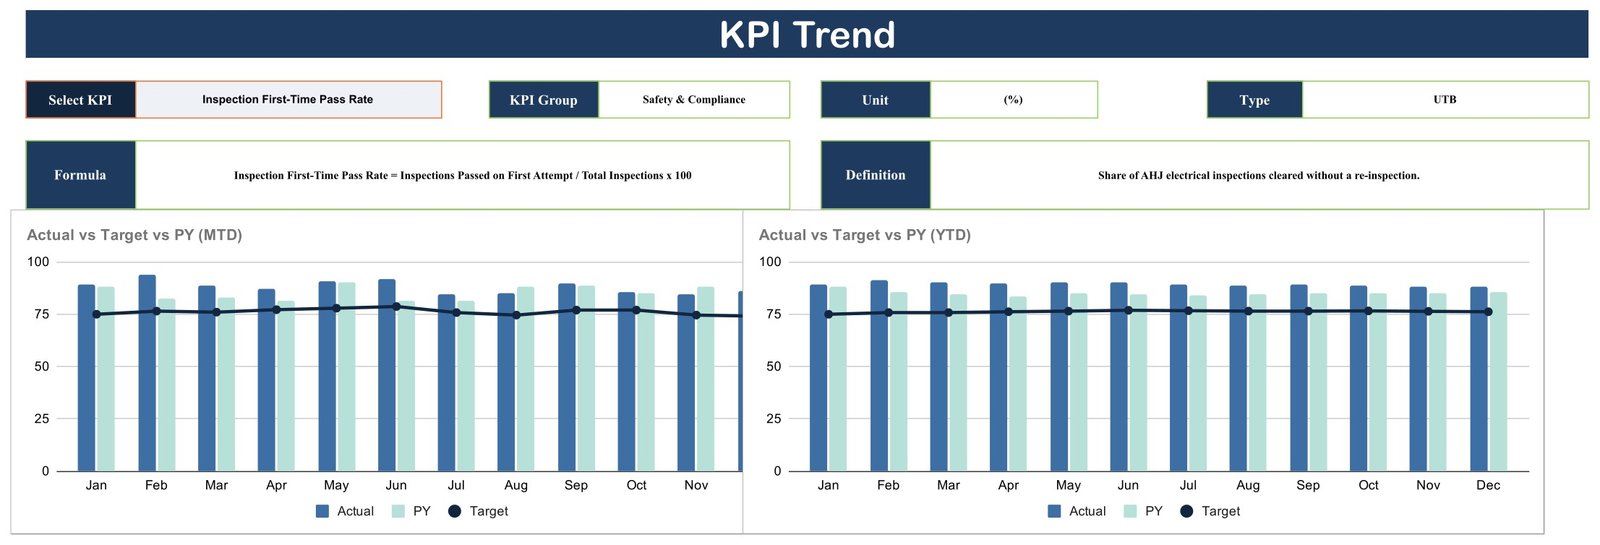
Choose one KPI from the Select KPI control. The page fills in that metric’s KPI Group, Unit, Type (UTB or LTB), Formula and Definition, then draws two charts side by side: Actual vs Target vs PY (MTD) and Actual vs Target vs PY (YTD). Actual and prior year are bars; target is a line running across the top. Twelve months on each, Jan to Dec.
This is the page that answers the awkward question – was last month good, or was the target soft? Seeing the target line flat while the actual bars wander tells you more than any single number on the scorecard.
Page 3 – KPI Analysis
One reference table listing all ten KPIs with their number, KPI Group, KPI Name, Unit, Formula, Definition and Type. Units are explicit – percentages for most, per 200,000 hours for TRIR, days for Average Job Completion Time, and $000 per month for Revenue per Field Electrician. TRIR is normalised the standard way, which matches how OSHA injury and illness recordkeeping expects the rate to be expressed.

Page 4 – Data
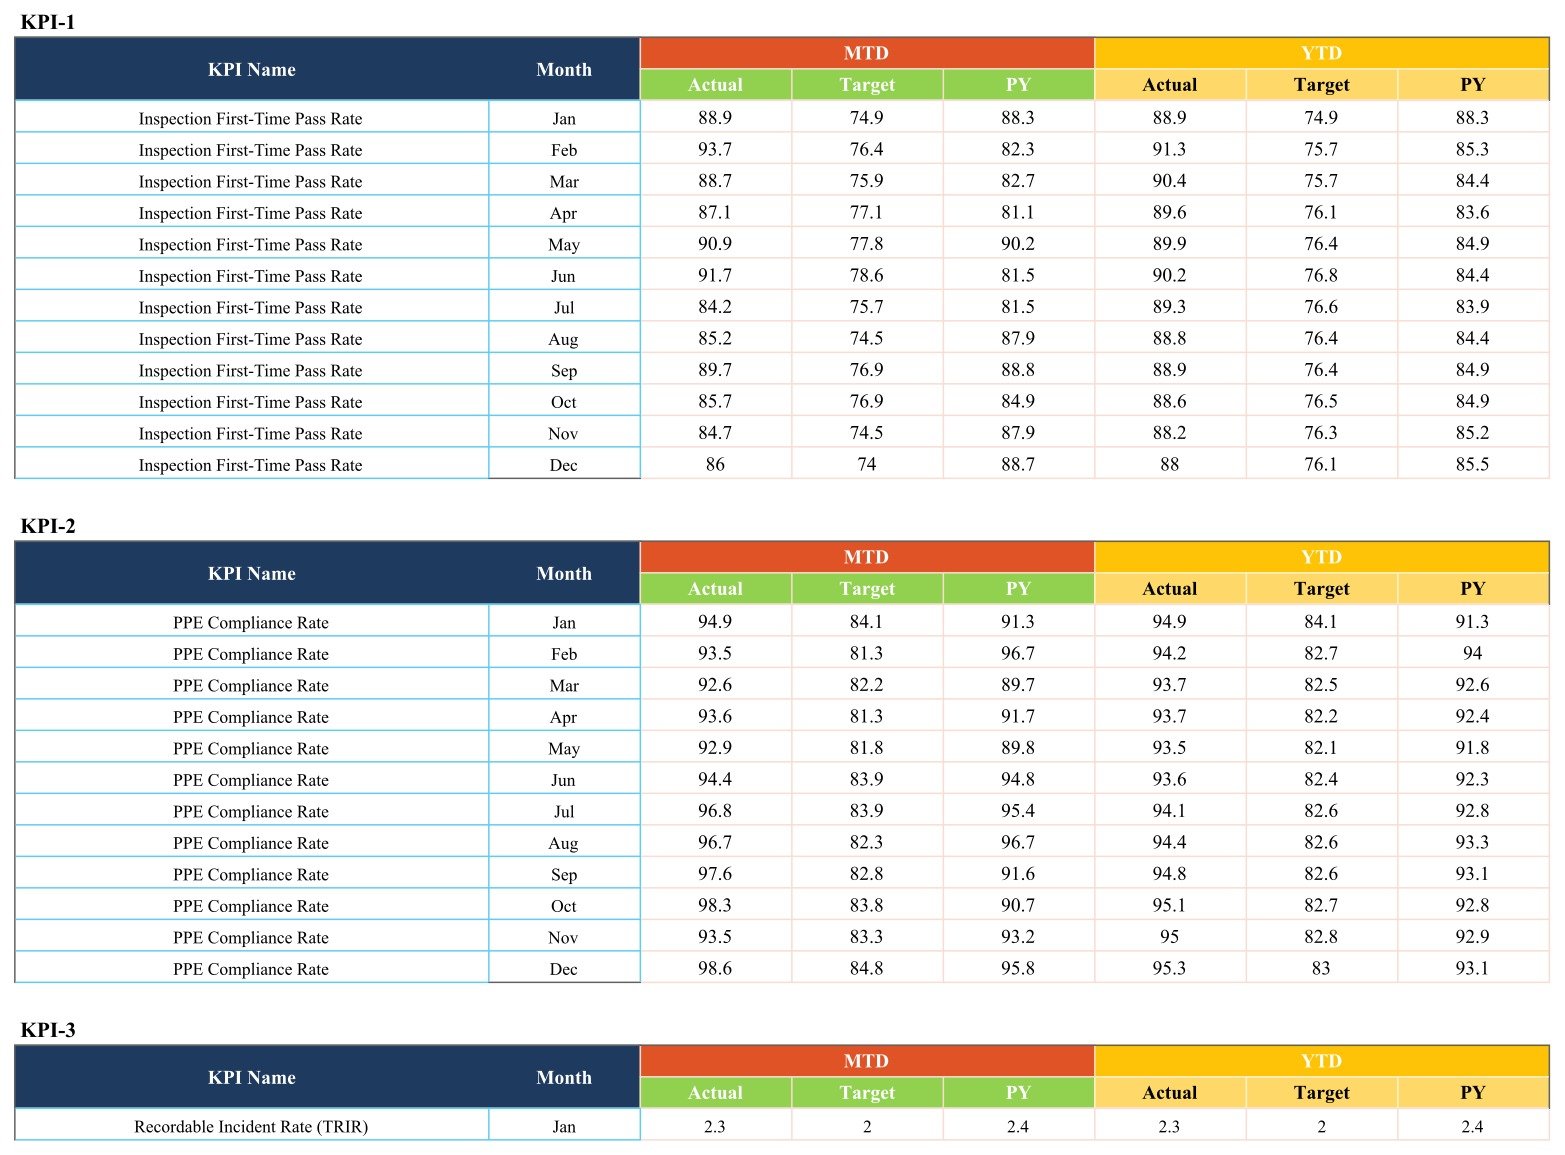
The input sheet, and the only one you have to maintain. It runs one block per KPI – KPI-1 through KPI-10 – and each block has twelve month rows against six columns: MTD Actual, Target and PY, then YTD Actual, Target and PY. Overwrite the sample numbers with your own and the Scorecard and KPI Trend pages follow.
Electrical Contractor KPI Scorecard in Google Sheets vs. Excel vs. Paid Field-Service Software – Feature Comparison
| This scorecard (Google Sheets) | Excel version | Paid field-service / KPI platform | |
|---|---|---|---|
| Cost | One-time purchase | One-time purchase | Recurring subscription, usually per user |
| Platform | Any browser, free Google account | Excel desktop | Vendor web app plus a mobile app |
| Setup time | Copy the sheet, type your numbers – minutes | Open the file, type your numbers – minutes | Implementation and data mapping, typically weeks |
| Real-time team collaboration | Yes, native to Google Sheets | Only via OneDrive / SharePoint | Yes |
| Mobile access | Google Sheets mobile app | Excel mobile app | Yes |
| Customizable KPIs | Yes – rename, redefine, re-target any of the ten | Yes | Only the KPIs the vendor ships |
| Share with a link | Yes | Attachment or cloud link | Seat-based logins |
| Year-1 cost at 5 users | The purchase price, once | The purchase price, once | Hundreds to thousands per year |
| Traffic-light scoring vs. target | Built in, direction-aware | Built in | Usually configurable |
| Dispatch, scheduling, invoicing | No – reporting only | No | Yes, that is the point of the subscription |
Who Should Use This Template
Owner-operators of small and mid-size electrical contracting firms who want one page for the monthly review instead of five exports. Service managers who report upward every month and need First-Time Fix Rate and Callback Rate on the same page as Gross Margin per Job. Safety and compliance leads who would rather show TRIR and PPE Compliance Rate next to the commercial numbers than in a separate file nobody reads. And estimators and project managers who care about Estimate-to-Actual Cost Variance and want a twelve-month record of it.
It is a poor fit if you want dispatch, scheduling, technician timesheets or invoicing. This sheet reports on the month that happened; it does not run the field. It also does not import anything – somebody types or pastes the monthly figures in.
Real-World Use Cases
Monthly management review. Ravi runs a 14-electrician commercial contractor. On the first Monday he pastes last month’s figures into the Data sheet, opens the Scorecard, selects the month, and the two red dots set the agenda. The meeting starts on the problem instead of on which spreadsheet is current.
Diagnosing rework. Dana, a service manager at a residential firm, reads Callback Rate and First-Time Fix Rate as a pair. A rising callback rate with a flat first-time fix rate points at van stock, not at diagnosis. She brings the KPI Trend page – actual against prior year – rather than a single month’s number.
Prequalification evidence. Marcus keeps Inspection First-Time Pass Rate, PPE Compliance Rate and TRIR current because the firm bids public work. Exporting the Scorecard page to PDF gives him a dated, consistent record that safety performance is reviewed monthly.
Advantages of the Electrical Contractor KPI Scorecard in Google Sheets
- The KPIs are already chosen. Ten metrics that actually matter to an electrical contractor, with formulas and definitions attached – most of the work in a scorecard project is deciding what to measure, and that is done.Electrical Contractor KPI Scorecard in Google Sheets
- Scoring is direction-aware. Lower-the-better metrics are tagged LTB, so the traffic lights are trustworthy without you rewriting conditional formatting.
- Everyone can open it. A shared link works for the owner on a laptop and the foreman on a phone. No licence to buy, no file to email around.Electrical Contractor KPI Scorecard in Google Sheets
- Target and prior year are both present. Comparing against last year is what separates a real trend from a seasonal one.
- It is yours to edit. Nothing is locked behind a vendor’s KPI library – rename a metric, change a formula, change a target.
- One-time cost. No per-seat billing as the crew grows.
Opportunities for Improvement
Being straight about the limits: data entry is manual. Nothing connects to accounting, job costing or a field-service app; you paste the month in. There are no alerts or notifications – the sheet does not email anyone when a KPI goes red, it just shows red the next time it is opened. The Data sheet ships twelve months, so a multi-year history means extending the sheet yourself while keeping the column layout intact. And granularity is monthly and firm-level: there is no per-job or per-technician drill-down, which is deliberate for a leadership scorecard but wrong if you want to rank crews.Electrical Contractor KPI Scorecard in Google Sheets
Best Practices
- Fix the definitions before the first month. Open KPI Analysis and make each formula match how your firm already calculates it. A scorecard that disagrees with the job costing report gets ignored.
- Set targets you will defend. The traffic lights are only as useful as the target column behind them – a target nobody believes turns the whole page green or the whole page red.
- Enter prior-year figures once. The PY column is what makes the KPI Trend charts worth opening; skipping it halves the value of the template.
- Keep the same day of the month. Update on a fixed date so the MTD and YTD comparisons stay honest.
- Review two KPIs deeply, not ten. Use the Scorecard to pick the reds, then use the KPI Trend page on just those.
- Protect the Data sheet layout. The Scorecard and Trend pages read fixed blocks – insert rows inside a KPI block and the references shift.
Explore Relevant Templates
- Electrical Contractor KPI Scorecard in Excel – prefer Excel? The same scorecard is available for it, with the same ten KPIs and the same four pages.
- Construction Progress & Cost Control Dashboard in Google Sheets – job-level progress and cost, where this scorecard is monthly and firm-level.
- Office Safety Inspection Tracker in Google Sheets – the inspection log that feeds a first-time pass rate.
- Equipment Maintenance Log Tracker in Google Sheets – keep test gear and tools serviceable behind the productivity numbers.
- Solar Energy KPI Scorecard in Google Sheets and Cybersecurity Awareness KPI Scorecard in Google Sheets – the same scorecard format applied to other industries.
Get the Electrical Contractor KPI Scorecard in Google Sheets
To get better at building KPI and reporting views yourself, the Excel Pivot Tables & Dashboards course on NextGenTemplates Academy works through the techniques with practice files.
Frequently Asked Questions
Do I need Excel or any paid software?
No. It runs in Google Sheets in a browser with a free Google account. There is no add-on, no macro and no subscription.
How do I get my own copy?
The download is a PDF containing the “Make a copy” link. Click it while signed in to Google and a private copy is created in your own Drive.
Can I change the ten KPIs?
Yes. Rename the KPI on the KPI Analysis sheet, edit its formula text and definition, set the Type to UTB or LTB so the traffic light scores in the right direction, and enter the matching figures in that KPI’s block on the Data sheet.
Does it connect to accounting or field-service software?
No. You type or paste the monthly figures into the Data sheet. Nothing syncs, imports or sends alerts.
Is this the same as a KPI dashboard?
No. This is the scorecard – month picker, target-vs-actual cards with traffic lights, a KPI Trend page and a KPI Analysis page. The KPI dashboards are chart-led analytics pages with slicers. They complement each other rather than overlap.
How many months does it hold?
Twelve, January to December, with MTD and YTD actual, target and prior-year values per KPI. You can extend it if you keep the column layout.
Can my whole team see it?
Yes – share the file from Google Sheets like any other spreadsheet, or export the Scorecard page to PDF for a meeting pack.
About the Author
Built by PK – Microsoft Certified Professional with 15+ years of Excel, Google Sheets, and Power BI experience. Founder of NextGenTemplates, reaching 300K+ subscribers across YouTube channels. Every template is hand-built and tested before release.
Conclusion
An electrical contracting business is measured on three things at once – whether the work is safe, whether it is done right the first time, and whether it makes money. The Electrical Contractor KPI Scorecard in Google Sheets puts all three on one page, scores them against your own targets, and keeps twelve months of history behind them so a bad month is visible as a trend rather than an argument.
Get the template here: Electrical Contractor KPI Scorecard in Google Sheets. Prefer Excel? The same scorecard is available as the Electrical Contractor KPI Scorecard in Excel.