Most audit functions can tell you how many audits they finished last year. Far fewer can answer, on the first Monday of the month, what Findings Closed On Time did against target, whether Corrective Action Cycle Time is moving the right way against the same month last year, and which of their KPI groups is quietly dragging the year down. The Compliance Audit KPI Dashboard in Google Sheets was built for exactly that gap: 14 named audit KPIs across 4 groups, each showing month-to-date and year-to-date achievement, a prior-year comparison and a traffic light, all driven by a single month dropdown and nothing but native formulas.
Two things to be clear about before anything else, because compliance is a subject where vague marketing does real damage. First, this is the KPI Dashboard build – the month-picker, traffic-light family with a KPI Trend page and a KPI Analysis page. It is not the analytical Google Sheets dashboards with slicers and charts over a data table, and it is not a KPI scorecard with RAG cards; near-identical names exist across all three families, and the differences are set out further down. Second, and more importantly: this is a spreadsheet for tracking audit KPIs. It is not an audit management system, it certifies nothing, it is not evidence of compliance with any standard or regulation, and it gives no legal or regulatory advice. It shows you the numbers you type into it, arranged so a monthly review takes fifteen minutes instead of an afternoon.
Get the Compliance Audit KPI Dashboard in Google Sheets
Key Features of the Compliance Audit KPI Dashboard in Google Sheets
Fourteen KPIs, four groups, one master list. Audit Execution carries Audits Completed, Audit Plan Completion, Audit Coverage and Audit Pass Rate. Findings & Remediation carries Open Findings, Findings Closed On Time, Corrective Action Cycle Time, Remediation Rate and Overdue Corrective Actions. Risk & Controls carries High-Risk Findings, Control Effectiveness and Repeat Findings. Quality & Reporting carries Evidence Completeness and Audit Report Timeliness. All fourteen are defined once on the KPI Definition sheet, and every other sheet reads from that list.
One dropdown drives everything. The KPI Dashboard has a Select Month cell built on a standard Google Sheets drop-down list. Change it and the seven summary tiles, all fourteen traffic lights, the KPI Trend page and the KPI Analysis page re-base together. There is no refresh button, no query to run and no add-on to authorise.
MTD and YTD side by side. Each KPI row carries a Month-To-Date block – Actual, Target, Achievement %, Status, Prior Yr, vs PY – and then the identical six columns again for Year-To-Date, with the span spelled out in the header (Jan 2025 to Sep 2025 in the sample file).
Upper-the-better and lower-the-better done properly. Achievement is Actual divided by Target for UTB KPIs and Target divided by Actual for LTB KPIs. That matters more in audit than in most subjects, because five of the fourteen KPIs here are lower-the-better. In the sample month, 35 Overdue Corrective Actions against a target of 39 reads as 111.4% and On Target – not as a red number somebody has to explain in a meeting.
Traffic lights you can move. On Target from 100%, At Risk 95% to 99%, Missed below 95%. Those thresholds live in the Status formulas on the KPI Dashboard sheet, so an audit function with a tighter tolerance can change them in one place.
Nothing to install. No Apps Script, no add-ons, no connectors, no macros. It opens in any browser, on any Google account, and it works the same on a phone.
Dashboard Pages Explanation
Home
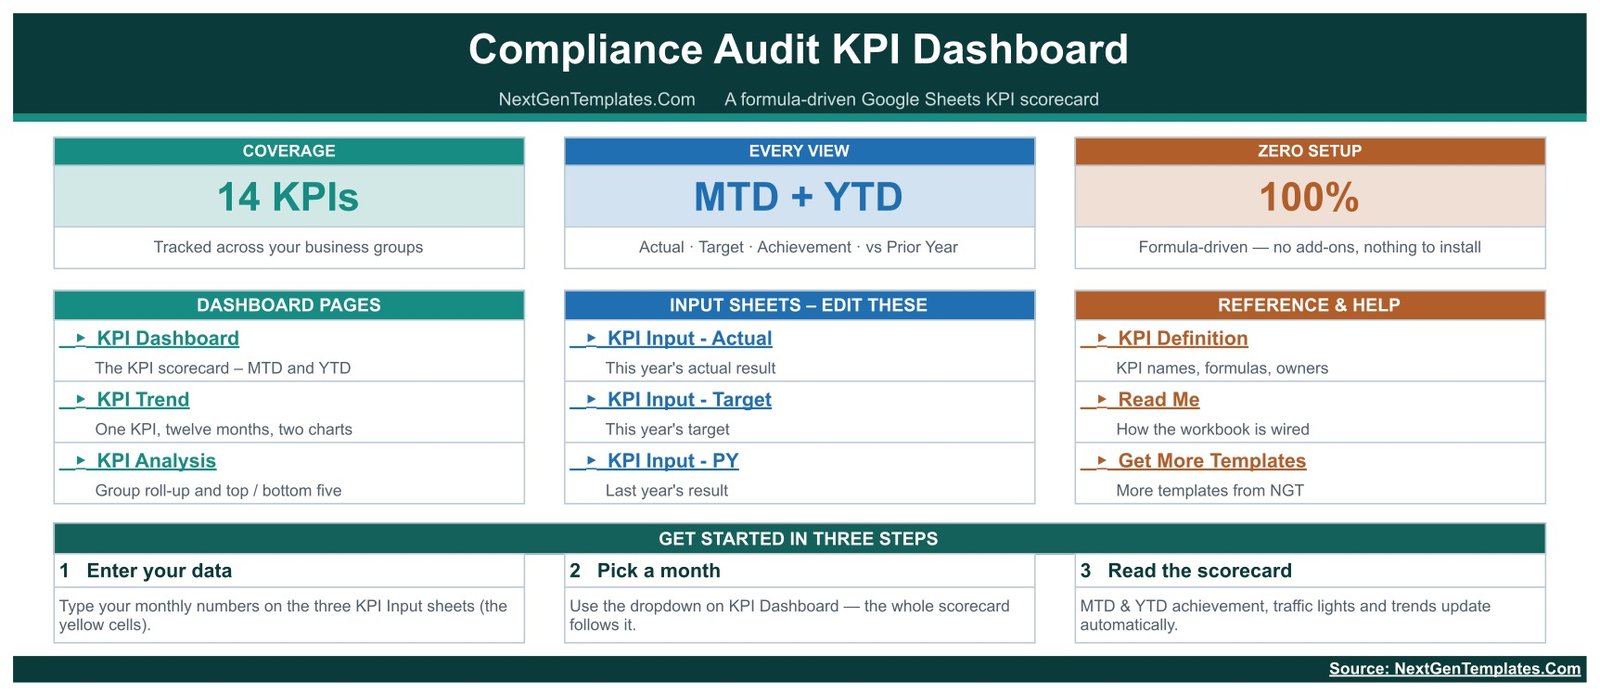
A launcher rather than a report. Three coverage tiles – 14 KPIs, MTD + YTD, 100% formula-driven – then three link panels: Dashboard Pages, Input Sheets – Edit These, and Reference & Help. A three-step start guide sits at the bottom: enter your data, pick a month, read the scorecard.
KPI Dashboard
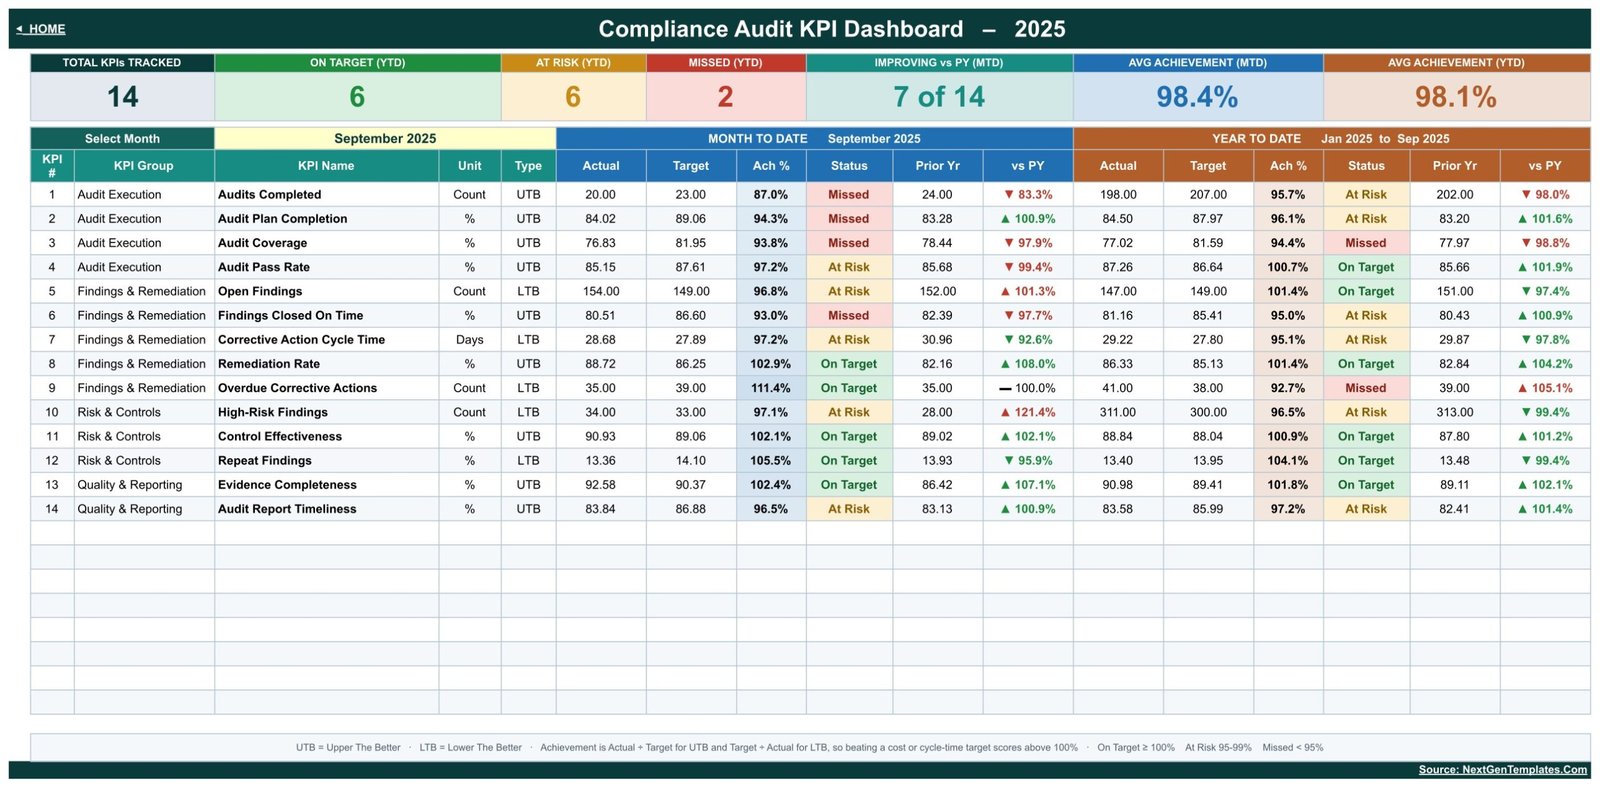
The scorecard itself. Seven tiles run across the top: Total KPIs Tracked, On Target (YTD), At Risk (YTD), Missed (YTD), Improving vs PY (MTD), Avg Achievement (MTD) and Avg Achievement (YTD). In the sample month those read 14, 6, 6, 2, 7 of 14, 98.4% and 98.1%. Below them sits the month picker and then one row per KPI, with the group, unit and type carried through from the definition sheet so nobody has to remember whether Repeat Findings is meant to go up or down. A footnote line under the table restates the UTB/LTB rule and the three thresholds.
KPI Trend
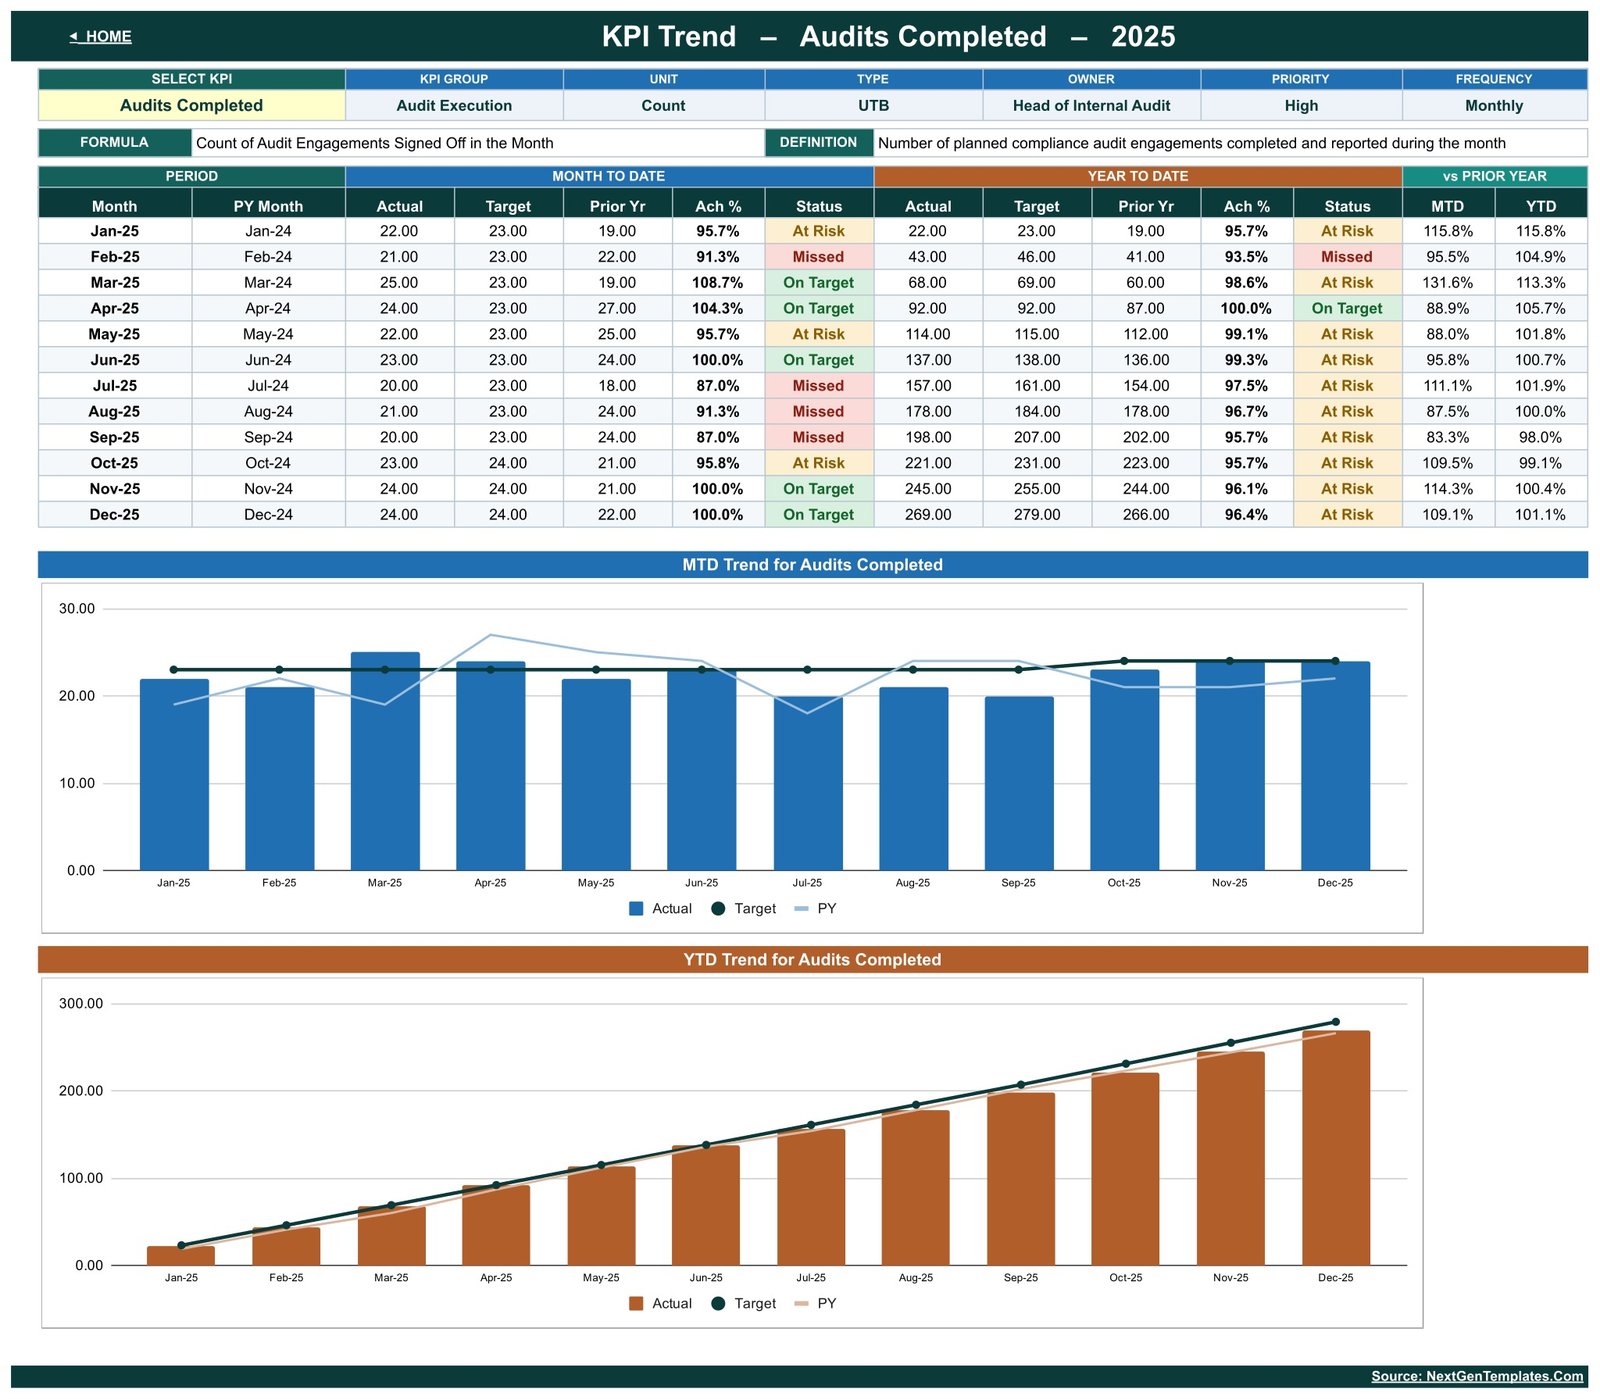
One KPI, twelve months. Pick a KPI at the top and the header fills in its group, unit, type, owner, priority, frequency, formula and definition. The table underneath gives each month’s MTD actual, target, prior year, achievement and status, then the same for YTD, then MTD-vs-PY and YTD-vs-PY percentages. Two charts follow: MTD Trend for [KPI] – actual bars with a target line and a prior-year line – and YTD Trend for [KPI], the cumulative version. This is the page that turns “we missed September” into “we have missed three of the last four, and the gap is widening”.
KPI Analysis
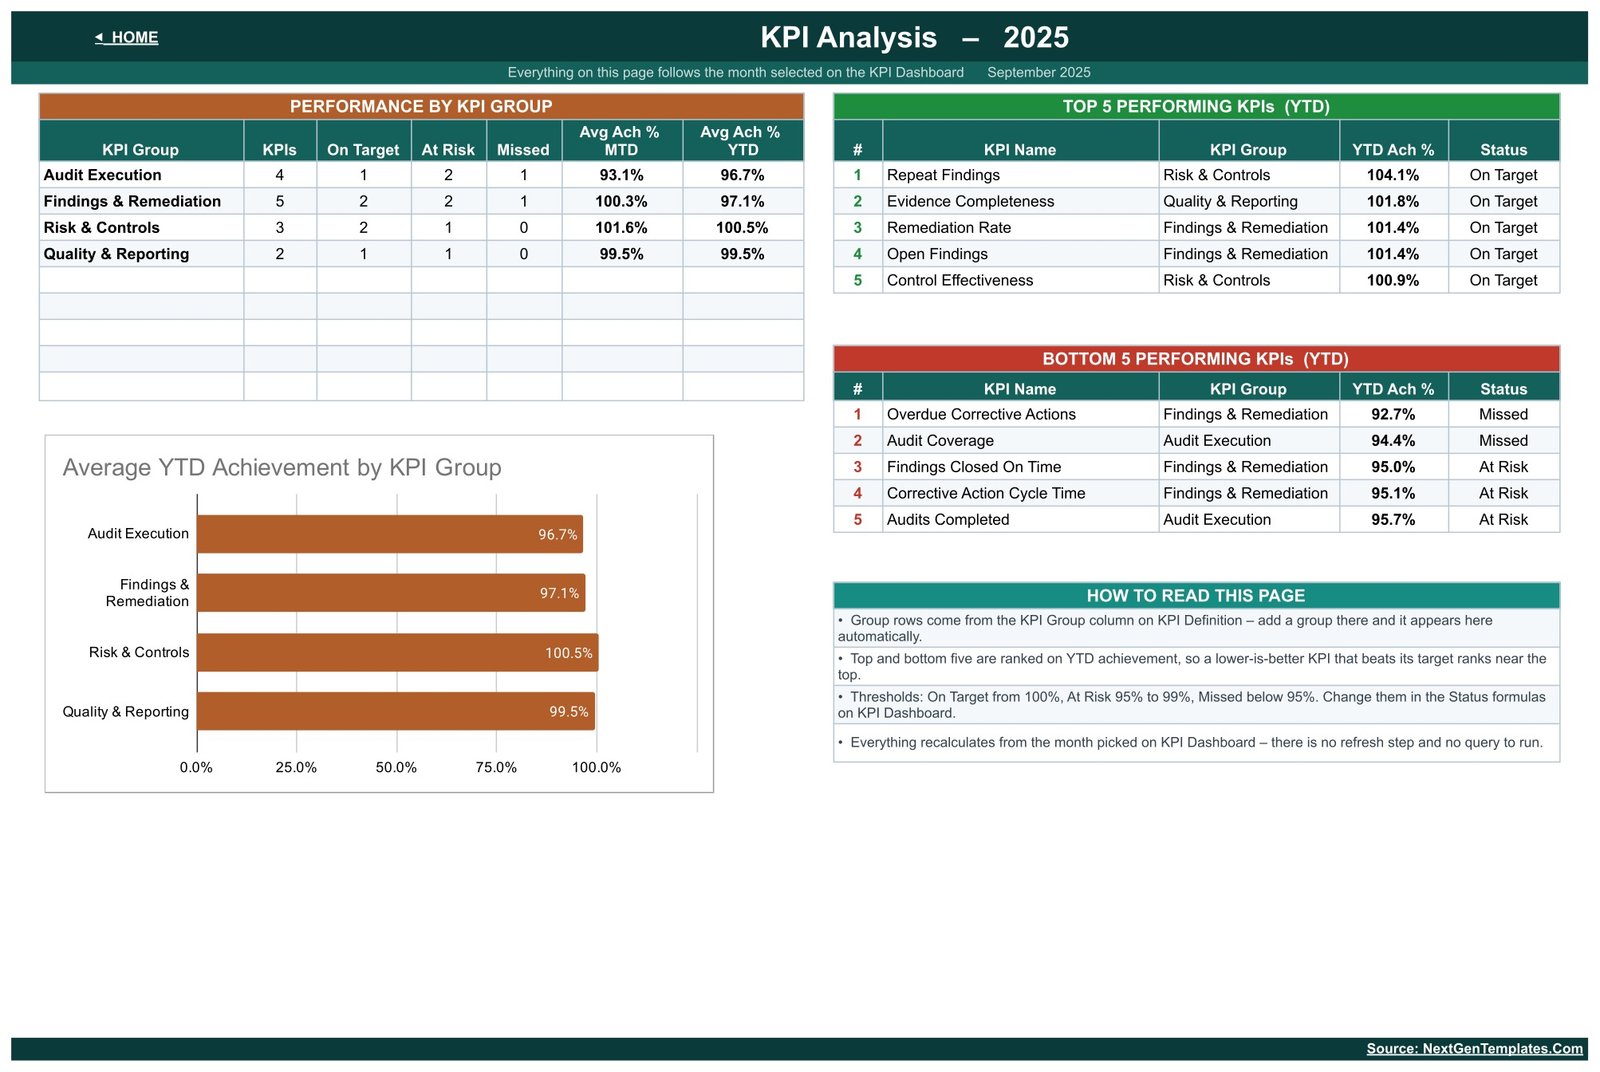
Performance by KPI Group lists each group with its KPI count, On Target / At Risk / Missed counts and average MTD and YTD achievement. Beside it sit Top 5 and Bottom 5 Performing KPIs, both ranked on YTD achievement, and an Average YTD Achievement by KPI Group bar chart. A How To Read This Page panel explains the ranking, the thresholds and the fact that group rows come from the KPI Definition sheet – add a group there and it appears here on its own.
KPI Input – Actual, Target and PY
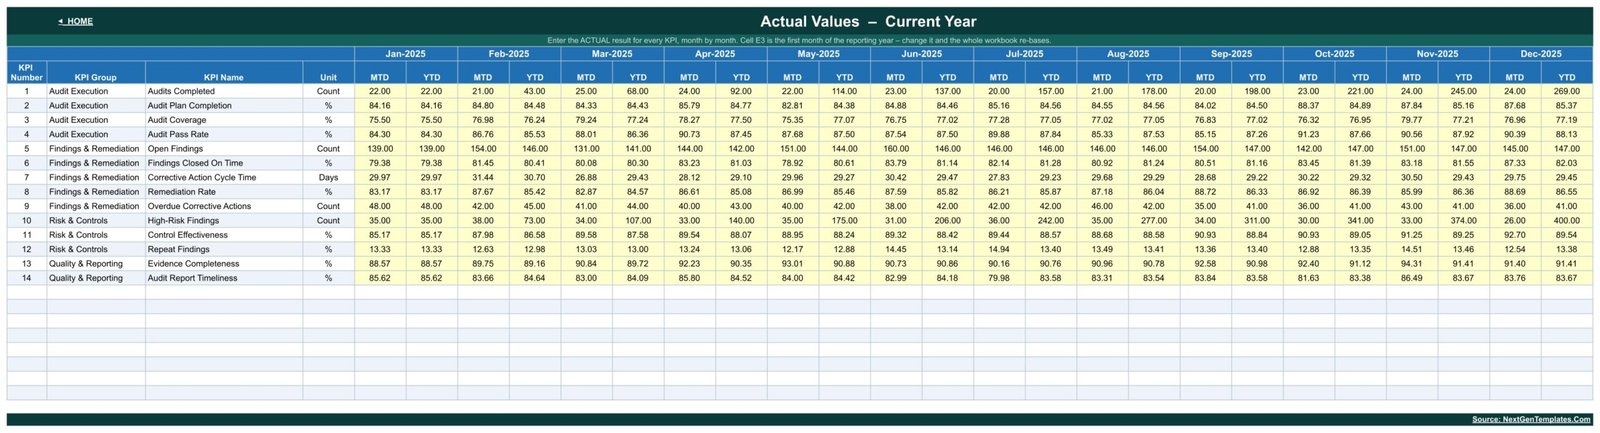
Three identical grids: one row per KPI, twelve month columns, MTD and YTD side by side, and only the yellow cells to fill. Cell E3 sets the first month of the reporting year, so an April-to-March or July-to-June year is a one-cell change rather than a rebuild.
KPI Definition
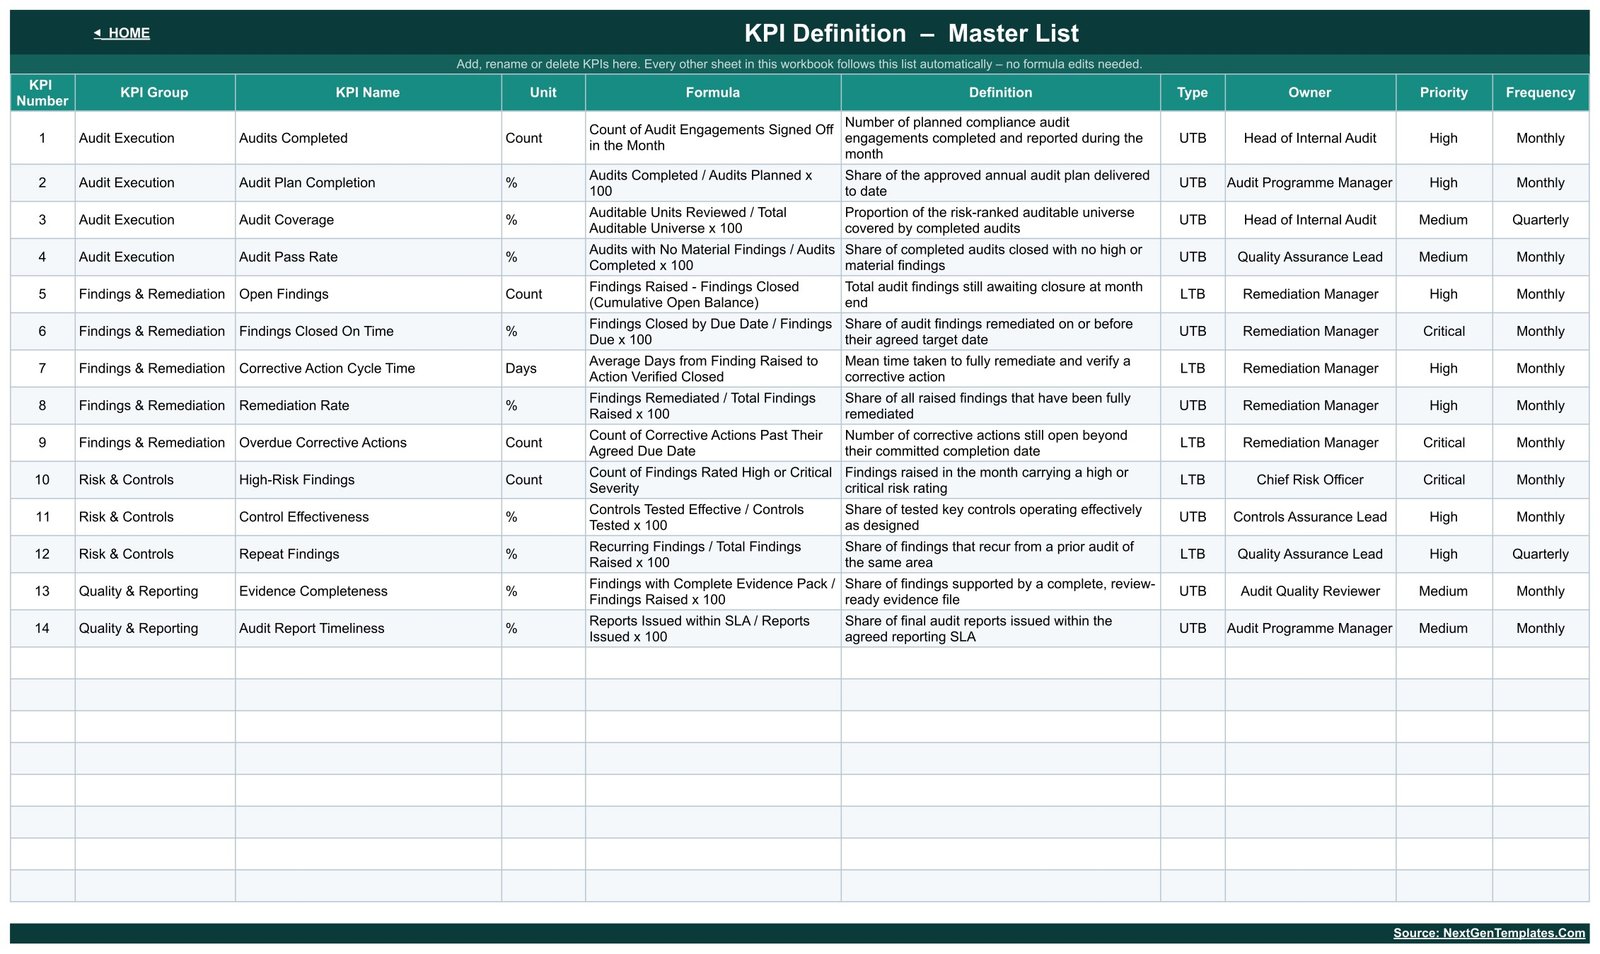
The master list, and the sheet that makes the workbook maintainable. Every KPI has a formula in words (“Findings Closed by Due Date / Findings Due x 100”), a one-line definition, a unit, a type, an owner (Head of Internal Audit, Audit Programme Manager, Remediation Manager, Chief Risk Officer, Quality Assurance Lead, Controls Assurance Lead, Audit Quality Reviewer), a priority and a reporting frequency. The person who inherits this file in eighteen months can work out what every number means without asking anyone.
Compliance Audit KPI Dashboard vs. Excel vs. Paid GRC Software – Feature Comparison
| This template (Google Sheets) | Excel KPI dashboard | Paid GRC / audit software | |
|---|---|---|---|
| Cost | 8.99 one time | 14.99 one time | 3,000 – 30,000+ per year |
| Platform | Google Sheets, any browser | Microsoft Excel, desktop | Vendor-hosted web application |
| Setup time | Make a copy and type your numbers – under an hour | Download, enable editing, type your numbers | Weeks of implementation |
| Real-time team collaboration | Yes, native | Only via OneDrive co-authoring | Yes, with roles |
| Mobile access | Google Sheets mobile app | Excel mobile app | Vendor mobile app |
| Customizable KPIs | Yes – edit the KPI Definition sheet | Yes | Configurable, sometimes chargeable |
| Share with a link | Yes | No | Yes, inside the platform |
| Year-1 cost at 5 users | 8.99 total | 14.99 total | 15,000 – 150,000+ |
| Stores audit evidence and workpapers | No | No | Yes |
| Routes and assigns corrective actions | No – owners are named text, not workflow | No | Yes |
| Produces a compliance certificate | No | No | No – certification comes from an accredited body |
Who Should Use This Template
It suits internal audit and compliance teams who already run their audits somewhere else – a case management tool, a shared drive, a ticketing system – and want a clean monthly KPI page on top of it. It suits a head of internal audit who has to put one readable slide in front of an audit committee. It suits a quality or assurance lead watching control effectiveness and repeat findings over twelve months rather than one. And it suits any team that cannot justify a GRC licence for what is, in the end, fourteen numbers a month.
It does not suit you if you need the file to hold evidence packs, manage engagements, generate audit reports or notify action owners – none of that is here, and pretending otherwise would waste your money. It does not suit you if you expect automatic feeds from a GRC or ERP system; there is no connector and every figure is typed or pasted. And it does not suit anyone looking for a template that will make an organisation compliant, because no template can do that.
Real-World Use Cases
Priya, Head of Internal Audit, mid-size manufacturer. She reports monthly to the CFO and quarterly to the audit committee. Audits Completed, Audit Plan Completion and Audit Coverage go straight onto her pack. The Bottom 5 table on the KPI Analysis page tells her which two KPIs she will be questioned about before anybody questions her – in the sample year those are Overdue Corrective Actions at 92.7% and Audit Coverage at 94.4%.
Daniel, Remediation Manager, financial services. He owns five of the fourteen KPIs, and four of them are lower-the-better. Because the achievement maths already flips for LTB, his review is about direction rather than about arguing over which way a percentage points.
Meera, Quality Assurance Lead, hospital group. She keeps the KPI Trend page on Repeat Findings. One month of repeat findings tells her nothing; twelve months with a target line and a prior-year line tells her whether the corrective actions are actually sticking.
Advantages of the Compliance Audit KPI Dashboard in Google Sheets
- It is finished this afternoon. Make a copy, clear the sample data, type your numbers. There is no implementation project.
- It is fully editable. The KPI Definition sheet is the master list, so swapping our fourteen KPIs for your own is a supported operation rather than a hack.
- It is honest about direction. UTB and LTB are first-class concepts, which is unusual in a spreadsheet template and essential in audit.
- It is transparent. Every number is a visible formula over cells you can see. Nothing is hidden in a macro or a vendor black box.
- It is cheap enough to trial. At 8.99 there is no procurement cycle attached to trying it for a quarter.
- It is shareable read-only. The audit committee gets view access; the team gets edit access; you control both.
Opportunities for Improvement
Being straight about the limits: the workbook holds twelve months of a single reporting year, so a three-year trend means keeping copies or extending the input sheets yourself. There is no drill-down from a KPI to the individual findings behind it – by design, but worth knowing. Data entry is manual, and manual entry is where errors come from, so a monthly reconciliation against your source system is worth building into the routine. The owner column is text, not workflow: naming the Remediation Manager on a row does not notify them. And the sample figures are invented illustration, not benchmark data – they show the file working, and nothing more.
Best Practices
Fix the definitions before you fix the numbers. Most arguments about a KPI dashboard turn out to be arguments about what the KPI means. Fill in the KPI Definition sheet properly, get it agreed once, and later reviews are about performance instead of about arithmetic.
Set targets for the whole year up front. Targets typed retrospectively stop being targets. Enter all twelve months on KPI Input – Target at the start of the year and leave them alone.
Enter prior-year figures if you have them. The vs PY columns and the prior-year lines on both trend charts are the difference between a snapshot and a direction.
Agree the thresholds with whoever reads the report. 100 / 95 / below-95 is a sensible default, not a rule. If your audit committee treats 98% as a miss, change the Status formulas and say so on the page.
Protect the calculated sheets. Leave the three input sheets open for editing and protect the KPI Dashboard, KPI Trend and KPI Analysis pages so a stray paste cannot break a formula.
Keep it beside your evidence, not instead of it. The dashboard reports the score. Your workpapers, evidence files and action log stay wherever they already live.
Explore Relevant Templates
- Compliance Audit KPI Dashboard in Excel – the same subject as an Excel workbook, for teams whose committee pack is not browser-based.
- Compliance Audit Tracker in Google Sheets – a record-level tracker for individual audits, findings and corrective actions. That one lists the items; this one measures the function. They pair well.
- Audit & Internal Controls Dashboard in Google Sheets – the analytical family, with slicers and charts over a data table instead of a month-picker scorecard.
- Corporate Governance KPI Dashboard in Google Sheets – the same scorecard structure for board and governance measures.
- Workplace Safety KPI Dashboard in Google Sheets – the same structure again for EHS teams.
If you would like to build KPI reporting like this yourself, the Excel Pivot Tables & Dashboards course on NextGenTemplates Academy teaches it step by step with practice files.
Get the Compliance Audit KPI Dashboard in Google Sheets
Frequently Asked Questions
Does this template make my organisation compliant, or certify anything?
No. It displays KPI numbers that you enter. It certifies nothing, it is not evidence of compliance with any standard or regulation, and it is not legal or regulatory advice. Certification comes from an accredited body assessing your organisation.
Is this an audit management system?
No. It stores no evidence, holds no workpapers, manages no engagements and routes no corrective actions. It summarises the results of whatever you already use to run audits.
Is it mapped to a specific audit or compliance framework?
It is deliberately standard-neutral. The fourteen KPIs are common audit-function measures rather than a mapping to any named framework. If yours requires particular metrics, replace ours on the KPI Definition sheet.
Do I need add-ons, Apps Script or macros?
None. Every calculation is a native Google Sheets formula, so there is nothing to install and nothing to authorise.
Can I change the KPIs, the groups and the reporting year?
Yes to all three. KPIs and groups come from the KPI Definition sheet; the reporting year starts from cell E3 on the input sheets.
Will it import numbers from my GRC or ERP system?
No. There is no connector. You type the monthly figures or paste them from an export.
What is the sample data?
Twelve months of illustrative 2025 figures so every page shows its behaviour before you clear it. It is invented, not benchmark data, and it is not taken from any real organisation.
How is this different from the Google Sheets KPI Scorecard templates?
Different structure, same shelf. The scorecard family uses KPI cards with RAG lights and a comparison-switch dropdown over a single monthly data sheet. This dashboard family uses a month picker, a full traffic-light grid, three separate input sheets, a KPI Trend page and a KPI Analysis page.
About the Author
Built by PK – Microsoft Certified Professional with 15+ years of Excel, Google Sheets, and Power BI experience. Founder of NextGenTemplates, reaching 300K+ subscribers across YouTube channels. Every template is hand-built and tested before release.
Conclusion
The Compliance Audit KPI Dashboard in Google Sheets does one job and does it properly: it turns a month of audit-function figures into a fourteen-line scorecard with targets, prior-year comparison and traffic lights, with a trend page and a group analysis sitting behind it. It will not run an audit, store a working paper, chase an action owner or make anybody compliant with anything – and it does not claim to. What it will do is make the monthly audit review a fifteen-minute conversation about direction rather than an afternoon of spreadsheet archaeology.
Get the Compliance Audit KPI Dashboard in Google Sheets and make your own copy today.