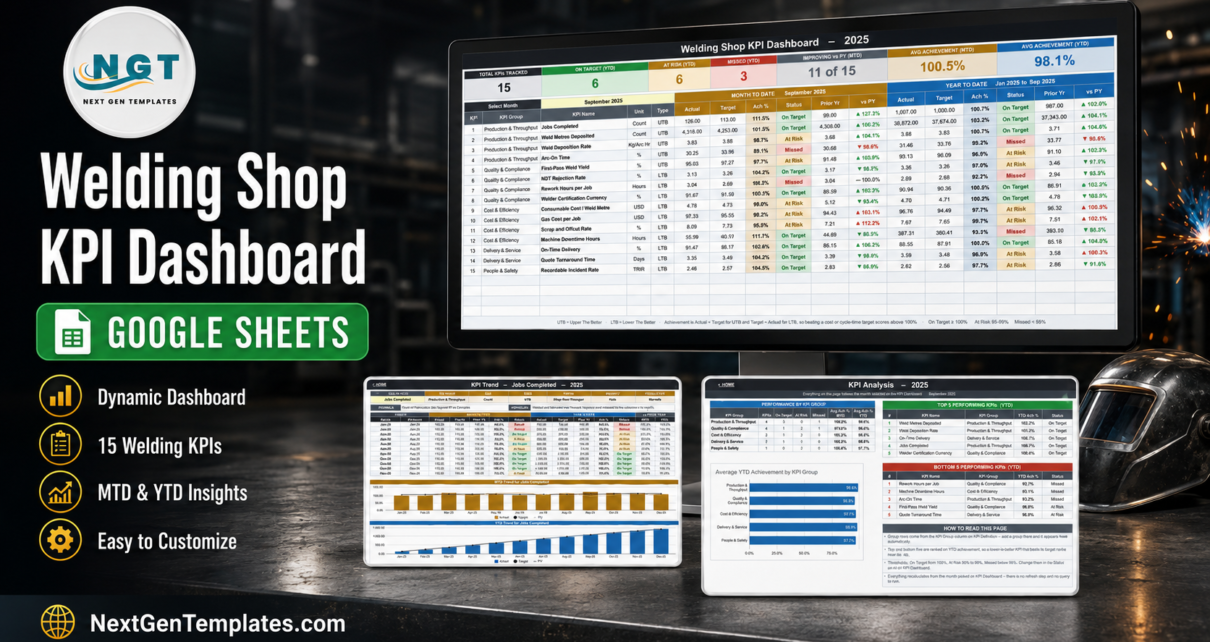
The Welding Shop KPI Dashboard in Google Sheets tracks 15 fabrication KPIs across 5 KPI groups on 11 tabs. Every row carries month-to-date and year-to-date actual, target, achievement percentage, traffic-light status, prior-year value and a year-on-year arrow — 7 of the KPIs are scored upper-the-better and 8 lower-the-better. Every number in the file is a plain worksheet formula: no add-on, no Apps Script, no query to refresh.
Most welding and fabrication job shops already know their numbers. Arc hours sit in one place, NDT results in another, gas invoices in a third, and the monthly management meeting turns into arithmetic instead of decisions. This template does not collect data for you. It gives you one place to score it, so that a month where scrap crept up and arc-on time slipped is visible in the same glance as the month where on-time delivery finally beat target.
Key Features of the Welding Shop KPI Dashboard in Google Sheets
- 15 welding KPIs in 5 groups. Production & Throughput has 4, Quality & Compliance 4, Cost & Efficiency 4, Delivery & Service 2 and People & Safety 1.
- The full metric list is Jobs Completed, Weld Metres Deposited, Weld Deposition Rate, Arc-On Time, First-Pass Weld Yield, NDT Rejection Rate, Rework Hours per Job, Welder Certification Currency, Consumable Cost / Weld Metre, Gas Cost per Job, Scrap and Offcut Rate, Machine Downtime Hours, On-Time Delivery, Quote Turnaround Time and Recordable Incident Rate.
- A single month picker. Cell D6 on the KPI Dashboard tab is a dropdown of the twelve months of your reporting year. Change it and the scorecard, the seven summary cards and the whole KPI Analysis page recalculate instantly.
- Direction-aware achievement. Achievement is Actual ÷ Target for an upper-the-better KPI and Target ÷ Actual for a lower-the-better one, so beating a cost, scrap or downtime target scores above 100% just as beating an output target does.
- Editable traffic lights. On Target from 100%, At Risk between 95% and 99%, Missed below 95%. The thresholds live in the Status formulas on the KPI Dashboard tab.
- Units that suit a fab shop — Count, Kg/Arc Hr, %, Hours, USD, Days and TRIR, set per KPI on the definition sheet.
- Owner, priority and frequency on every KPI: Shop Floor Manager, Welding Engineer, Production Supervisor, Quality Manager, NDT Coordinator, Purchasing Lead, Materials Controller, Maintenance Lead, Planning Manager, Estimating Lead and EHS Officer are the owners in the sample file.
- Room to grow. The sheets are wired for 22 KPI rows and 15 are filled, so the spare rows are already live and a new KPI needs no formula work.
Sheets Explanation
The workbook has 11 tabs in total: Home, KPI Dashboard, KPI Trend, KPI Analysis, KPI Input – Actual, KPI Input – Target, KPI Input – PY, KPI Definition, Support, Read Me and Get More Templates. Six are shown below; Support holds the helper calculations behind the charts, and Read Me documents how the file is wired.
Home
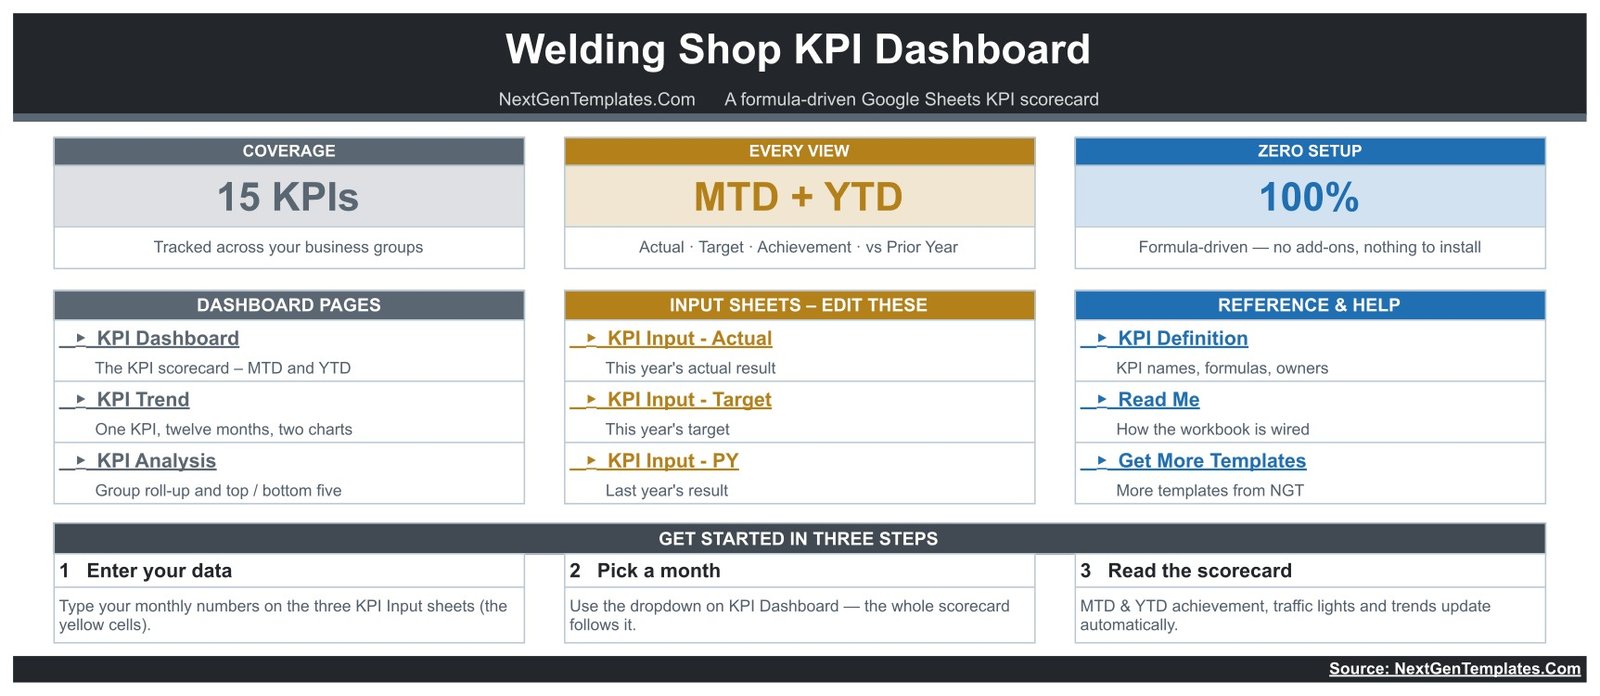
The landing tab. Three headline cards read 15 KPIs, MTD + YTD and 100% formula-driven, with linked shortcuts to the three dashboard pages, the three input sheets and the reference tabs, plus a three-step start guide: enter your data, pick a month, read the scorecard.
KPI Dashboard
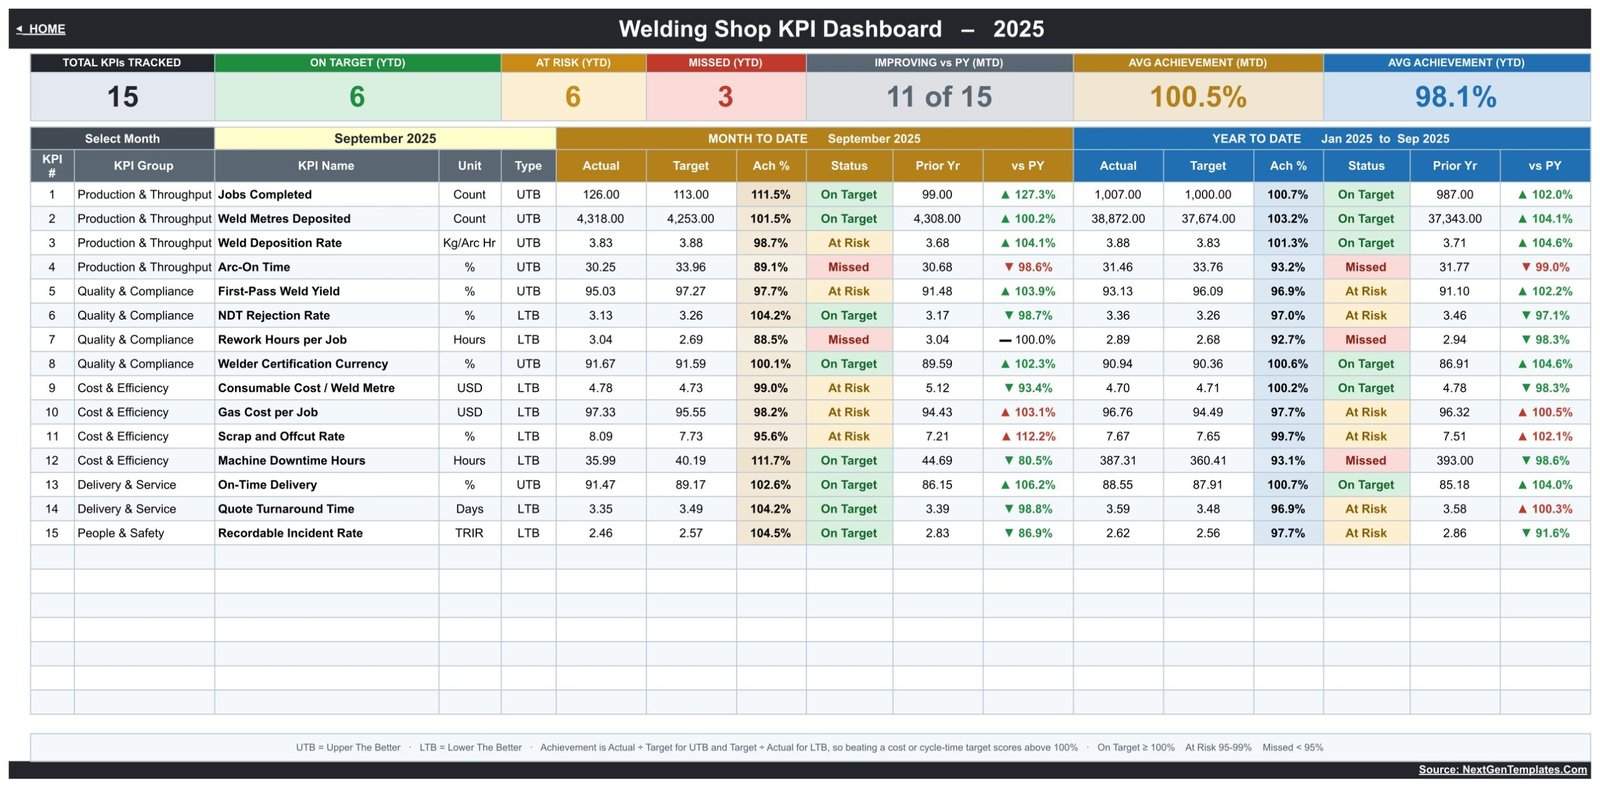
The scorecard itself. Seven summary cards run across the top — Total KPIs Tracked, On Target (YTD), At Risk (YTD), Missed (YTD), Improving vs PY (MTD), Avg Achievement (MTD) and Avg Achievement (YTD). Under them, one row per KPI shows the group, unit and UTB/LTB type, then a Month To Date block and a Year To Date block, each with actual, target, achievement, status, prior year and a vs-PY arrow.
KPI Trend
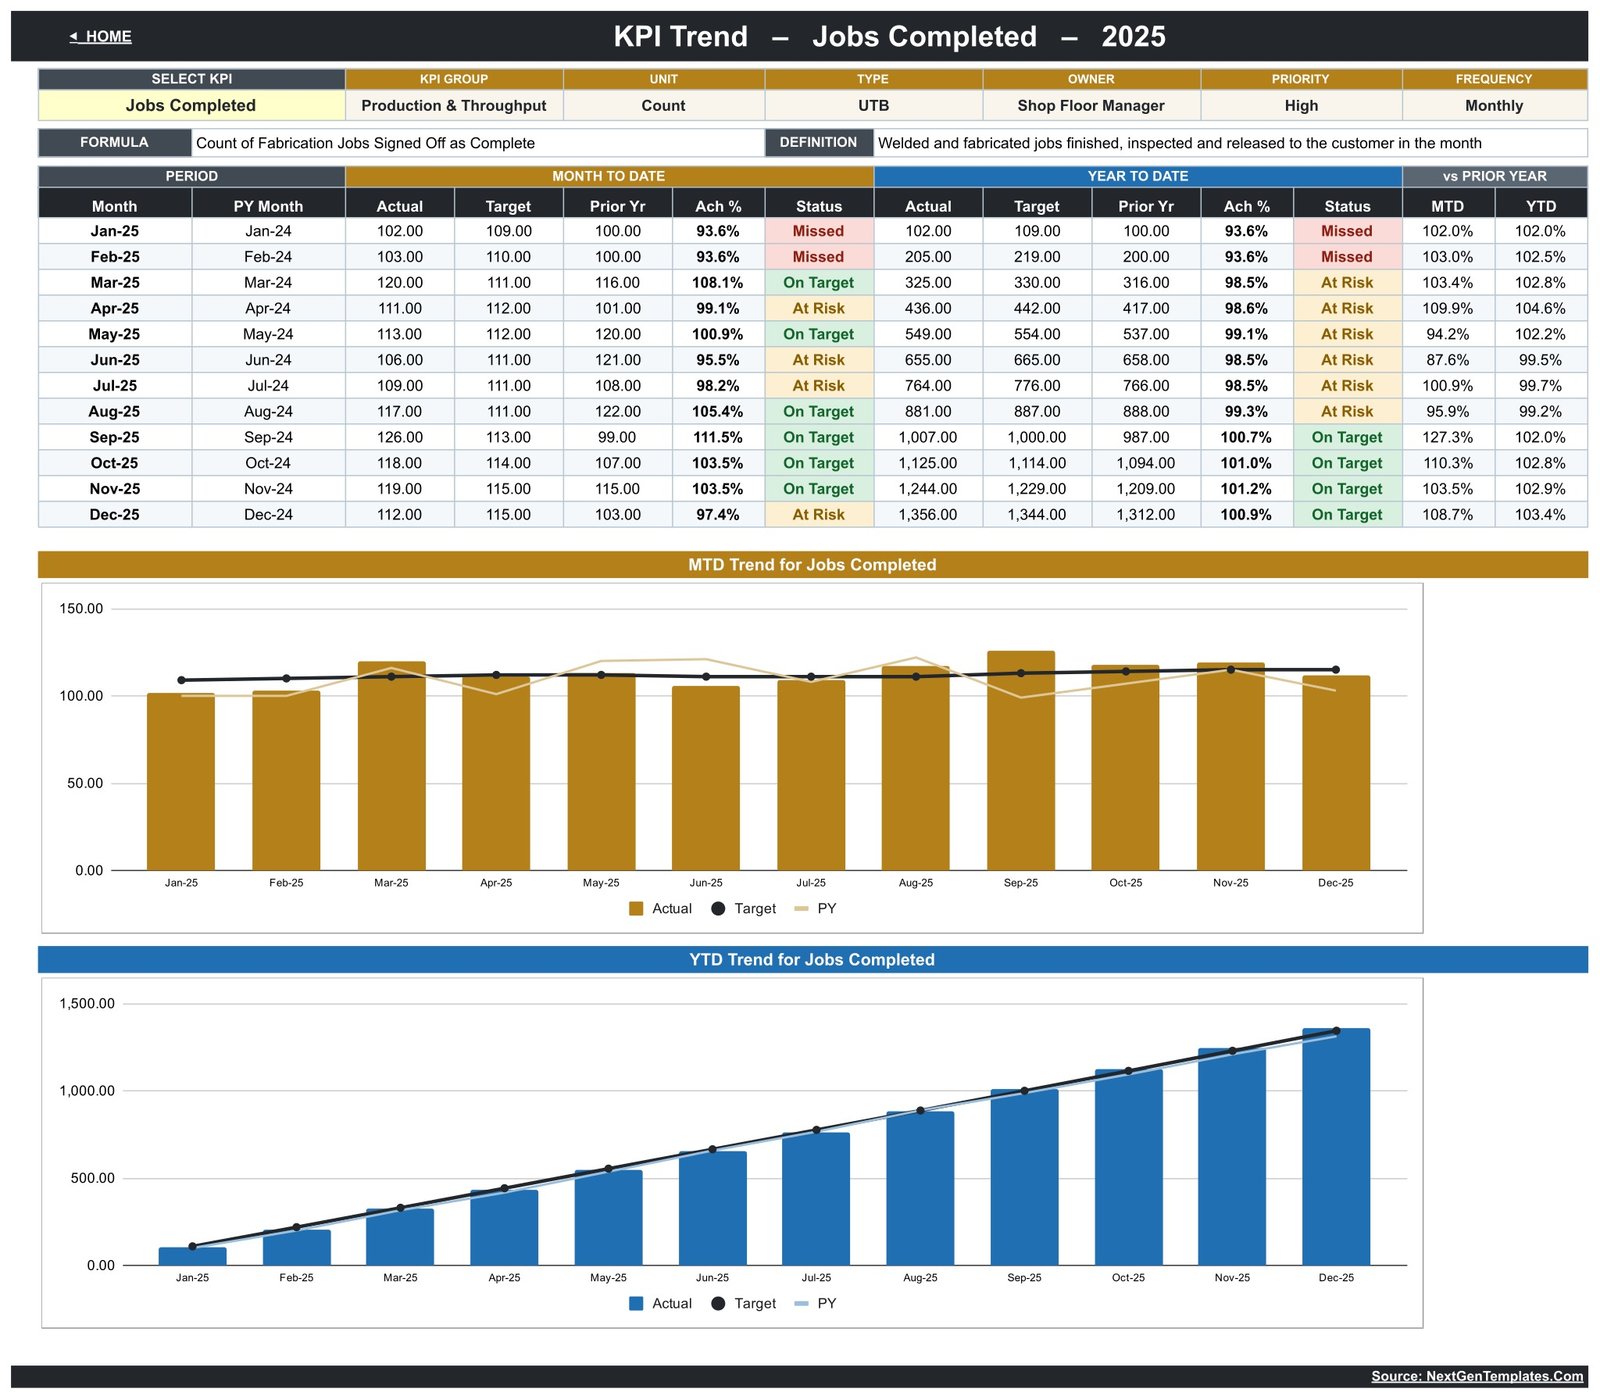
One KPI at a time, chosen from a dropdown of every name on the definition sheet. An attribute strip shows KPI Group, Unit, Type, Owner, Priority and Frequency, with the metric’s formula and plain-English definition beneath it. Then a twelve-month table gives MTD and YTD actual, target, prior year, achievement and status, followed by two charts — MTD Trend and YTD Trend — each plotting actual columns against a target line and a prior-year line.
KPI Analysis
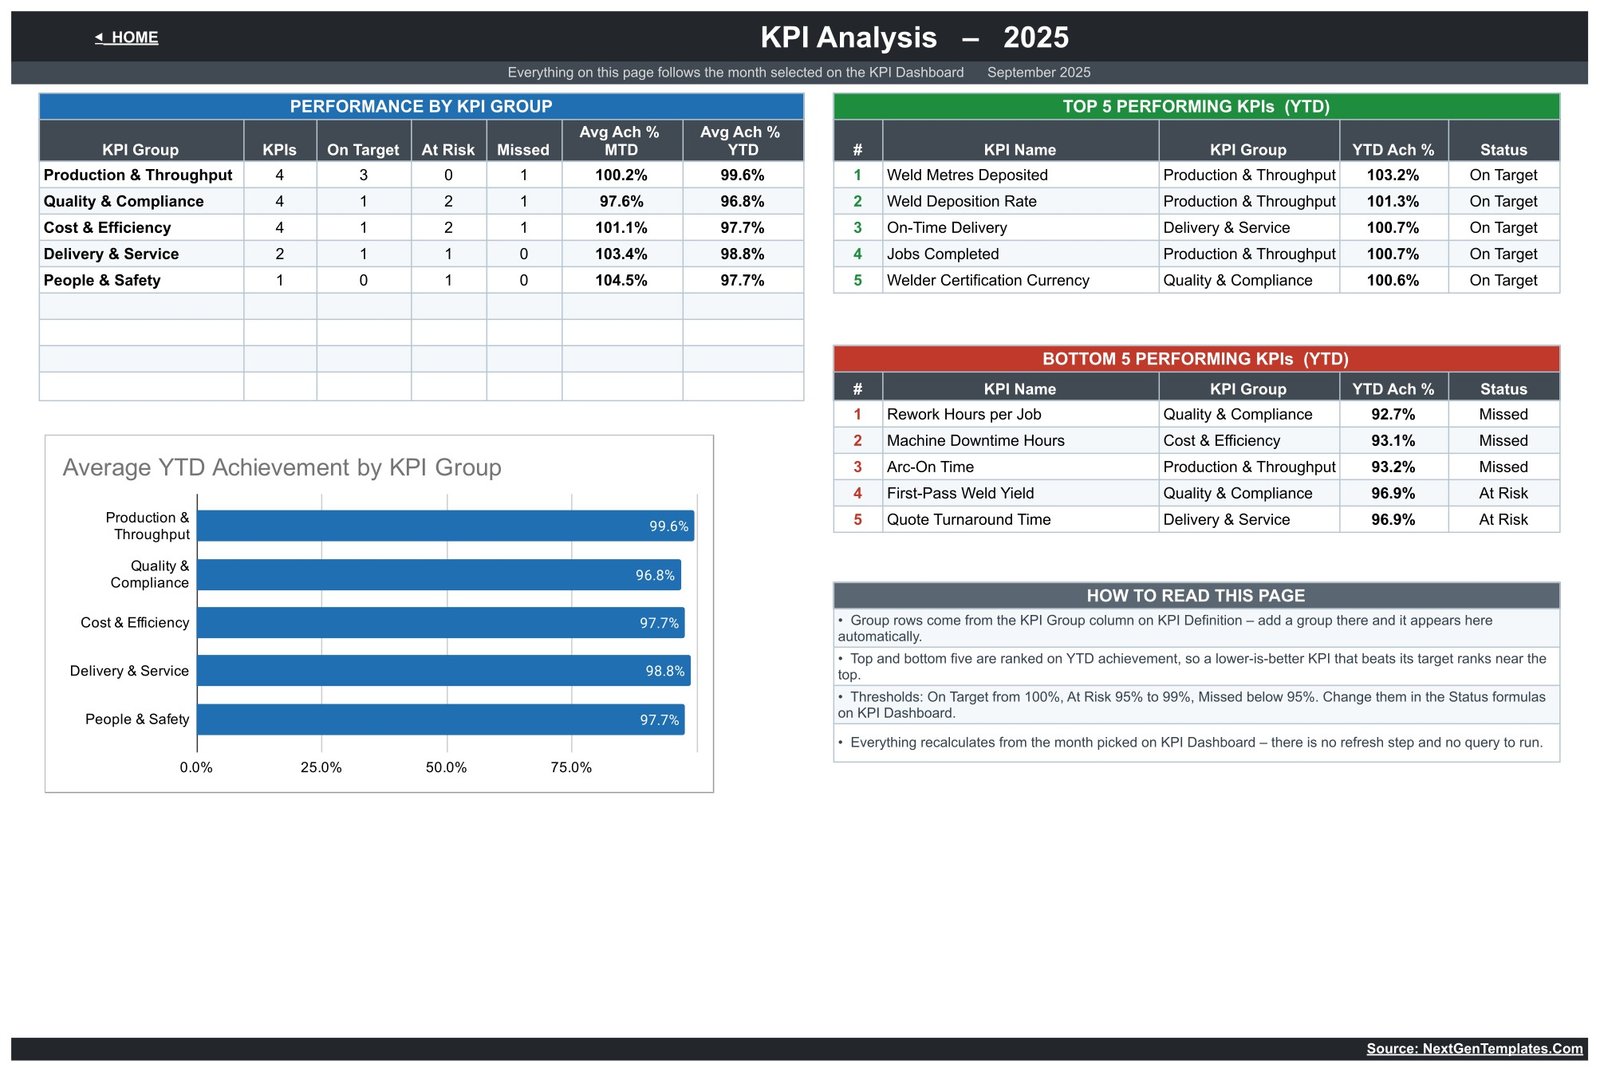
The roll-up. A Performance by KPI Group table counts On Target, At Risk and Missed KPIs in each group and averages their MTD and YTD achievement, sitting next to an Average YTD Achievement by KPI Group chart. Top 5 and Bottom 5 Performing KPIs tables rank all fifteen metrics on year-to-date achievement, and because ranking uses achievement rather than raw value, a lower-is-better KPI that beats its target ranks near the top where it belongs.
KPI Input – Actual (and Target, and PY)
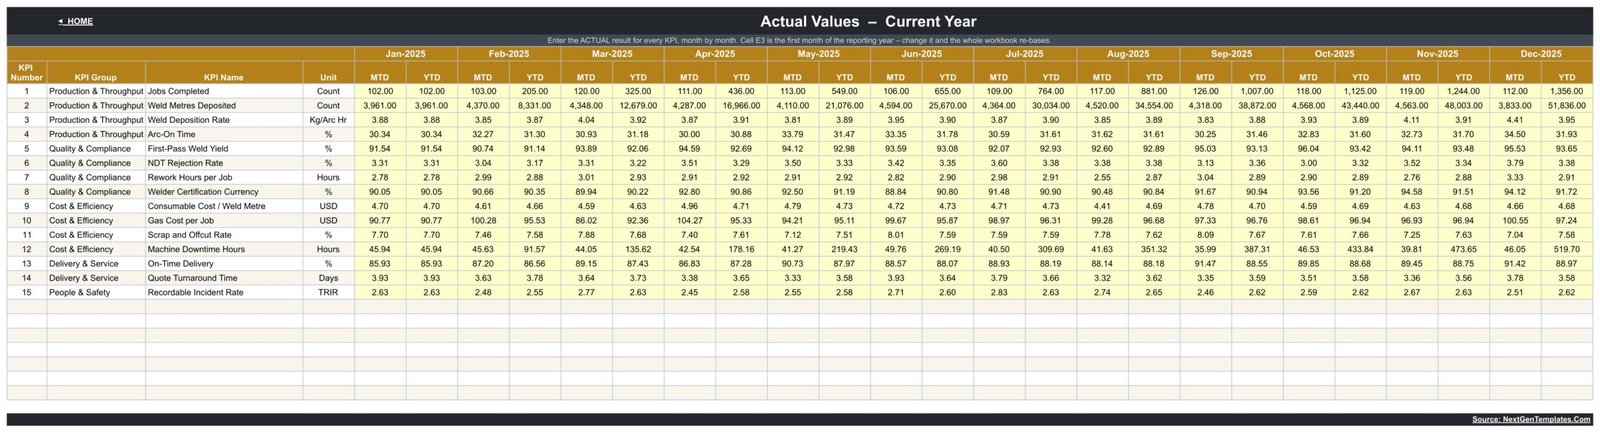
Your data lives here, in yellow editable cells. Twelve month blocks each hold an MTD and a YTD column for all 15 KPIs. Cell E3 is the first month of the reporting year — change it and the Target sheet, the Prior Year sheet, the month dropdown and every sheet title re-base automatically. KPI Input – Target and KPI Input – PY are identical sheets holding this year’s target and last year’s result.
KPI Definition
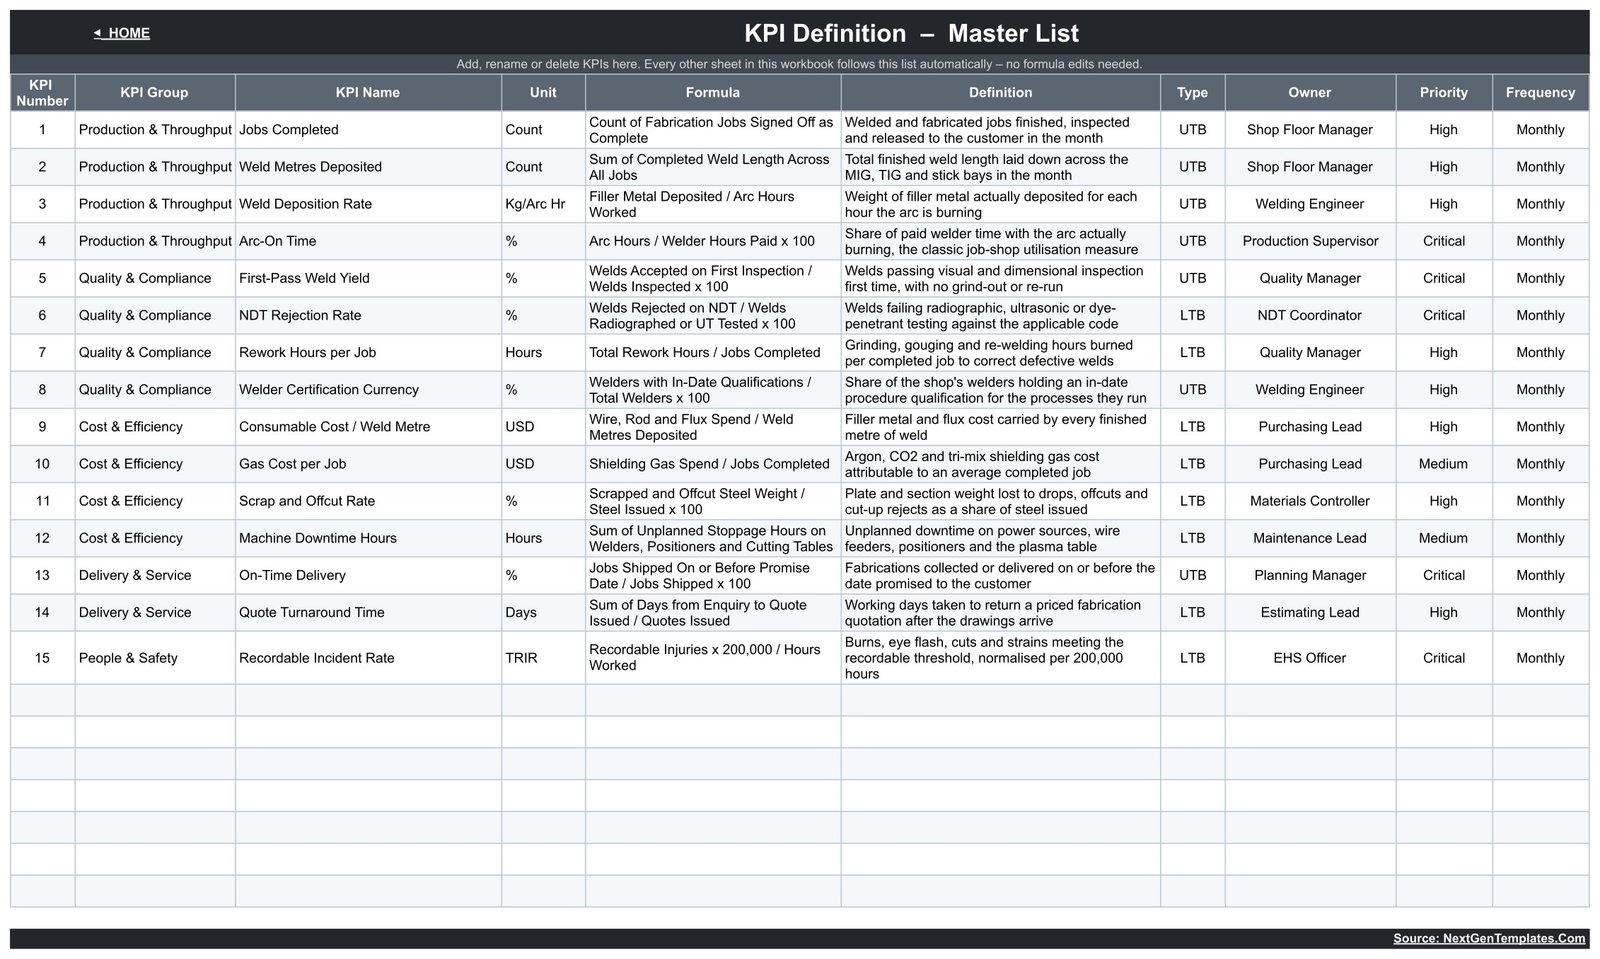
The master list that every other tab follows. Ten columns hold KPI Number, KPI Group, KPI Name, Unit, Formula, Definition, Type, Owner, Priority and Frequency. Arc-On Time, for instance, is arc hours divided by welder hours paid times 100, owned by the Production Supervisor at Critical priority. Rename a KPI here and it changes everywhere; clear a row and the dashboard row goes blank and the summary cards recount themselves.
Welding Shop KPI Dashboard in Google Sheets vs. Microsoft Excel Dashboard vs. Paid Shop-Floor SaaS — Feature Comparison
| Feature | Welding Shop KPI Dashboard in Google Sheets | Microsoft Excel Dashboard | Paid shop-floor SaaS (Tulip / MachineMetrics / Fulcrum) |
|---|---|---|---|
| Cost | $8.99 one-time ✅ | $15–30 one-time | $40–150 / user / month |
| Platform | Google Sheets in any browser | Microsoft Excel desktop | Vendor cloud plus machine connectors |
| Setup time | Under 10 minutes ✅ | Under 15 minutes | Weeks: hardware, integration, training |
| Real-time team collaboration | Yes, native multi-user editing ✅ | Only via OneDrive co-authoring | Yes |
| Mobile access | Google Sheets app, no extra licence ✅ | Excel mobile app | Vendor app |
| Customisable KPIs | Edit one sheet; 22 rows wired, 15 used ✅ | Editable, needs formula edits | Vendor-defined metric library |
| Share with a link | Yes, standard Drive sharing ✅ | File attachment or OneDrive link | Seat required per viewer |
| Automatic machine data capture | No — you type monthly figures | No | Yes ✅ |
| Year-1 cost at 5 users | $8.99 total ✅ | $15–30 total | $2,400–9,000 |
For a fabrication shop that wants a monthly KPI review its foreman and its owner can both open, without wiring sensors to every power source, the Welding Shop KPI Dashboard in Google Sheets sits in the sweet spot.
Who Should Use This Template
Perfect for:
- Owners and general managers of welding and metal-fabrication job shops with roughly 3–60 welders who report monthly rather than by the shift
- Production supervisors and welding engineers who already have arc hours, weld metres and NDT results and need one place to score them against target
- Quality managers who want first-pass weld yield, NDT rejection rate and rework hours read against a target rather than as raw counts
- Anyone building a monthly management pack who wants MTD, YTD and prior year on one screen
Not a fit if:
- You need job-level or weld-level records. There is no job log, no weld map, no WPS or PQR register and no welder qualification database here — you enter one MTD and one YTD figure per KPI per month
- You need safety recordkeeping. Recordable Incident Rate is a single TRIR figure you type in. This is not a safety management or injury-recordkeeping system and it produces no OSHA 300 or 300A forms and no case records
- You want live machine monitoring, automatic arc-time capture or ERP integration — nothing in this file connects to a power source, a plasma table or your ERP
- You need several years of history in one file; the workbook reports one reporting year at a time against the prior year
Real-World Use Cases
Dan owns a 14-welder structural fabrication shop. On the first Monday of each month he types his figures into the three input sheets, sets the month picker and walks his foreman through the scorecard. Arc-On Time sitting on Missed two months running is what persuaded him to move the tacking bench, and he pays nothing per user to show the file to anyone.
Priya is the quality manager at a pressure-vessel fabricator. She works mostly on the KPI Trend page, flipping between NDT Rejection Rate and First-Pass Weld Yield to see whether a bad month was a blip or a slope, then uses the Bottom 5 Performing KPIs table to choose the two metrics that get attention that quarter.
Marco estimates and plans for a job shop of 30. Quote Turnaround Time and On-Time Delivery are his two rows, and because both sit in the Delivery & Service group he reads that group’s average achievement in a single cell before the Monday planning meeting.
Advantages of the Welding Shop KPI Dashboard in Google Sheets
It costs $8.99 once instead of a monthly seat. Five people looking at a shop-floor SaaS tool for a year runs $2,400 to $9,000. This is one payment, and everyone with the Drive link can read it.
Nothing is hidden. Every figure is a worksheet formula you can click into and trace. There is no add-on to authorise, no script to approve and no cached query that can silently go stale — the file simply opens and is already correct.
Lower-is-better metrics are scored honestly. Plenty of homemade KPI packs quietly treat every metric as bigger-is-better, which makes rising scrap and rising downtime look like progress. Here the direction is set per KPI, and the vs-PY arrow colours itself by whether that direction is good, so a falling consumable cost shows a green down-arrow.
The sample data behaves. Volumes accumulate through the year while rates and per-unit costs stay running averages, so no percentage in the file climbs to 1,100% by December.
Opportunities for Improvement
Being straight about the limits: this is a reporting layer, not a data-capture system. You still have to produce the monthly numbers somewhere else and type them in, and for a shop that wants weld-by-weld traceability that is a real gap.
Year-to-date is entered rather than calculated. That is a deliberate design choice — it lets you define your own YTD and keeps rates as averages instead of nonsense sums — but it does mean two numbers per KPI per month rather than one.
The file covers one reporting year plus the prior year. Multi-year trending means duplicating the sheet per year. And the People & Safety group holds a single KPI, so its group average on the analysis page is really just that one metric; a shop wanting a fuller safety picture should add near-misses or lost-time cases to the spare rows on the definition sheet.
Best Practices
- Edit the KPI Definition tab first, before typing any numbers. Names, units and UTB/LTB direction flow everywhere from that one sheet.
- Agree who owns each KPI and fill the Owner column honestly — a metric with no name against it never improves.
- Set targets for all twelve months up front on KPI Input – Target, not month by month, so the year-to-date comparison is meaningful from January.
- Keep the sample year in a spare copy the first time you use it, so you have a working reference while you swap in your own figures.
- Move the At Risk and Missed thresholds to match how your business actually talks about performance rather than accepting 95% because it was there.
- If you are new to shared sheets, review Google’s own guidance on spreadsheet functions before rewriting any formula.
Explore Relevant Templates
The same 15-KPI dashboard is published for two other tools: the Welding Shop KPI Dashboard in Excel and the Welding Shop KPI Dashboard in Power BI. Pick whichever tool your team already opens.
The Welding Shop KPI Scorecard in Google Sheets is a separate template for the same trade with its own layout — related, not a duplicate. Many shops end up owning both.
The same KPI dashboard build exists for other trades: Electrical Contractor, Roofing Contractor, Plumbing Business, Painting Contractor and Flooring Installation. Browse the full Google Sheets template catalogue for the rest.
Frequently Asked Questions
What KPIs does the Welding Shop KPI Dashboard in Google Sheets track?
It tracks 15 KPIs across 5 groups: Jobs Completed, Weld Metres Deposited, Weld Deposition Rate, Arc-On Time, First-Pass Weld Yield, NDT Rejection Rate, Rework Hours per Job, Welder Certification Currency, Consumable Cost / Weld Metre, Gas Cost per Job, Scrap and Offcut Rate, Machine Downtime Hours, On-Time Delivery, Quote Turnaround Time and Recordable Incident Rate.
How long does setup take?
Under 10 minutes. Copy the sheet from the link in the PDF, set the reporting-year start in cell E3 on KPI Input – Actual, type your figures into the three yellow input sheets and pick a month on the KPI Dashboard tab. Nothing needs installing and no add-on is required.
Is the Welding Shop KPI Dashboard in Google Sheets a safety or OSHA recordkeeping system?
No. It carries one safety KPI, Recordable Incident Rate, as a monthly TRIR figure you enter yourself. There is no incident log, no case record and no OSHA 300 or 300A output anywhere in the file, and it is not a substitute for a safety management system.
Can I add or rename KPIs?
Yes. Add, rename or clear a row on the KPI Definition tab and every other sheet follows automatically. The Welding Shop KPI Dashboard in Google Sheets is wired for 22 KPI rows with 15 filled, so seven spare rows are already live and need no formula editing.
How does this compare with paid shop-floor software?
Tools such as Tulip, MachineMetrics and Fulcrum capture machine data automatically and cost roughly $40 to $150 per user per month. The Welding Shop KPI Dashboard in Google Sheets is $8.99 once and expects you to type monthly figures — it reports KPIs rather than collecting them.
Does it work on mobile?
Yes. It is an ordinary Google Sheets file, so the free Google Sheets app on Android and iOS opens it, and anyone you share the Drive link with can read the scorecard without buying a seat or installing anything.
Does it calculate year-to-date automatically?
No, and that is by design. Both MTD and YTD are stored on the input sheets so you keep control of how your year to date is defined. Volumes accumulate through the year while rates and per-unit costs remain running averages.
About the Author
Built by PK — Microsoft Certified Professional with 15+ years of Excel, Google Sheets and Power BI experience. Founder of NextGenTemplates, reaching 300K+ subscribers across YouTube channels. Every template is hand-built and tested before release.
Conclusion
If your fabrication shop already has the numbers and just needs somewhere honest to put them, this is a small, cheap, transparent place to do it. Fifteen KPIs, one month picker, traffic lights you can move, and a trend page for any metric you want to argue about — with no add-on to install and no monthly bill.
👉 Click here to Purchase the Welding Shop KPI Dashboard in Google Sheets
Instant download · One-time payment · No subscription
For step-by-step walkthroughs, visit Youtube.com/@NeoTechNavigators.
Last updated: September 2026


