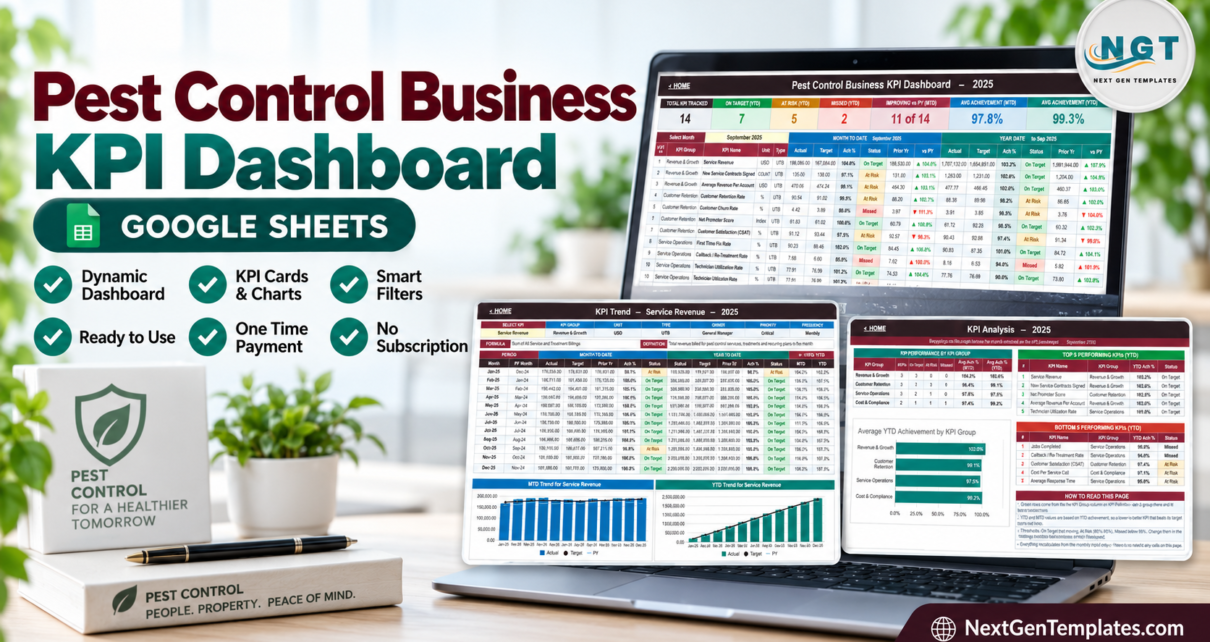
A pest control company can look busy while the numbers tell four different stories: revenue may rise, callbacks may climb, technicians may be underused, and customers may quietly leave. The Pest Control Business KPI Dashboard in Google Sheets brings 14 operating indicators into one monthly and year-to-date view. It covers four groups, three editable input areas, two time horizons, and three performance states. There is no add-on to install and no recurring subscription. The template is intended for management reporting from prepared monthly totals, not for dispatching technicians or proving regulatory compliance.
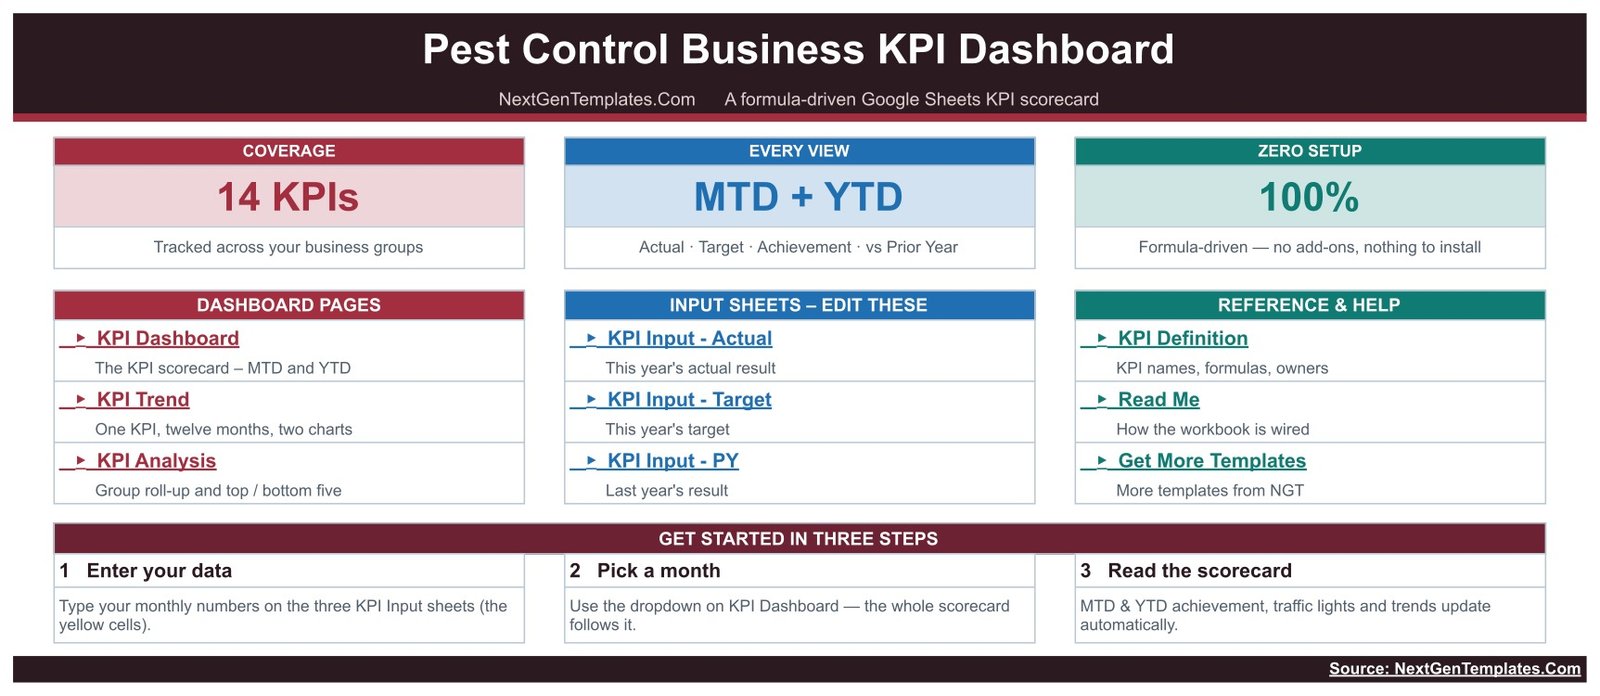
The workbook connects KPI reporting, inputs, definitions, and supporting guidance.
Key Features of Pest Control Business KPI Dashboard in Google Sheets
The template is designed around a practical monthly review cycle. Enter actuals, targets, and prior-year numbers; choose a month; then move between the summary, trend, and analysis pages.
- 14 editable KPI records across Revenue & Growth, Customer Retention, Service Operations, and Cost & Compliance.
- MTD and YTD comparisons for actual, target, achievement, prior year, and variance against prior year.
- On Target, At Risk, and Missed indicators using separate upper-the-better and lower-the-better logic.
- Selected-KPI trend analysis with twelve monthly rows and separate MTD and YTD charts.
- Group roll-up and ranking with average achievement plus the top and bottom five KPIs.
- Definition governance for formula text, plain-language definition, unit, owner, priority, frequency, and direction.
- Browser-based collaboration through normal Google Sheets sharing permissions.
Dashboard Pages Explanation
Overview and navigation
The overview explains the architecture before a manager touches the input cells. It identifies the KPI Dashboard, KPI Trend, and KPI Analysis pages; current-year actual, target, and previous-year input areas; and the KPI Definition, Read Me, and template links. The page also makes the workflow explicit: enter monthly data, select a month, and read the recalculated scorecard.
KPI Dashboard
The main scorecard is the control room. In the demonstration view for September 2025, it shows 14 KPIs, with seven On Target, five At Risk, and two Missed on a YTD basis. Average achievement is shown for both MTD and YTD, along with a count of metrics improving against the prior year. Each row displays group, KPI name, unit, direction, current result, target, achievement, status, prior-year result, and comparison with prior year.
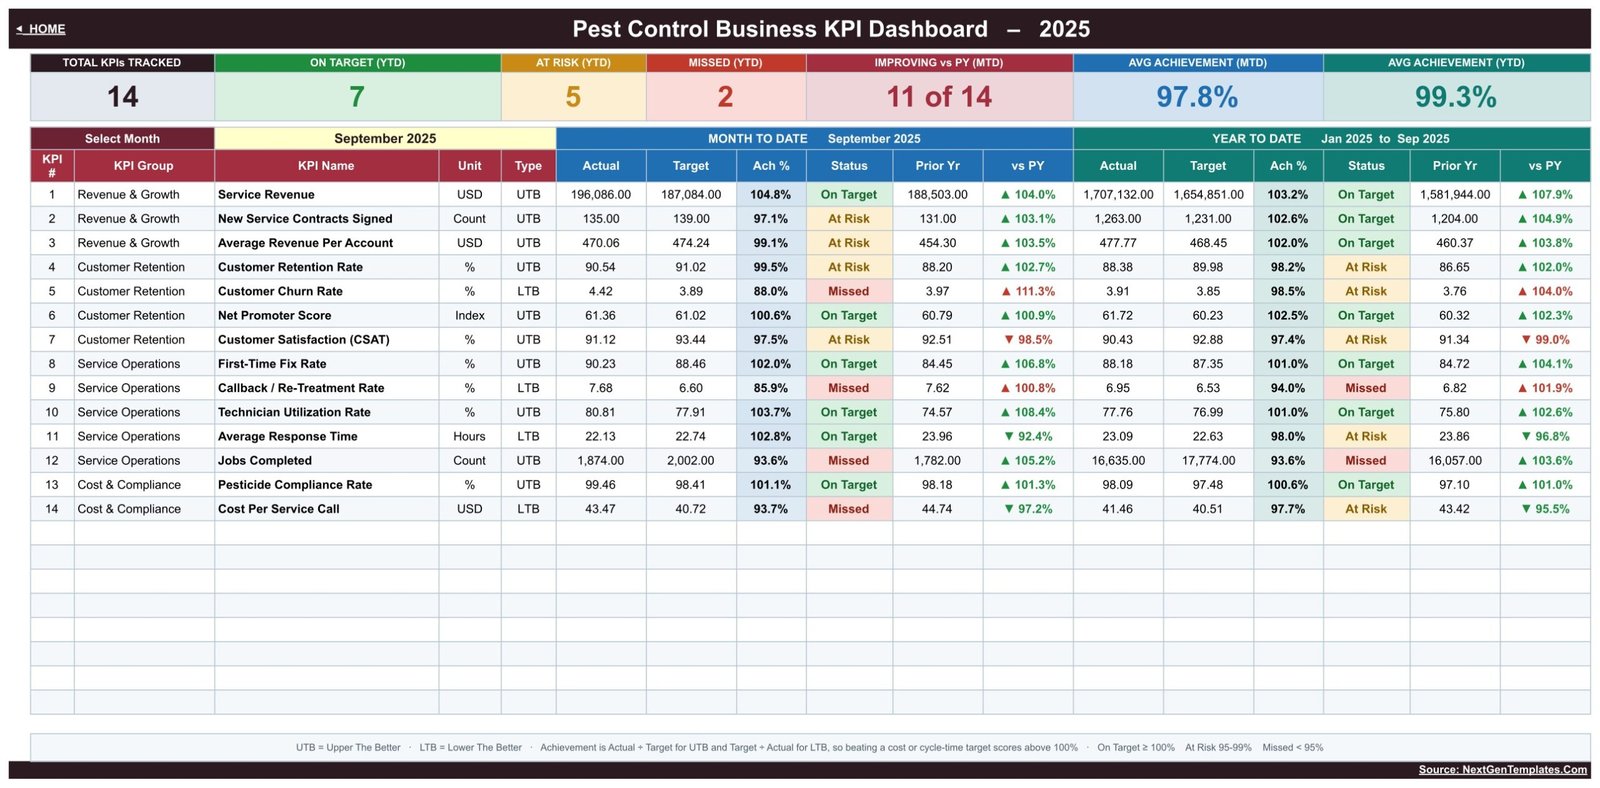
The scorecard separates current performance, target achievement, and prior-year movement.
The ready-made KPI list includes Service Revenue, New Service Contracts Signed, Average Revenue Per Account, Customer Retention Rate, Customer Churn Rate, Net Promoter Score, Customer Satisfaction (CSAT), First-Time Fix Rate, Callback / Re-Treatment Rate, Technician Utilization Rate, Average Response Time, Jobs Completed, Pesticide Compliance Rate, and Cost Per Service Call. Treat these as editable management examples. They do not prescribe targets or legal standards.
KPI Trend
Select a KPI to view its group, unit, type, owner, priority, frequency, formula, and definition above twelve monthly records. The two visual sections show monthly performance and cumulative year-to-date performance. For example, the demonstration selects Service Revenue and plots actual, target, and previous year. This makes the page useful for separating a single-month fluctuation from a sustained pattern.
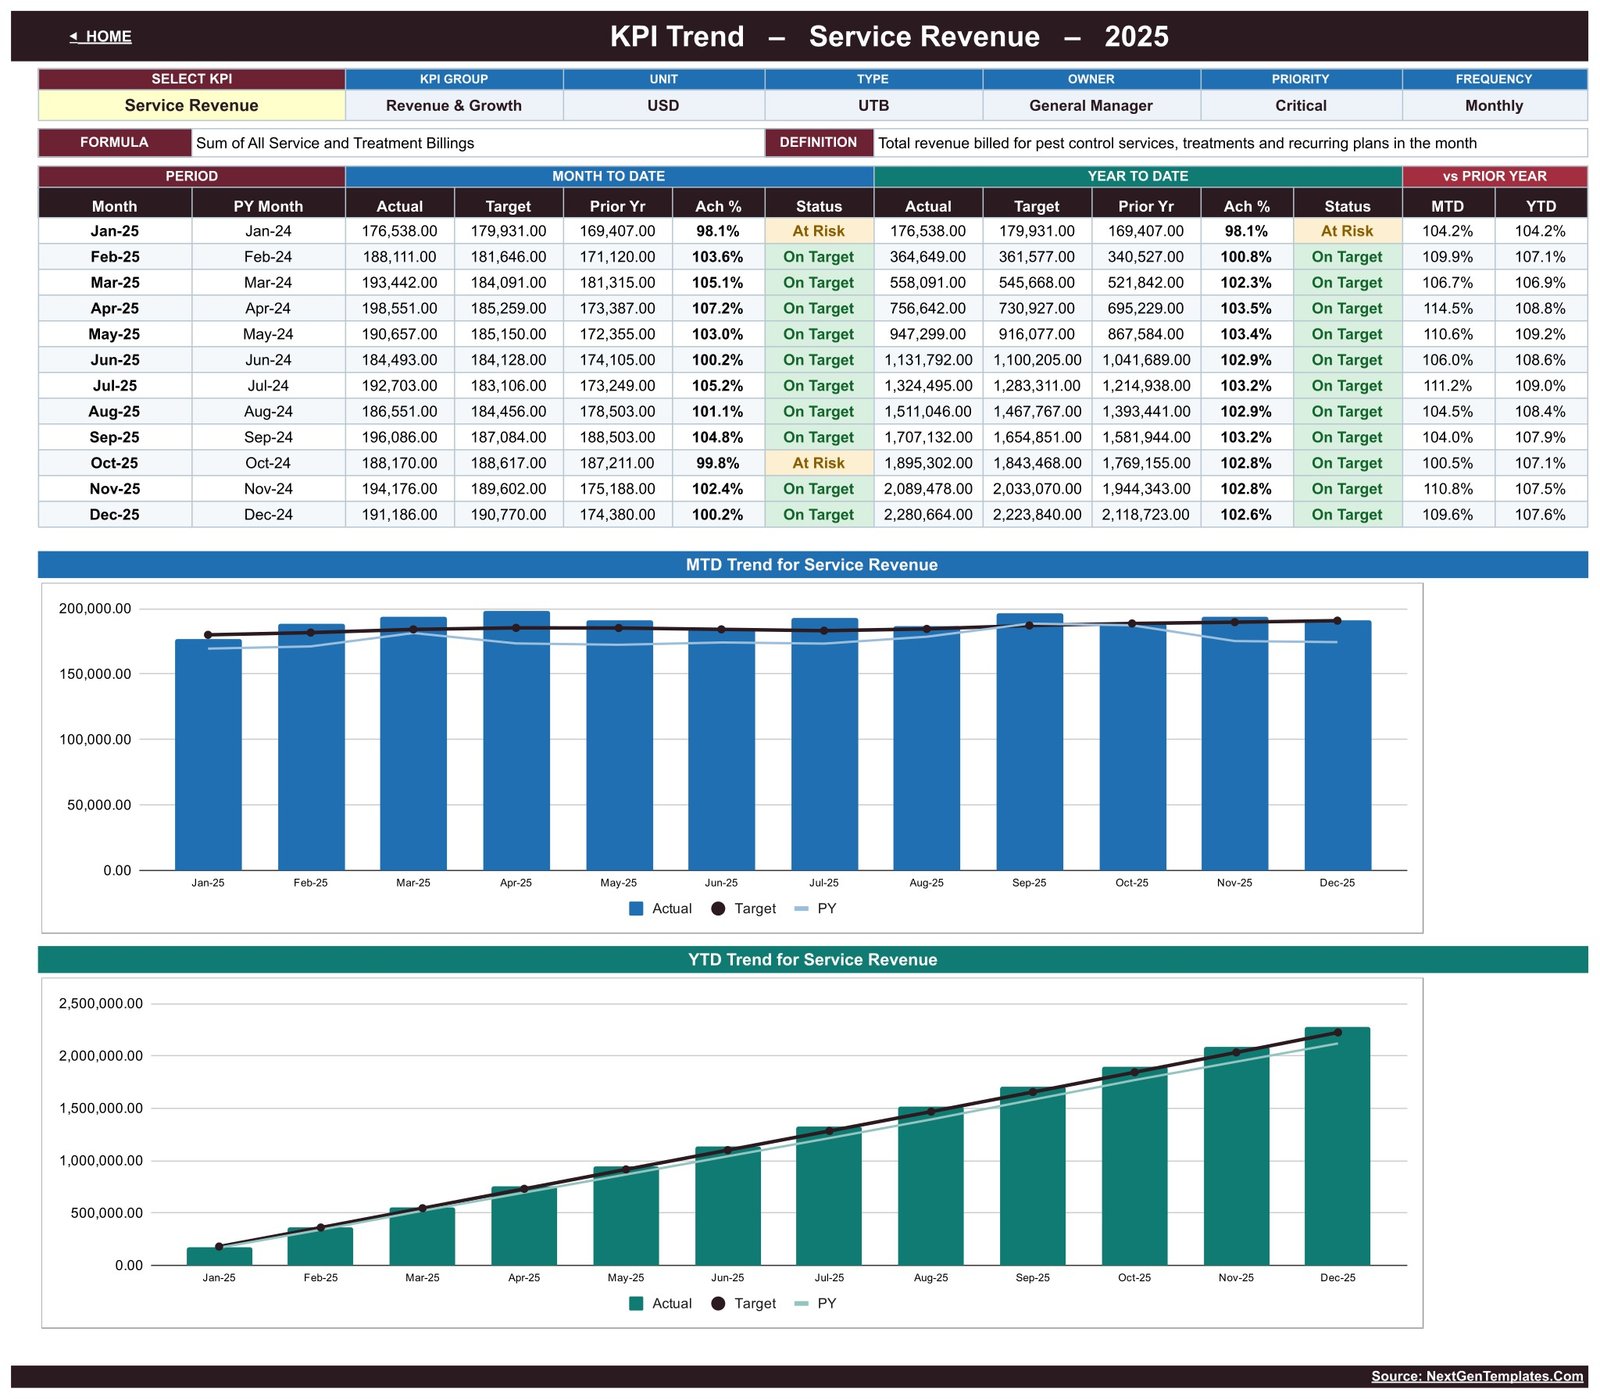
A focused twelve-month trend for the selected KPI.
KPI Analysis
The analysis page follows the month selected on the dashboard. It counts KPIs by group and status, calculates average MTD and YTD achievement, charts average YTD achievement by KPI group, and ranks the top and bottom five performers. This is the page for deciding where a review meeting should spend time.
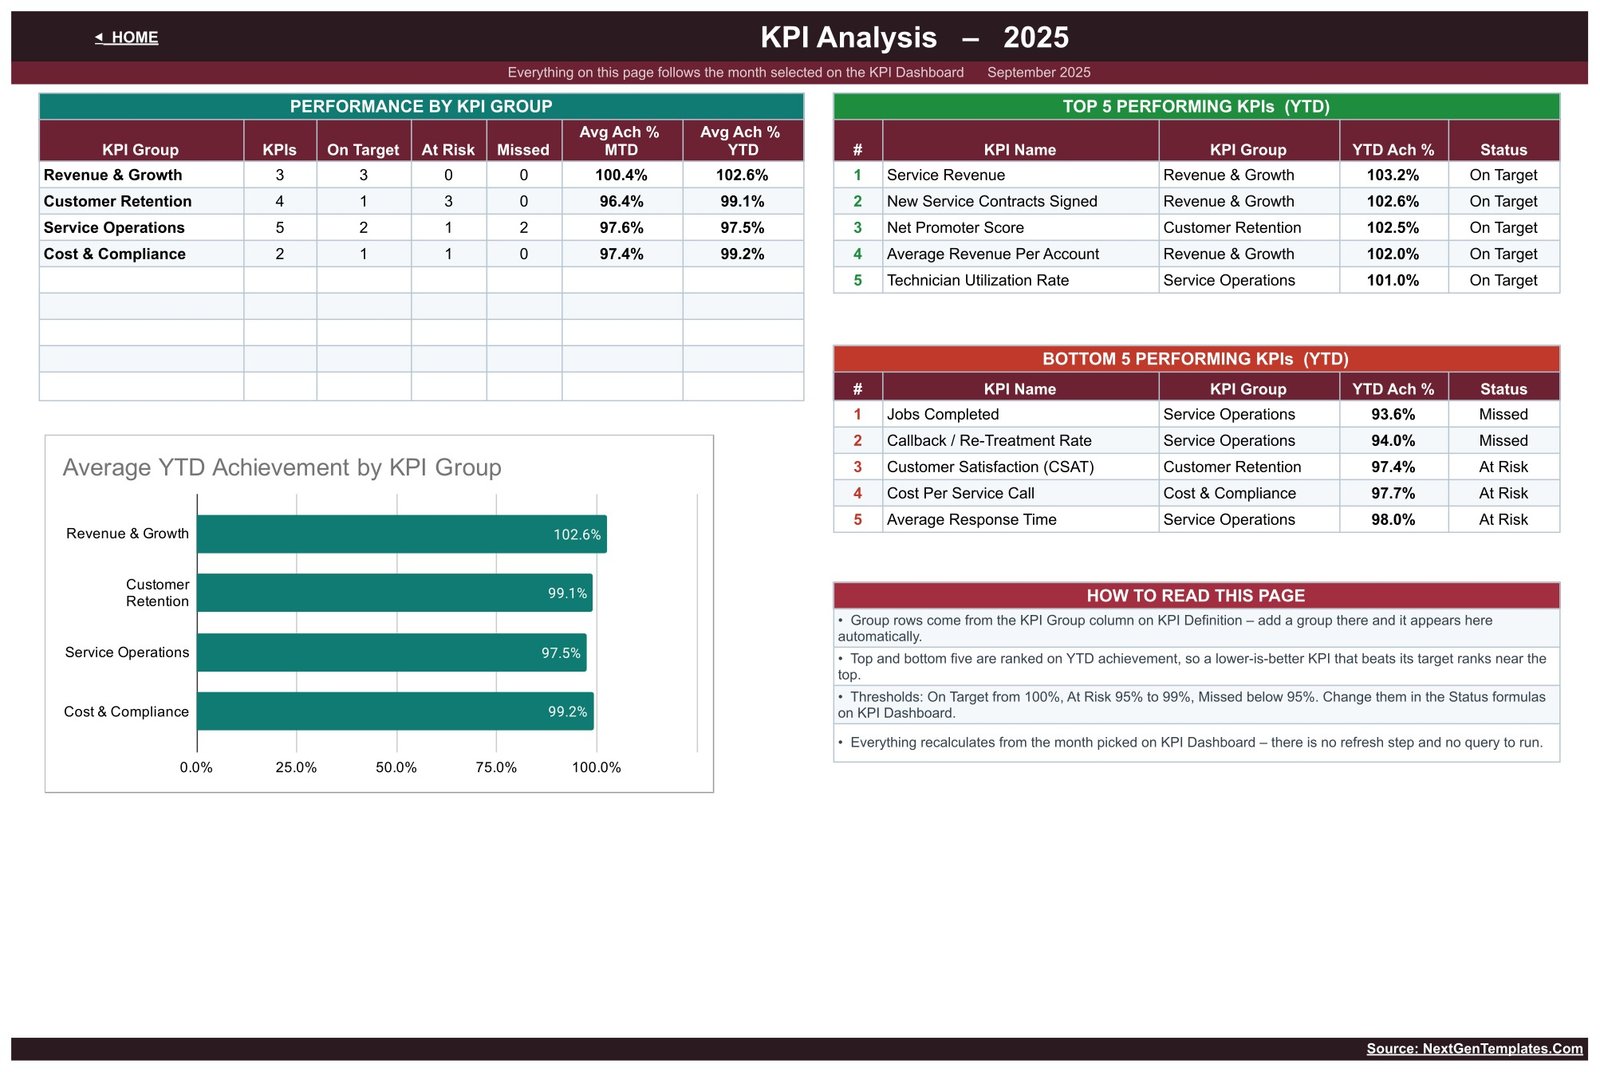
Group roll-up and prioritized performance ranking.
Input and definition areas
The current-year actual input grid holds monthly MTD and cumulative YTD figures. Matching target and prior-year areas supply the comparison series. The definition master centralizes the meaning of every KPI, including whether higher or lower is better. Yellow cells identify entry areas in the demonstrated design.
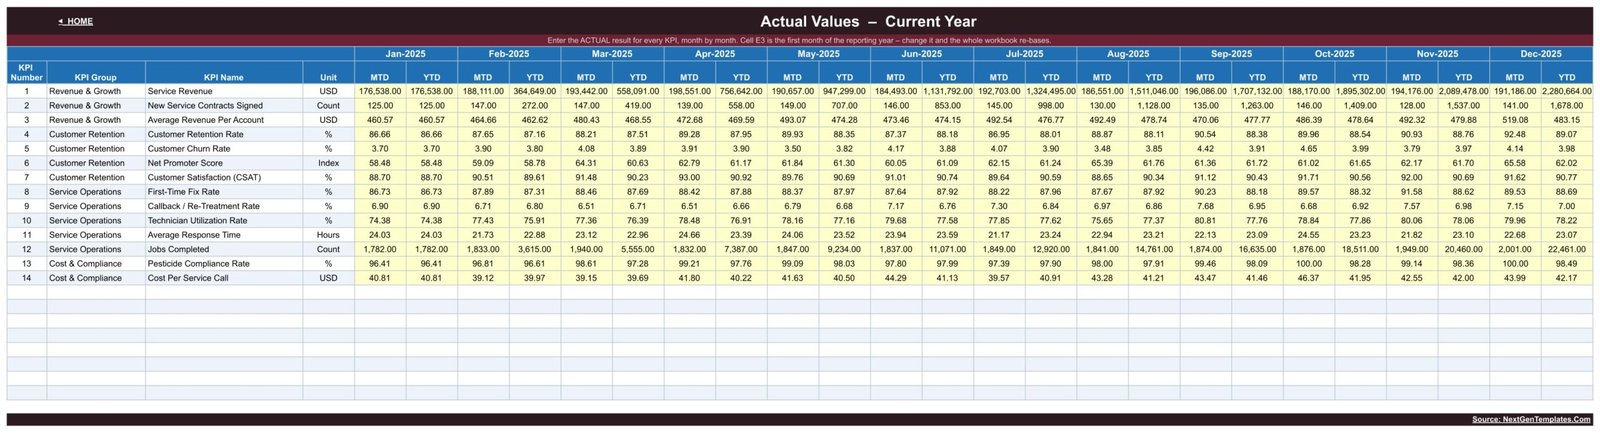
Current-year monthly actuals feed the dashboard and analysis.
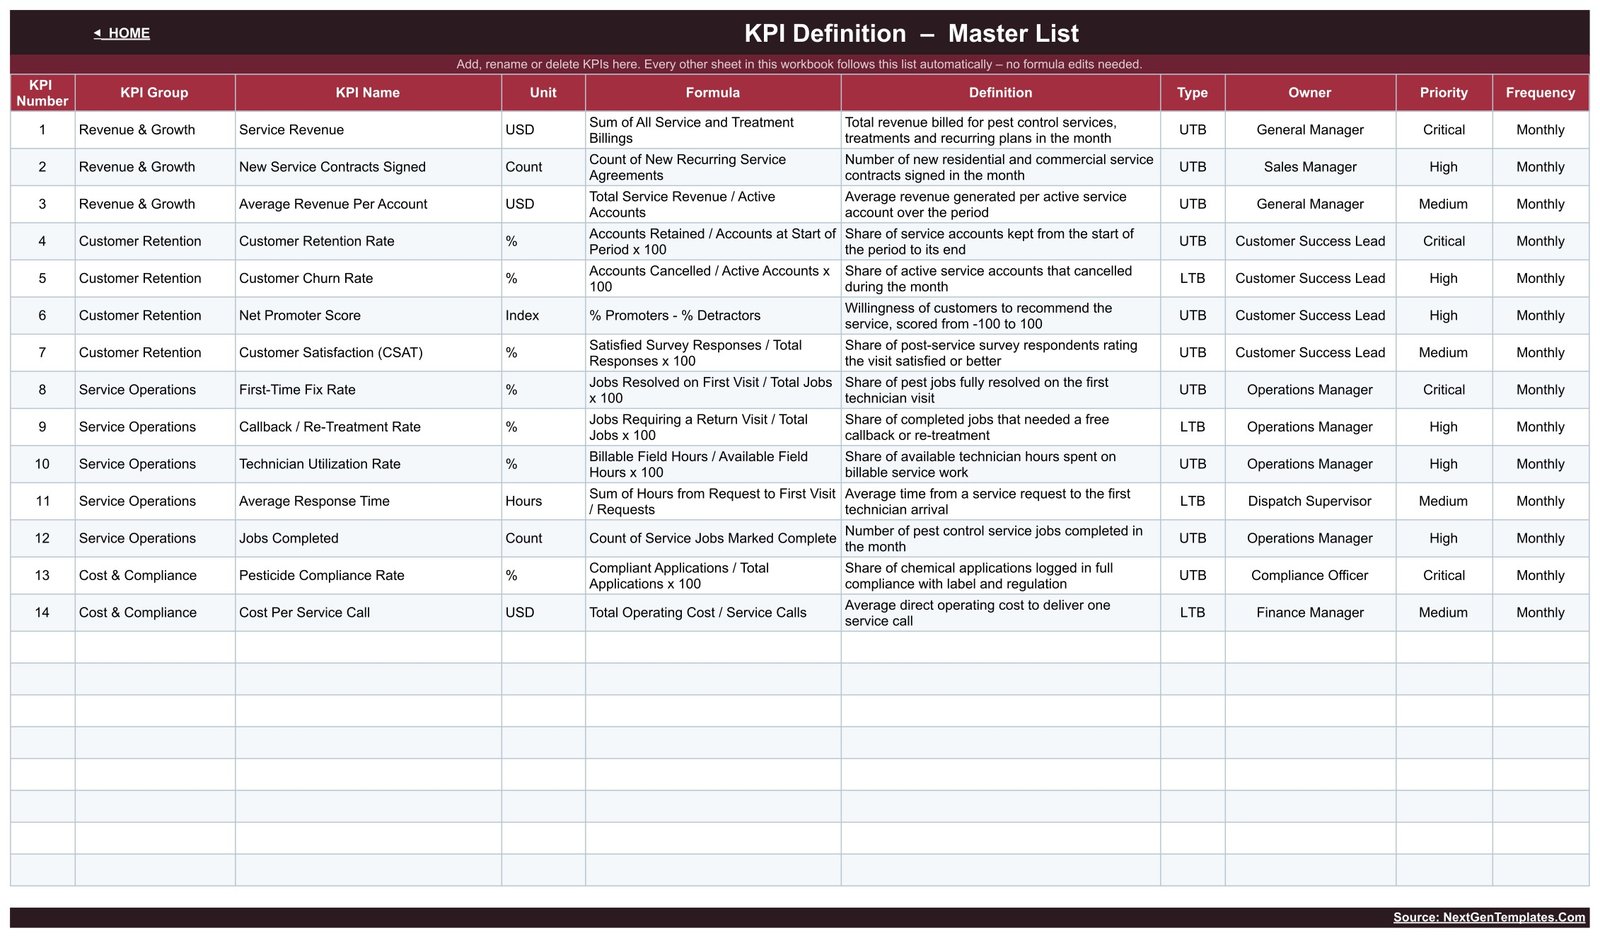
The definition master documents calculation intent and accountability.
Pest Control Business KPI Dashboard in Google Sheets vs. Excel vs. Paid Field-Service SaaS – Feature Comparison
| Feature | Google Sheets KPI template | Excel alternative | Paid field-service SaaS |
|---|---|---|---|
| Pricing model | One-time $8.99 sale price | Usually one-time | Monthly or annual subscription |
| Access | Modern browser and Google account | Excel desktop or web | Vendor account and app |
| Setup time | Copy, define, and enter monthly totals | Download, open, and configure | Onboarding and system configuration |
| Real-time collaboration | Native sharing and simultaneous editing | Varies by file location and version | Usually included |
| Mobile access | Google Sheets app or browser | Excel app or browser | Often a dedicated app |
| Custom fields and formulas | Transparent spreadsheet editing | Strong workbook editing | Controlled by vendor |
| Scheduling, routing, invoicing | Not included | Not normally included | Often included |
| Best use | Monthly KPI governance and review | Desktop-led analysis | End-to-end job operations |
Who Should Use This Template
Owners and general managers can use it to run a repeatable operating review. Operations managers can connect first-time fix, callbacks, technician utilization, response time, and completed jobs in one conversation. Customer-success leads can monitor retention, churn, NPS, and CSAT without mixing definitions. Sales managers can track new contracts, while finance managers can review revenue per account and cost per service call.
The template is best for businesses that can prepare reliable monthly totals. It is not designed for raw transaction storage, customer or property records, route planning, technician GPS, treatment documentation, chemical inventory, payroll, invoicing, or automated integration with a field-service platform.
Real-World Use Cases
Maya, a pest control company owner
Maya uses the Dashboard before her monthly management meeting. She checks whether growth is supported by retention and whether more completed jobs are accompanied by acceptable callback performance.
Daniel, an operations manager
Daniel selects First-Time Fix Rate and Callback / Re-Treatment Rate on the trend page. He compares the pattern with targets and previous-year results, then asks supervisors for operational context instead of reacting to one number.
Priya, a customer-success lead
Priya reviews retention, churn, NPS, and CSAT as a group. The definition sheet helps her team keep survey and account definitions stable from month to month.
Advantages of This Google Sheets KPI Template
The clearest advantage is transparency. A manager can inspect input cells, formulas, thresholds, and definitions instead of relying on a black-box score. The template also separates MTD from YTD, which reduces the risk of treating a weak month as a weak year. Direction-aware scoring matters because revenue and first-time fix usually reward higher performance, while churn, callbacks, response time, and cost are normally interpreted as lower-the-better. Finally, the analysis page turns a long scorecard into a ranked discussion list.
Opportunities for Improvement
The template intentionally does not replace operational software. A future customization could import approved monthly summaries from another sheet, add territory or branch views, or introduce a separate data-quality checklist. Teams may also wish to rename the compliance-related KPI so it precisely matches their internal control. Automated source-system connections, customer-level drilldowns, user permissions, alerts, and workflow approvals would require additional development.
Best Practices
- Define before entering: agree on numerator, denominator, owner, frequency, and direction for every KPI.
- Keep one reporting calendar: document when each month closes and who approves the totals.
- Protect formula areas: limit editing access and test structural changes in a spare copy.
- Separate facts from explanations: use the scorecard to surface variance, then investigate the operational cause outside the workbook.
- Review access regularly: Google provides guidance for sharing files from Google Drive; apply permissions appropriate to your organization.
- Do not treat a KPI as compliance evidence: retain all legally required operational records and seek qualified guidance where needed.
Explore Relevant Templates
The Pest Control Business KPI Scorecard in Google Sheets offers a more compact scorecard structure; read the scorecard walkthrough for a closer look. The Pest Control Dashboard in Google Sheets is a separate analytical dashboard, not the same KPI template, and its dashboard article explains that wider analytical format. Desktop teams can compare the Pest Control Dashboard in Excel, while Power BI users can consider the Pest Control Dashboard in Power BI. Browse the full Google Sheets KPI dashboard collection.
Frequently Asked Questions
Is this the same as the Pest Control Business KPI Scorecard?
No. This KPI dashboard includes dedicated trend and analysis pages in addition to the main scorecard. The scorecard product is a separate, more compact template.
How many KPIs are included?
The demonstrated setup contains 14 KPIs across four groups. You can rename definitions and adapt the structure, but major changes should be tested carefully.
Can multiple managers edit the sheet?
Yes, using standard Google Sheets sharing. The owner controls permissions and should protect formulas and sensitive business information.
Does it connect to pest control software automatically?
No. The product is a standalone Google Sheets template. You enter prepared monthly actual, target, and prior-year values.
Can it schedule jobs or dispatch technicians?
No. It does not include scheduling, routing, CRM, invoicing, or technician mobile workflows.
Does the Pesticide Compliance Rate prove legal compliance?
No. It is an editable, user-supplied operational KPI. The template does not interpret regulations, audit chemical applications, or replace required records and professional advice.
What is delivered after purchase?
The download is a PDF containing a link to create your own editable copy of the Google Sheets template.
About the Author
Built by PK – Microsoft Certified Professional with 15+ years of Excel, Google Sheets, and Power BI experience. Founder of NextGenTemplates, reaching 300K+ subscribers across YouTube channels. Every template is hand-built and tested before release.
Conclusion
The Pest Control Business KPI Dashboard in Google Sheets is a focused management layer for teams that already know their monthly numbers but need a clearer way to compare targets, prior year, trends, and business groups. It will not run field operations for you; it will give those operations a consistent scoreboard. View the template and its one-time purchase option, then adapt the KPI definitions to your own approved process. For more spreadsheet tutorials, visit PK: An Excel Expert on YouTube.