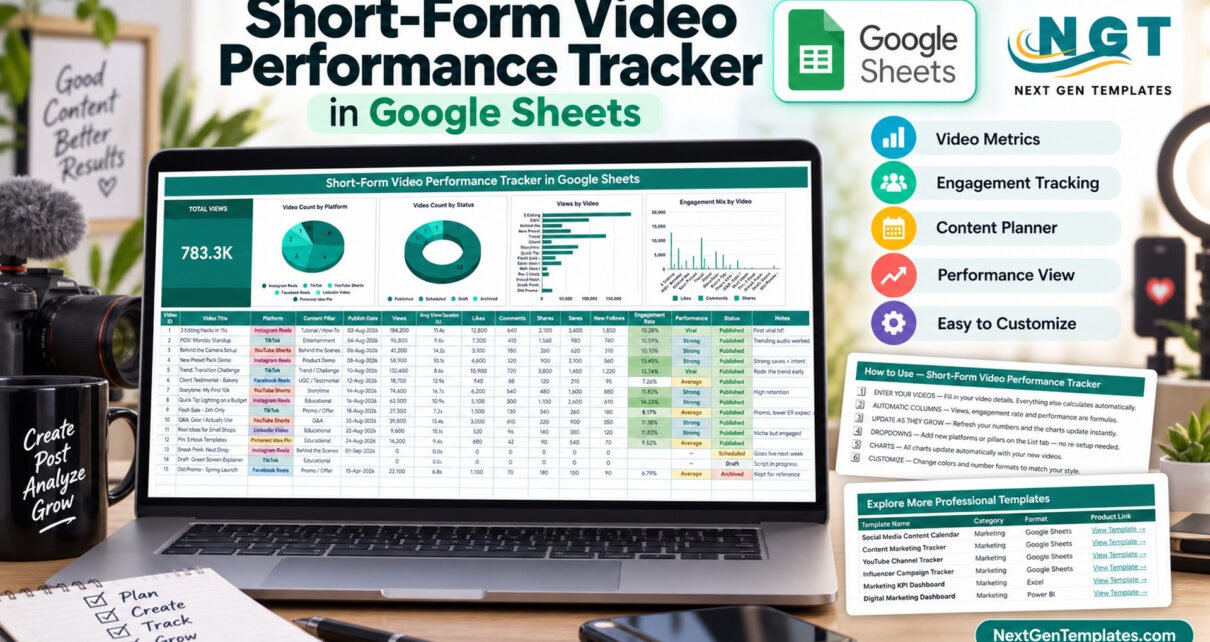
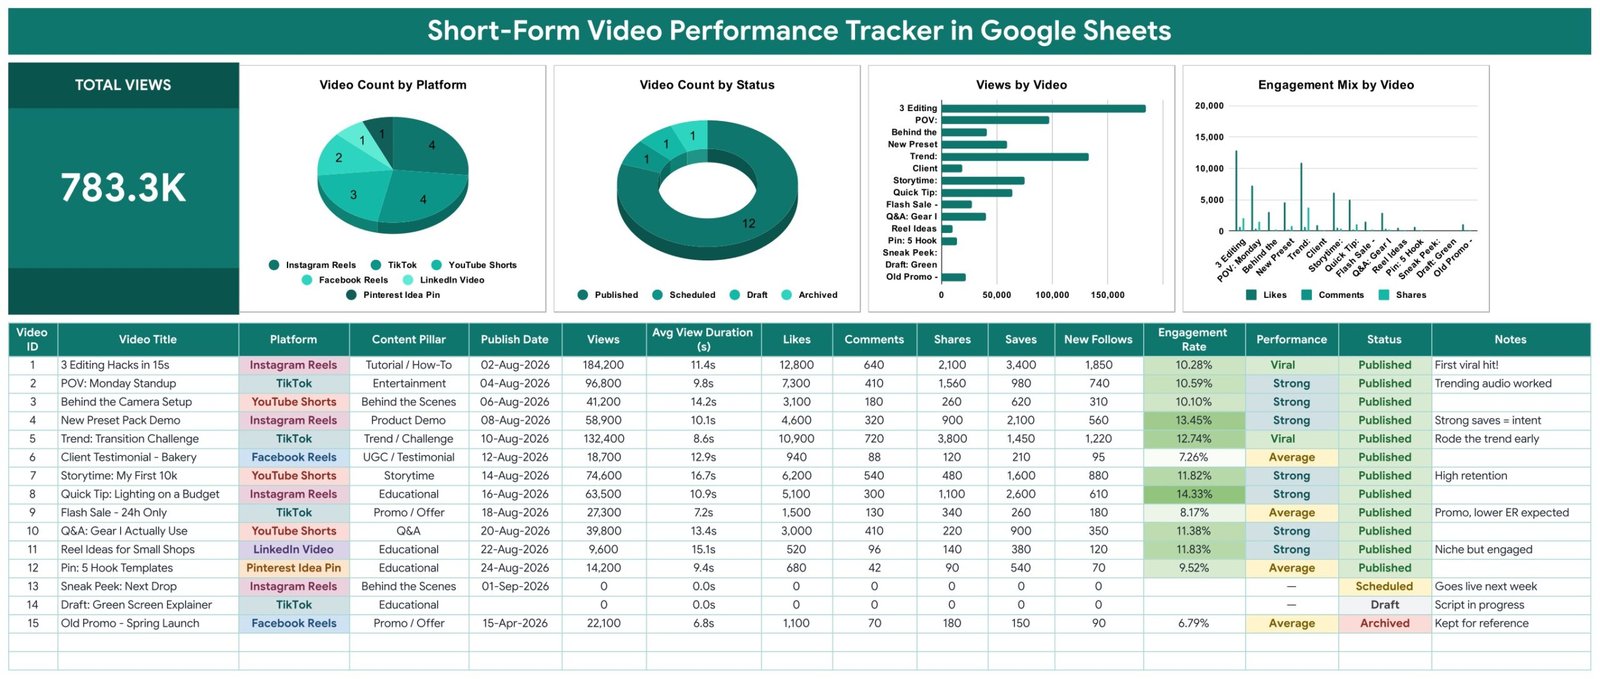
The Short-Form Video Performance Tracker in Google Sheets is a one-page tracker that logs Reels, TikToks and Shorts in a 16-column table and summarises them with a Total Views card and 4 charts. The ready-made copy includes 15 fictional sample videos spread across 6 platforms, 10 content pillars and 4 publishing statuses, totalling 783.3K views, so you can watch every formula and chart work before entering your own numbers.
Short-form creators rarely post to just one app. A clip goes to Instagram Reels, a variation lands on TikTok, and a cut-down version becomes a YouTube Short. Each platform keeps its own analytics screen, so answering a simple question – which videos actually grew my audience? – means opening several apps. This tracker gives you one place to record those numbers, calculates Engagement Rate automatically, and labels each video so the winners stand out. If you also plan long-form uploads, it pairs well with the YouTube Video Ideas and Upload Tracker in Google Sheets.
Key Features of the Short-Form Video Performance Tracker
The template is built around one tracker tab, so everything you need is visible without switching sheets. These are the features you get:
- Total Views card: A headline card adds up the Views column for every row. With the sample data it shows 783.3K, and it changes as soon as you update any video.
- Four charts linked directly to the data: Video Count by Platform, Video Count by Status, Views by Video and Engagement Mix by Video. All four read rows 16-1000 with the built-in Aggregate option, so new videos appear without any helper tables.
- Automatic Engagement Rate: Each row calculates (Likes + Comments + Shares + Saves) ÷ Views. A video with no views yet shows a dash rather than an error.
- Performance label: The Performance column marks each published video as Viral, Strong, Average or Low Reach.
- Expandable dropdowns: Platform, Content Pillar and Status draw from a List tab covering rows 2-500. Adding a value there adds it to the dropdown.
- Automatic Video ID: Video IDs number themselves, so you only type the details that matter.
- Notes column: Record what you tried – a trending sound, a new hook, a posting time – next to the result it produced.
The Engagement Rate formula uses four interactions, while the Engagement Mix by Video chart plots three of them (Likes, Comments and Shares). Saves and New Follows stay visible in the table for every video.
Sheets Explanation
Tracker Tab: Total Views Card, Charts and Video Log
The top band holds the Total Views card and the four charts. Video Count by Platform splits your output across Instagram Reels, TikTok, YouTube Shorts, Facebook Reels, LinkedIn Video and Pinterest Idea Pin. Video Count by Status counts Published, Scheduled, Draft and Archived videos. Views by Video ranks every clip, and Engagement Mix by Video compares Likes, Comments and Shares per video.
Below the charts sits the 16-column log: Video ID, Video Title, Platform, Content Pillar, Publish Date, Views, Avg View Duration (s), Likes, Comments, Shares, Saves, New Follows, Engagement Rate, Performance, Status and Notes. The sample ranges from “3 Editing Hacks in 15s” with 184,200 views to a draft green-screen explainer that has not gone live yet.
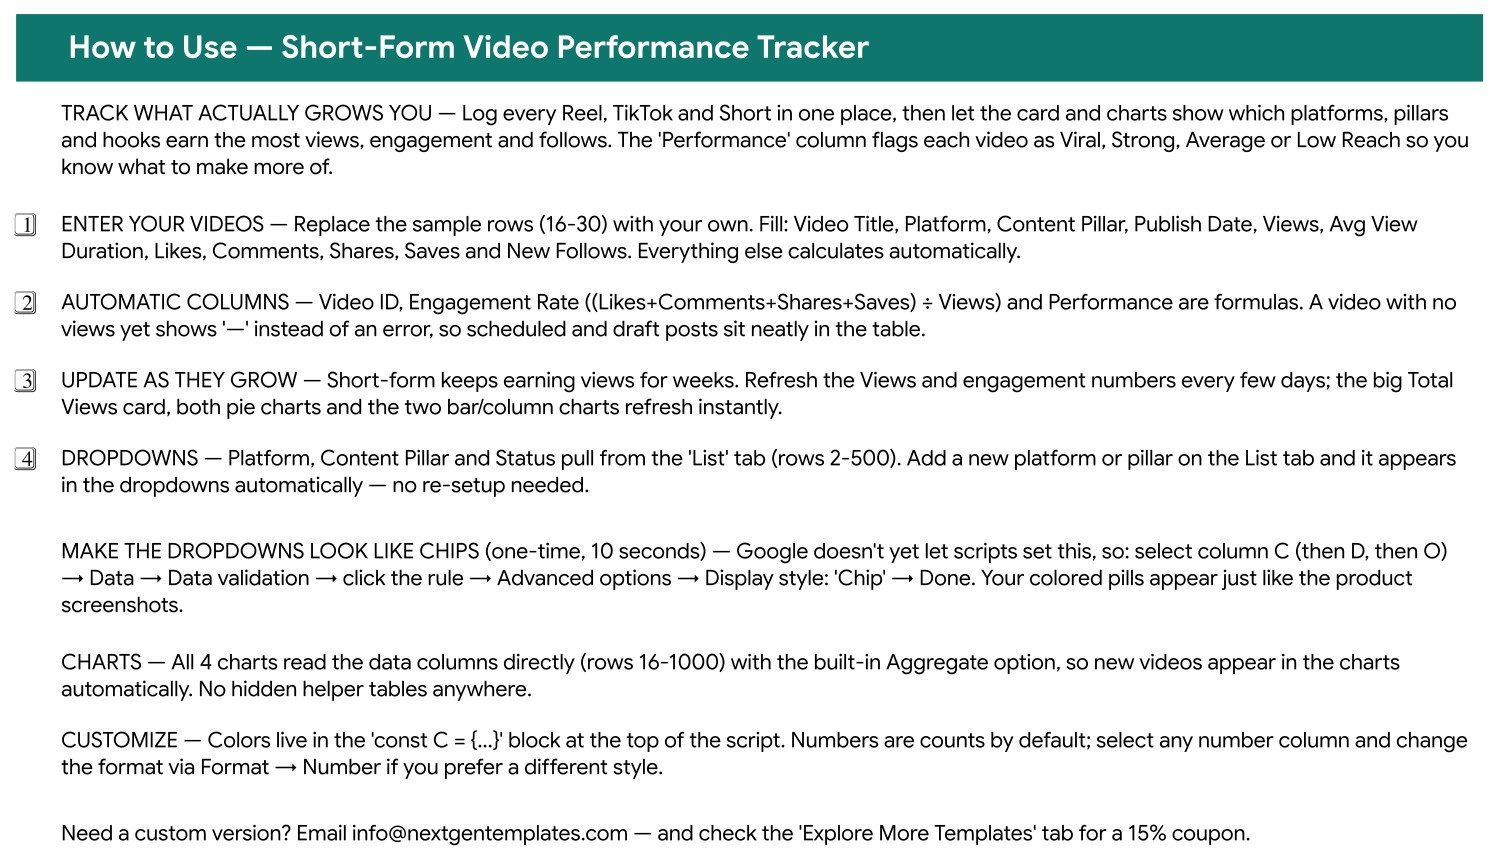
How to Use Tab
This tab explains which columns to fill in, which columns are formulas, how the List-driven dropdowns work, how often to refresh numbers, and how to switch the dropdowns to Google’s chip display style – a one-time, ten-second setting that scripts cannot apply for you.
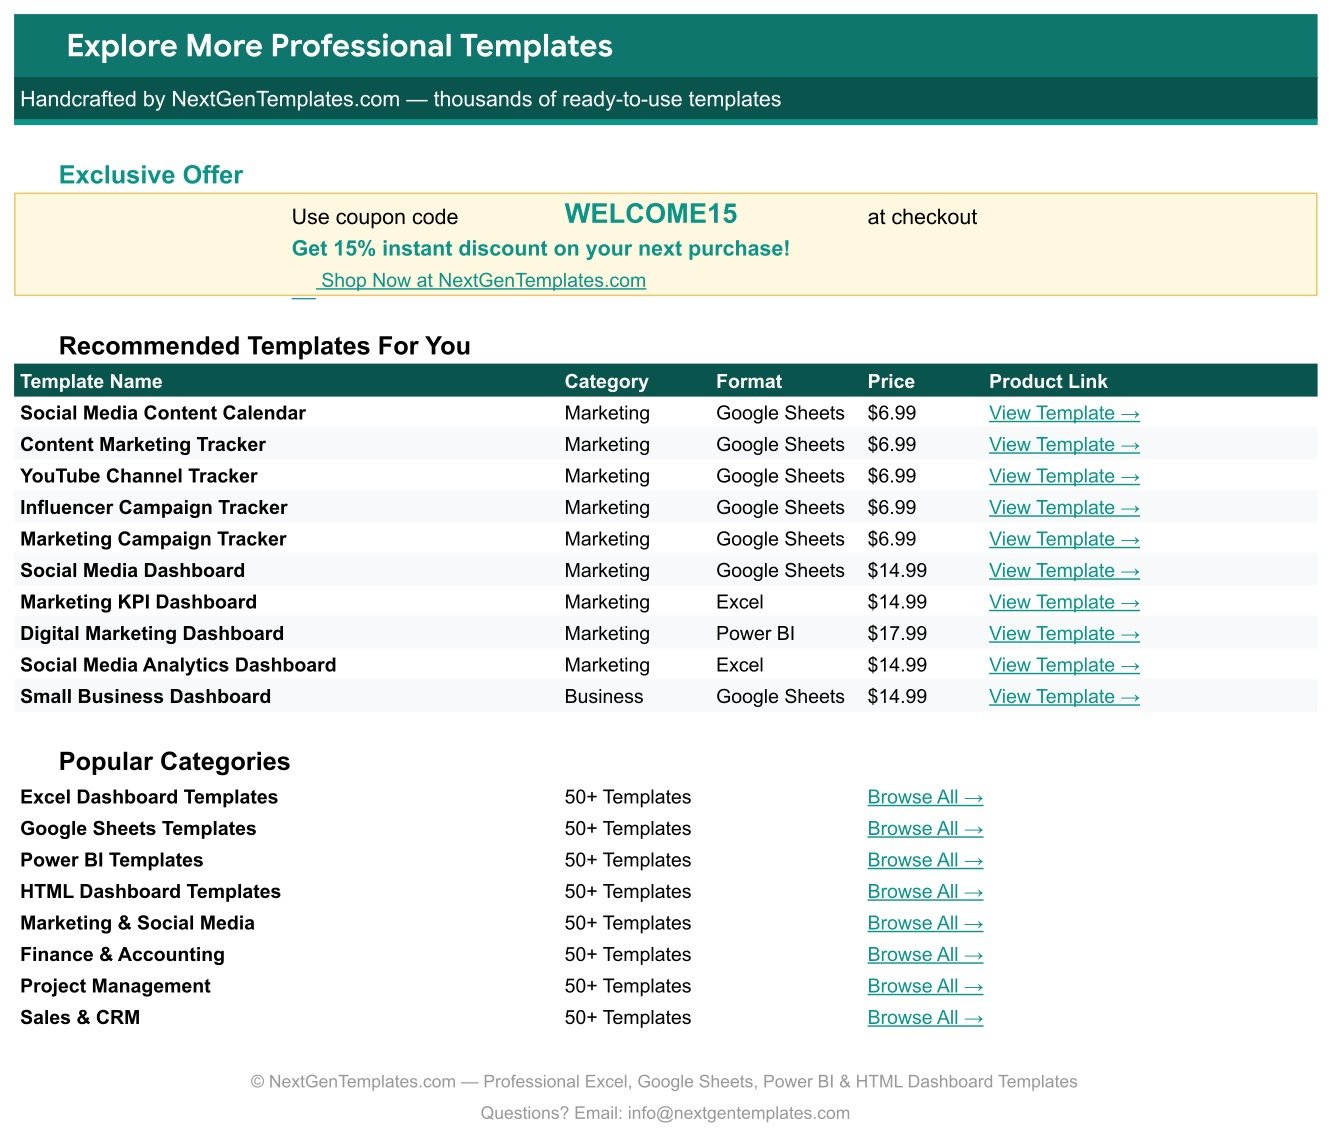
Explore More Templates Tab
The last tab lists related marketing templates and includes the WELCOME15 coupon for 15% off your next NextGenTemplates purchase. A separate List tab stores the dropdown options for Platform, Content Pillar and Status.
Google Sheets Video Tracker vs. Excel Workbook vs. Paid Social Analytics Tools — Feature Comparison
| Feature | Short-Form Video Performance Tracker in Google Sheets | Microsoft Excel video tracker | Paid social analytics suite (e.g. Sprout Social, Hootsuite, Later) |
|---|---|---|---|
| Cost | ✅ $6.99 one-time | Excel licence plus build time | Recurring monthly subscription |
| Platform | ✅ Any browser with a free Google account | Excel desktop or Microsoft 365 | Vendor web app |
| Setup time | ✅ Make a copy, replace 15 sample rows | Build formulas and charts yourself | Connect accounts and configure reports |
| Data entry | Manual | Manual | ✅ Automatic import |
| Real-time team collaboration | ✅ Live co-editing built in | Co-authoring via OneDrive or SharePoint | Extra seats usually cost more |
| Mobile access | ✅ Google Sheets app | Excel mobile app | Vendor app |
| Customizable fields | ✅ Fully editable columns and dropdowns | Fully editable | Vendor-defined metrics |
| Share with link | ✅ Yes | Via OneDrive | Plan-dependent report sharing |
| Year-1 cost at 5 users | ✅ $6.99 once | 5 Excel licences | 12 months of subscription, often per seat |
For creators and small teams who want to know which short videos earn views and engagement without a monthly analytics bill, this Google Sheets tracker sits in the sweet spot.
Who Should Use This Template
Perfect for:
- Solo creators posting the same idea to Reels, TikTok and Shorts
- Small-business social media managers who report on short-form output each month
- Freelancers and small studios sharing a results log with clients
- Brands testing content pillars such as tutorials, trends, storytime and UGC
Not a fit if:
- You need numbers pulled in automatically – there is no TikTok, Instagram, YouTube, Facebook, LinkedIn or Pinterest API connection
- You need scheduling, auto-publishing, audience demographics or sentiment analysis
- You want to track ad spend or creator income in the same sheet
Real-World Use Cases
Maya, a fitness coach, posts workout demos to Instagram Reels and TikTok. She logs each clip on publish day and updates numbers every weekend. Views by Video and the Performance column show her which demos deserve a follow-up series, while the Notes column reminds her which trending audio she used.
Daniel runs social media for a neighbourhood bakery. He tags every video with a pillar – Product Demo, UGC / Testimonial or Promo / Offer – and compares Engagement Rate between them before planning the next month. Promo posts naturally engage less, and the Notes column lets him record that expectation.
A two-person video studio shares the sheet with a client. Video Count by Status shows what is Scheduled or still in Draft, Video Count by Platform shows where effort went, and the Total Views card gives the client a single number after each refresh. For long-form channels the studio also keeps the YouTube Channel Performance Tracker in Google Sheets.
Advantages of the Google Sheets Video Tracker
- One log for every platform: Stop switching between analytics screens to compare a Reel with a Short.
- No formulas to write: Engagement Rate, Performance and Video ID are already built.
- Low, one-time cost: $6.99 once instead of a recurring subscription.
- Easy to share: Google Sheets sharing lets a client or teammate view or edit the same file in real time.
- Grows with you: Charts cover rows 16-1000, and the List tab holds up to 499 dropdown options.
Opportunities for Improvement
- Manual entry only: Every view, like and follow is typed in. There is no automatic import from any platform.
- Not every metric is charted: Avg View Duration, Saves and New Follows appear in the table but not in a chart.
- Chip styling is a manual step: The coloured dropdown chips need a one-time Data validation setting per column.
- No time-series view: There is no views-by-month chart; sort or filter by Publish Date to review a period.
Best Practices
- Update each video’s numbers on a fixed rhythm, such as 2 days, 7 days and 30 days after publishing, so comparisons are fair.
- Keep content pillar names consistent on the List tab so sorting and filtering by pillar stays clean.
- Use the Notes column for the hook, sound or format you tested – it turns the log into a playbook.
- Learn Google’s data validation options to switch dropdowns to chips, and its chart editing guide if you want to restyle a chart.
- Archive old promos instead of deleting them, so Video Count by Status still reflects your full history.
Explore Relevant Templates
- YouTube Video Ideas & Upload Tracker in Google Sheets – plan ideas and uploads.
- YouTube Channel Performance Tracker in Google Sheets – long-form channel results.
- Podcast Episode Planning Tracker in Google Sheets – for creators with an audio show (read the podcast tracker guide).
- Social Media Influencer Tracking Dashboard in Google Sheets – see our influencer tracking dashboard walkthrough.
Frequently Asked Questions
Does the Short-Form Video Performance Tracker pull data from TikTok or Instagram?
No. The tracker has no API connection or automatic import. You copy views and engagement from each platform’s own analytics screen, and the Engagement Rate, Performance label, Total Views card and four charts then update automatically from those entries.
How is Engagement Rate calculated?
Engagement Rate is (Likes + Comments + Shares + Saves) divided by Views for each video. Scheduled or draft videos with zero views show a dash instead of a divide-by-zero error, so the table stays tidy while your pipeline waits to go live.
Can I add platforms other than the six included?
Yes. The Platform, Content Pillar and Status dropdowns read from the List tab. Type a new platform or pillar there and it appears in the dropdown immediately. The tracker ships with Instagram Reels, TikTok, YouTube Shorts, Facebook Reels, LinkedIn Video and Pinterest Idea Pin.
How long does setup take?
There is nothing to install. Make a copy from the link in the PDF, overwrite the 15 fictional sample rows with your own videos, and the formulas and charts do the rest. Most of the time goes into entering your real numbers for the first time.
How does this tracker compare to Sprout Social or Hootsuite?
Paid suites import data automatically and add scheduling, but they bill every month. The Google Sheets tracker costs $6.99 once, is fully editable, and suits creators or small teams who are comfortable entering numbers by hand for a simple, shareable results log.
Is the sample data real?
No. All 15 sample videos and their figures are fictional and are there to demonstrate the formulas and charts. Instagram, TikTok, YouTube, Facebook, LinkedIn and Pinterest are trademarks of their respective owners, and NextGenTemplates is not affiliated with or endorsed by them.
About the Author
Built by PK — Microsoft Certified Professional with 15+ years of Excel, Google Sheets, and Power BI experience. Founder of NextGenTemplates, reaching 300K+ subscribers across YouTube channels. Every template is hand-built and tested before release.
Conclusion
If you publish short videos on more than one platform, a single log beats juggling analytics screens. The tracker gives you a Total Views card, four charts, automatic Engagement Rate and a clear performance label for every clip, all inside a Google Sheet you own.
👉 Click here to Purchase Short-Form Video Performance Tracker in Google Sheets
✅ Instant download · One-time payment · No subscription
🎥 More tutorials: Youtube.com/@NeoTechNavigators
Last updated: September 2026