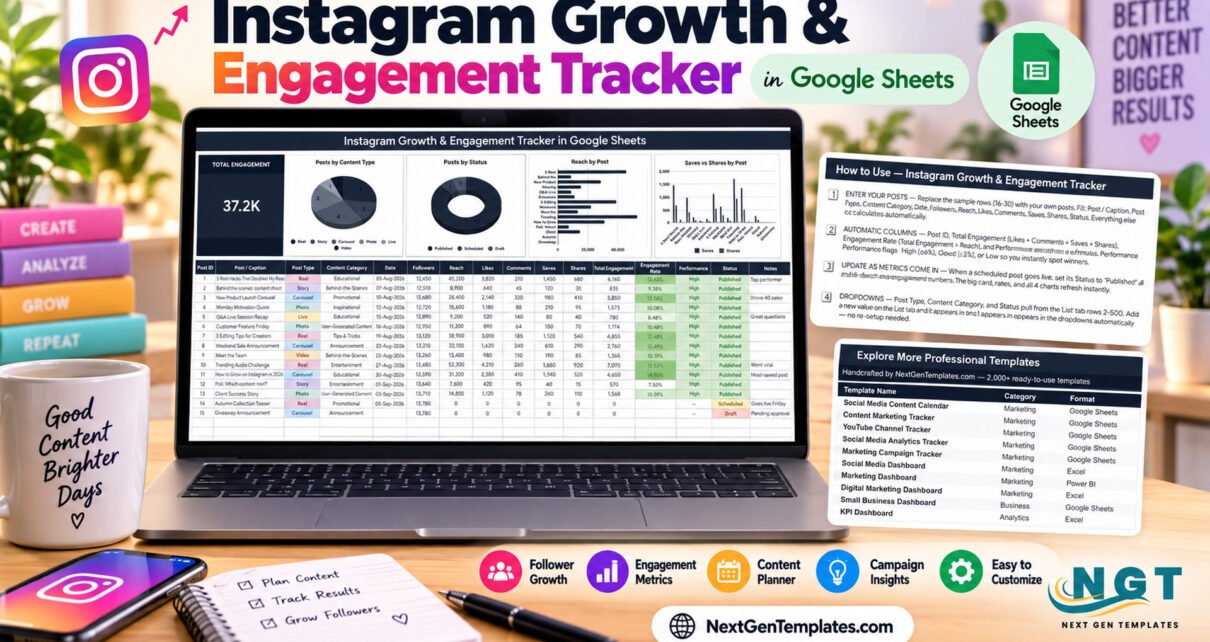
The Instagram Growth & Engagement Tracker in Google Sheets is a one-page template with a 16-column post log, 4 automatic columns, a Total Engagement card and 4 live charts. The sample file holds 15 posts across 6 post types (Reel, Story, Carousel, Photo, Live and Video) and 8 content categories, adding up to 37.2K total engagement, so every chart and flag is visible before you enter a single post of your own.
Most creators judge a post by how it feels in the first hour. This Instagram growth engagement tracker replaces that guesswork with a running record: reach, likes, comments, saves and shares for every post, an engagement rate measured against reach, and a High / Good / Low label that shows which formats and topics actually earn attention. It suits anyone who wants that clarity without a monthly analytics subscription.
Instagram is a trademark of Meta Platforms, Inc. This template is an independent NextGenTemplates product, not affiliated with or endorsed by Instagram or Meta. It does not connect to your account: every number is entered by you, and the sample posts are fictional.
Key Features of the Instagram Growth & Engagement Tracker
- One log for every post. Each row records Post / Caption, Post Type, Content Category, Date, Followers, Reach, Likes, Comments, Saves, Shares, Status and Notes. Recording Followers against each post lets you read audience growth down the table, from 12,450 to 13,780 in the sample.
- Four automatic columns. Post ID numbers each row, Total Engagement adds Likes + Comments + Saves + Shares, Engagement Rate divides Total Engagement by Reach, and Performance labels published posts High (6% or more), Good (3% or more) or Low.
- A card and four charts. Total Engagement sits in a large card, next to Posts by Content Type, Posts by Status, Reach by Post and Saves vs Shares by Post. The charts read data rows 16-1000 directly with the built-in aggregate option, so new posts appear without any helper tables.
- Dropdowns that grow. Post Type, Content Category and Status come from the List tab (rows 2-500). Add a new content pillar there and it shows up in the dropdown immediately.
- Plan and measure in one place. Upcoming posts can sit as Scheduled or Draft with notes such as “Pending approval”. Their Performance shows a dash until they are published and have reach, so plans never skew your results.
- Readable colour. Post types have their own colours, Engagement Rate shades greener as it rises, and statuses are colour-coded for a quick scan.
Template Structure Explained
You receive a PDF with a “Make a copy” link. Clicking it creates your own editable Google Sheets file with the tracker tab, a List tab for dropdown values, a How to Use tab and an Explore More Templates tab.
Tab 1: Instagram Tracker
The top band shows the Total Engagement card and the four charts: Posts by Content Type, Posts by Status, Reach by Post and Saves vs Shares by Post. Underneath, the post log holds every post with its metrics, the calculated Total Engagement and Engagement Rate, the Performance flag, Status and Notes. In the sample, “How to Grow on Instagram in 2026” posts the highest engagement rate at 14.90%, while “Trending Audio Challenge” reaches the most accounts at 52,300.

Tab 2: How to Use
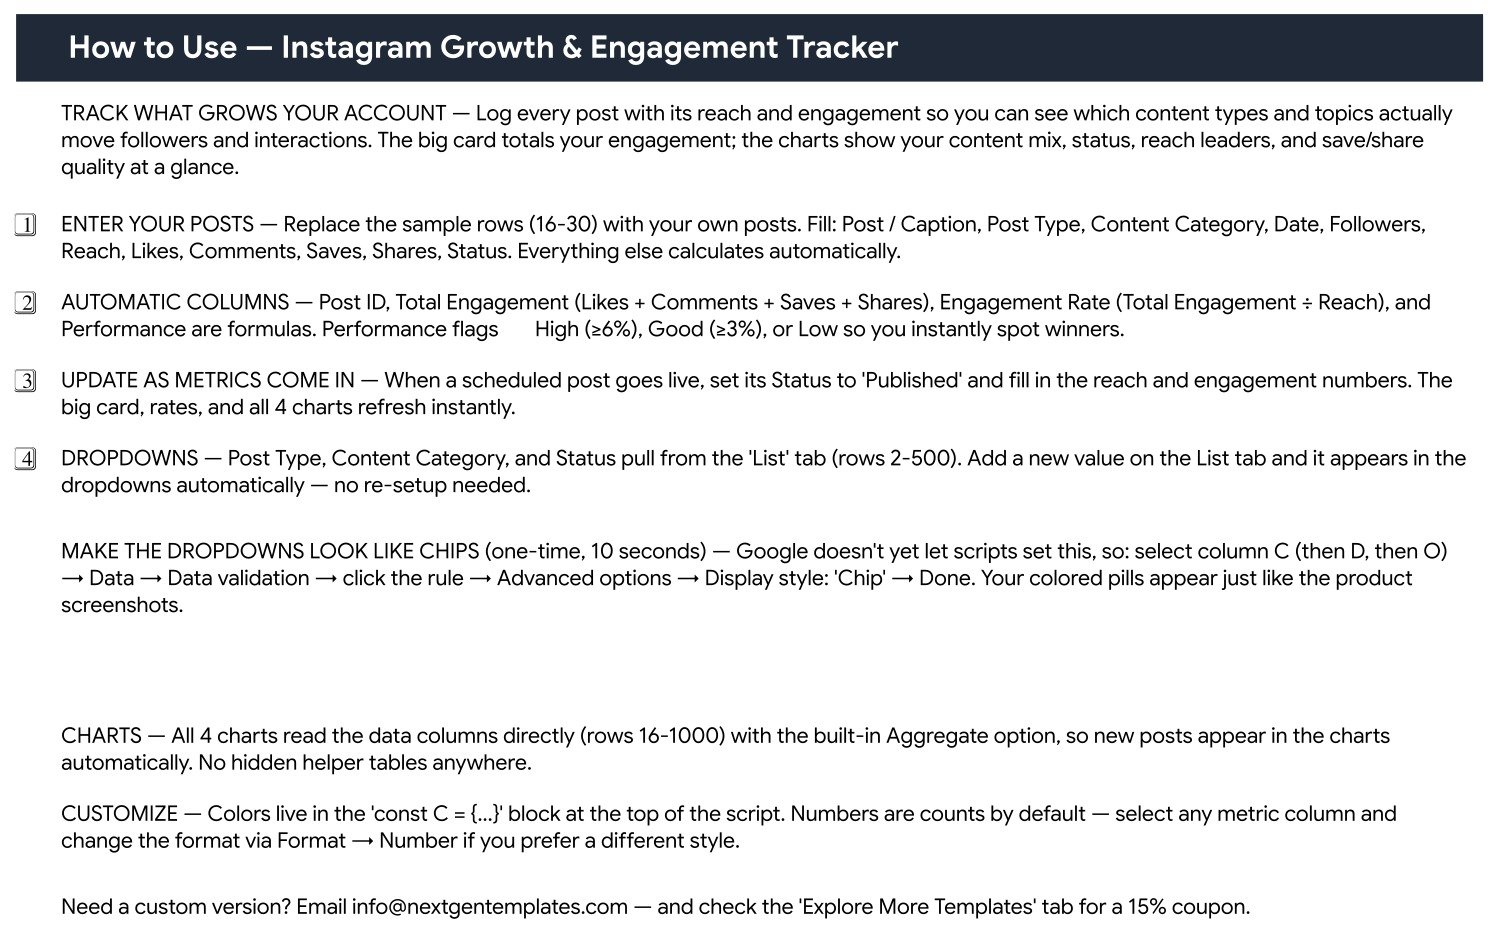
This tab walks through entering posts in rows 16-30, the four automatic columns, the Performance thresholds, updating a scheduled post once it goes live, and the one-time step that turns dropdowns into coloured chips.
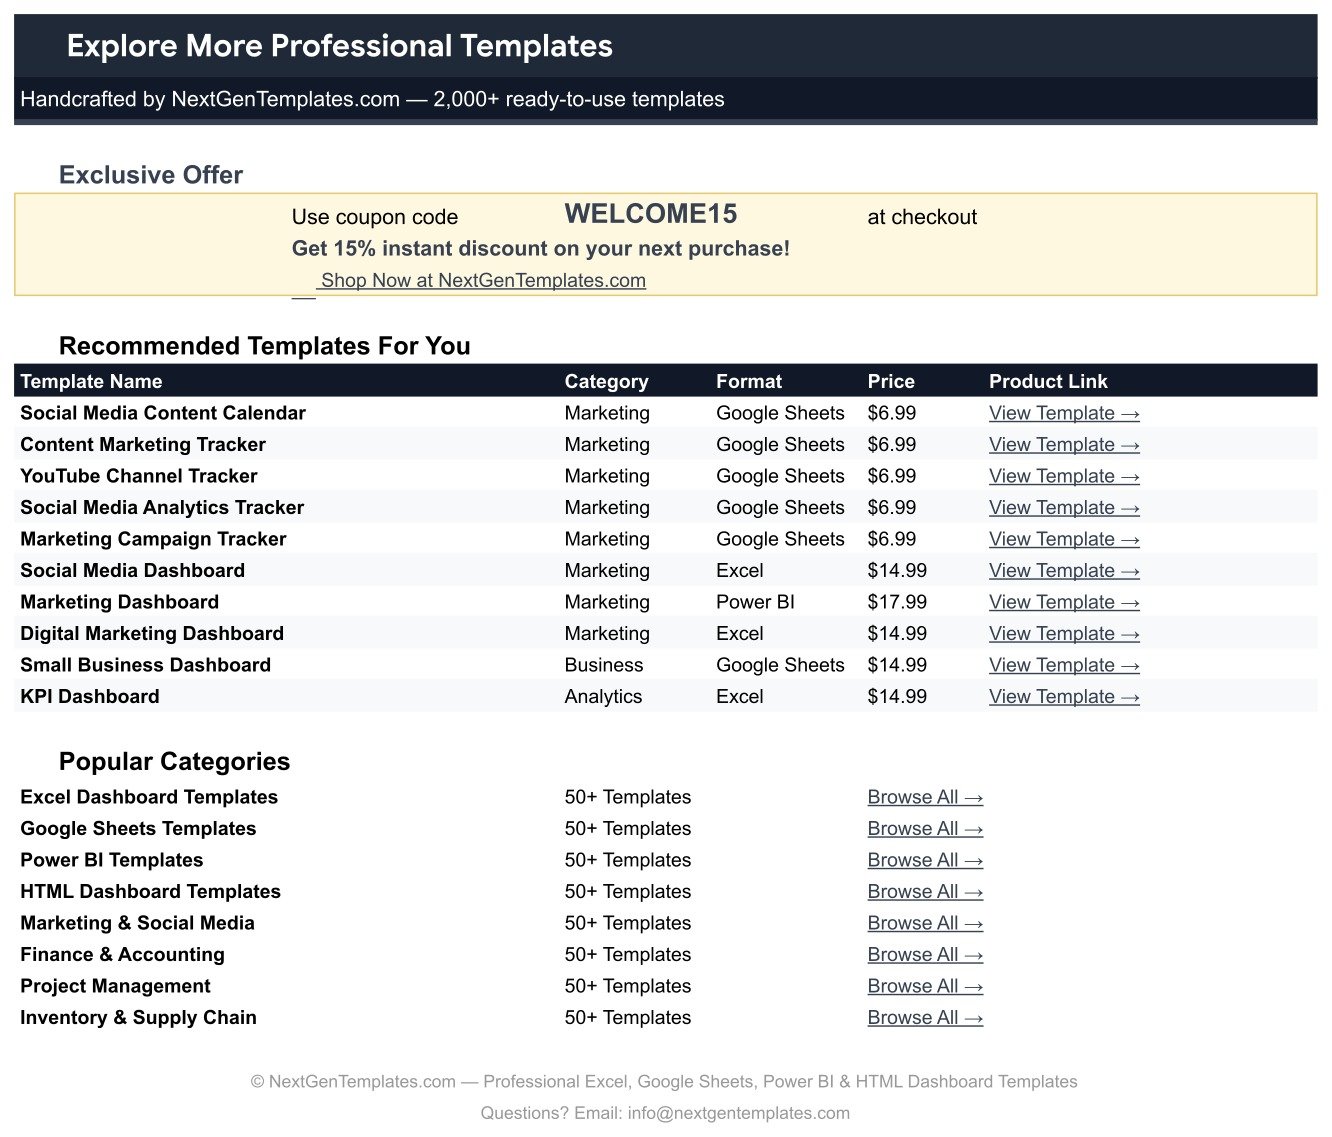
Tab 3: Explore More Templates
A list of recommended marketing templates, popular template categories and the WELCOME15 coupon for 15% off your next purchase.
Instagram Tracking in Google Sheets vs. Excel vs. Paid Social Analytics Tools — Feature Comparison
| Feature | Instagram Growth & Engagement Tracker (Google Sheets) | Microsoft Excel spreadsheet | Paid social analytics suites (e.g. Sprout Social, Hootsuite) |
|---|---|---|---|
| Cost | ✅ $6.99 one-time | Free to build, but every formula and chart is yours to design | Monthly subscription, usually per seat |
| Platform | ✅ Any browser with a Google account | Excel desktop or Microsoft 365 | Vendor web app |
| Setup time | ✅ About 10 minutes | Several hours from scratch | Account connection and onboarding |
| Getting metrics in | Typed or pasted by you | Typed or pasted by you | ✅ Imported automatically |
| Engagement Rate and Performance flag | ✅ Built in, by reach | Only if you write it | ✅ Built in, vendor’s method |
| Real-time collaboration | ✅ Share with a link | Needs OneDrive or SharePoint | ✅ Per paid seat |
| Mobile access | ✅ Google Sheets app | Excel app | ✅ Vendor app |
| Custom fields and dropdowns | ✅ Edit the List tab | ✅ Fully editable | Limited to vendor fields |
| Year-1 cost at 5 users | ✅ $6.99 once | Microsoft 365 licence per user | Five seats billed monthly |
For creators and small teams who want a clear engagement record without a recurring analytics bill, the Instagram Growth & Engagement Tracker sits in the sweet spot; teams that need automatic imports are better served by a paid suite.
Who Should Use This Template
Perfect for:
- Creators and influencers posting a few times a week who want to know which formats earn saves and shares
- Small business owners managing one brand account
- Freelance social media managers who keep one shareable log per client
- Marketing students learning how reach and engagement rate relate
Not a fit if:
- You need metrics pulled from Instagram or Meta automatically every day
- You want to compare many accounts inside one table
- You need post scheduling or auto-publishing
Real-World Use Cases
Maya, a fitness creator with about 13,000 followers, logs every Reel and Carousel each Sunday. After a month she sorts by Engagement Rate and sees that her educational Carousels keep landing in High while quick quote photos sit lower. She now plans two Carousels a week and checks the Saves vs Shares by Post chart before picking topics, because saves tell her which posts people want to come back to.
Daniel handles Instagram for a family bakery. He records each promotion, behind-the-scenes Story and customer feature, writes notes such as “Drove 40 sales”, and shares the sheet with the owner. The Total Engagement card and the Reach by Post chart replace the screenshots he used to paste into a monthly report.
Priya, a freelance social media manager, keeps one copy per client. Draft posts carry approval notes, Scheduled posts show their go-live day, and she switches them to Published once they are live. Each client opens one link and sees both the plan and the results.
Advantages of This Instagram Growth Engagement Tracker
- No subscription. A one-time $6.99 purchase replaces a recurring analytics fee for accounts that only need a clear record and a few charts.
- An engagement rate you understand. The formula is visible in the sheet: total engagement divided by reach. Nothing is hidden inside a vendor’s black box.
- Quality signals, not vanity counts. Saves and shares get their own chart, which helps you favour content people keep and pass on.
- Your data stays in your Drive. You decide who sees the sheet, and there is no account login to hand over.
- Room to grow. The charts read up to row 1000 and the dropdown lists run to row 500, which covers years of posting for most accounts.
Opportunities for Improvement
- Manual entry only. There is no Instagram or Meta connection, so numbers must be copied from your insights. Updating a post a few days after it goes live gives steadier figures.
- No follower growth chart. Followers are logged per post, but growth is read from the table rather than a dedicated chart or change column.
- Reach-based rate only. If you prefer an engagement rate based on followers, you would add your own column.
- One account per copy. There is no account column, so agencies need a separate copy for each client.
- Busy charts at volume. Reach by Post and Saves vs Shares by Post show one bar per post, so labels get crowded once you log many posts.
- Chip style is a manual step. Google does not let scripts set the chip display style, so it takes a one-time 10-second change per column.
Best Practices
- Record numbers at the same age. Enter each post’s metrics after a fixed window, such as 7 days, so every post in your Instagram growth engagement tracker is compared fairly.
- Keep categories few and clear. Eight or so content categories on the List tab make patterns easier to spot than dozens of near-duplicates.
- Use Notes for context. Record sales, collaborations or trending audio used, so a spike makes sense months later.
- Review monthly. Filter by Performance and Post Type once a month and plan more of what lands in High.
- Pair it with a content plan. Our Social Media Posting Calendar in Google Sheets guide covers the planning side, and the YouTube Video Ideas & Upload Tracker walkthrough shows the same approach for video.
If you are new to Sheets, Google’s help pages on creating dropdown lists and adding and editing charts explain the features this tracker uses.
Explore Relevant Templates
- YouTube Video Ideas & Upload Tracker in Google Sheets — plan ideas, scripts and uploads.
- Podcast Episode Planning Tracker in Google Sheets — read the podcast tracker guide.
- Social Media Posting Calendar in Google Sheets — schedule posts across platforms.
- Social Media Influencer Tracking Dashboard in Google Sheets — see the dashboard walkthrough.
- For a broader view of channel results, the Social Media Performance Dashboard in Google Sheets and the YouTube Channel Performance Tracker posts are good next reads.
- 💎 Want the full set? The Marketing Manager Toolkit – 9 Premium Templates bundles marketing templates for Excel and Google Sheets.
Frequently Asked Questions
Does the Instagram Growth & Engagement Tracker pull data from Instagram?
No. The tracker has no Instagram or Meta API connection and does not import followers or insights. You enter reach, likes, comments, saves and shares for each post, and the Instagram Growth & Engagement Tracker then calculates Total Engagement, Engagement Rate and Performance instantly.
How does the tracker calculate engagement rate?
Engagement Rate is Total Engagement divided by Reach, and Total Engagement is Likes + Comments + Saves + Shares. Using reach measures how people who actually saw the post responded, which is fairer for accounts whose reach varies a lot from post to post.
What counts as a High, Good or Low post?
A published post is High when its engagement rate is 6% or more, Good at 3% or more, and Low below 3%. Scheduled or Draft posts without reach show a dash, so the Instagram Growth & Engagement Tracker only rates posts that have real numbers.
How long does setup take?
About 10 minutes. Make a copy from the PDF link, adjust post types, categories and statuses on the List tab, then replace the 15 sample posts with your own. The card, the four charts and the automatic columns work as soon as your numbers are in.
Can my team or clients use the same sheet?
Yes. Because the tracker is a Google Sheets file, you can share it with teammates or clients and edit together in real time. For several Instagram accounts, keep one copy per account, since the post log has no account column.
How does this compare to Sprout Social or Hootsuite?
Paid suites import metrics automatically and add scheduling and inbox tools. The Instagram Growth & Engagement Tracker costs $6.99 once, keeps data in your own Drive, and gives you engagement rate, performance flags and four charts, but every number is entered by hand.
About the Author
Built by PK — Microsoft Certified Professional with 15+ years of Excel, Google Sheets and Power BI experience. Founder of NextGenTemplates, reaching 300K+ subscribers across YouTube channels. Every template is hand-built and tested before release.
Conclusion
If you want to know which posts genuinely grow your account, a simple, honest record beats memory every time. This Instagram growth engagement tracker gives you a post log, automatic engagement rates, performance flags and four charts in a Google Sheets file you own, for a single payment.
👉 Click here to Purchase the Instagram Growth & Engagement Tracker in Google Sheets
✅ Instant download · One-time payment · No subscription
🎥 For step-by-step tutorials, visit Youtube.com/@NeoTechNavigators.
Last updated: September 2026